Laurel Springs, NJ (New Jersey) Houses and Residents
| Laurel Springs: | $261,518 |
| New Jersey: | $428,900 |
Total population: 1,880 (All urban)
Houses: 731 (684 occupied: 560 owner occupied, 136 renter occupied)
| % of renters here: | 20% |
| State: | 35% |
Housing density: 1,563 houses/condos per square mile
Median price asked for vacant for-sale houses and condos in 2022: $501,740.
Median contract rent in 2022: $869 (lower quartile is $759, upper quartile is $1,013)
Median rent asked for vacant for-rent units in 2022: $858
Median gross rent in Laurel Springs, NJ in 2022: $965
Housing units in Laurel Springs with a mortgage: 418 (48 second mortgage, 0 home equity loan, 51 both second mortgage and home equity loan)
Houses without a mortgage: 43
Median household income for houses/condos with a mortgage: $140,788
Median household income for apartments without a mortgage: $88,855
Median monthly housing costs: $1,800
Compare current foreclosures near Laurel Springs, NJ:
| Photo | Address | Area | Beds / Baths | Price | Details |
|---|---|---|---|---|---|

|
#1
Covered Bridge Rd
Cherry Hill, NJ 08034
|
1,343 sq. feet
|
1 baths 3 beds |
$445,000
|
show details |

|
#2
Browning Rd
Merchantville, NJ 08109
|
2,376 sq. feet
|
3 baths 5 beds |
$459,900
|
show details |

|
#3
Christian St
Philadelphia, PA 19146
|
1,612 sq. feet
|
2 baths 5 beds |
$449,900
|
show details |

|
#4
Foxglove Dr
Riverside, NJ 08075
|
840 sq. feet
|
1 baths 2 beds |
$113,683
|
show details |

|
#5
Wood View Dr
Mount Laurel, NJ 08054
|
6,942 sq. feet
|
2 baths 4 beds |
$510,000
|
show details |

|
#6
Fries Mill Rd
Franklinville, NJ 08322
|
2,266 sq. feet
|
2 baths 3 beds |
$379,900
|
show details |

|
#7
N Marshall St
Philadelphia, PA 19122
|
1,769 sq. feet
|
2 baths 3 beds |
$414,500
|
show details |

|
#8
N 59th St
Philadelphia, PA 19151
|
1,244 sq. feet
|
1 baths 3 beds |
$231,500
|
show details |

|
#9
N Front St Apt B
Philadelphia, PA 19123
|
2,491 sq. feet
|
2 baths 3 beds |
$599,900
|
show details |

|
#10
Yeadon Ave
Lansdowne, PA 19050
|
1,388 sq. feet
|
1 baths 3 beds |
$268,500
|
show details |
| Photo | Address | Area | Beds / Baths | Price | Details |
|---|---|---|---|---|---|

|
#11
Manor Ln
Willingboro, NJ 08046
|
1,576 sq. feet
|
2 baths 3 beds |
$390,000
|
show details |

|
#12
Harvey Ave
Pennsauken, NJ 08110
|
1,555 sq. feet
|
2 baths 4 beds |
$405,000
|
show details |

|
#13
Jessamine Ave
Oaklyn, NJ 08107
|
864 sq. feet
|
2 baths 5 beds |
$379,900
|
show details |

|
#14
Pershing Ave
Darby, PA 19023
|
1,179 sq. feet
|
1 baths 3 beds |
$309,900
|
show details |

|
#15
N Hicks St
Philadelphia, PA 19132
|
970 sq. feet
|
1 baths 3 beds |
$62,900
|
show details |

|
#16
Kershaw St
Philadelphia, PA 19131
|
1,284 sq. feet
|
1 baths 3 beds |
$134,500
|
show details |

|
#17
Edgewood Ave
Audubon, NJ 08106
|
1,250 sq. feet
|
1 baths 4 beds |
$340,000
|
show details |

|
#18
Harmer St
Philadelphia, PA 19131
|
1,134 sq. feet
|
1 baths 3 beds |
$70,000
|
show details |

|
#19
N Main St
Williamstown, NJ 08094
|
1,077 sq. feet
|
1 baths 2 beds |
$194,900
|
show details |

|
#20
Westford Rd
Philadelphia, PA 19120
|
1,140 sq. feet
|
1 baths 3 beds |
$88,062
|
show details |
| Photo | Address | Area | Beds / Baths | Price | Details |
|---|---|---|---|---|---|

|
#21
S 57th St
Philadelphia, PA 19143
|
1,158 sq. feet
|
1 baths 3 beds |
$228,800
|
show details |

|
#22
N Peach St
Philadelphia, PA 19139
|
1,120 sq. feet
|
1 baths 3 beds |
$1
|
show details |

|
#23
Lindley Ave
Philadelphia, PA 19120
|
1,350 sq. feet
|
1 baths 3 beds |
$1
|
show details |

|
#24
S 56th St
Philadelphia, PA 19143
|
1,600 sq. feet
|
1 baths 4 beds |
$3,100
|
show details |

|
#25
Sigel St
Philadelphia, PA 19145
|
1,018 sq. feet
|
1 baths 3 beds |
$219,169
|
show details |

|
#26
Dounton St
Philadelphia, PA 19140
|
908 sq. feet
|
1 baths 3 beds |
$3,100
|
show details |

|
#27
N 9th St
Philadelphia, PA 19140
|
1,024 sq. feet
|
1 baths 3 beds |
$3,100
|
show details |

|
#28
Montague St
Philadelphia, PA 19124
|
972 sq. feet
|
1 baths 3 beds |
$41,785
|
show details |

|
#29
Tolbut St
Philadelphia, PA 19136
|
1,120 sq. feet
|
1 baths 3 beds |
$3,100
|
show details |

|
#30
Dillman St
Philadelphia, PA 19140
|
728 sq. feet
|
1 baths 2 beds |
$1
|
show details |
| Photo | Address | Area | Beds / Baths | Price | Details |
|---|---|---|---|---|---|

|
#31
S Millick St
Philadelphia, PA 19142
|
992 sq. feet
|
1 baths 3 beds |
$3,100
|
show details |

|
#32
N 9th St
Philadelphia, PA 19140
|
784 sq. feet
|
1 baths 3 beds |
$1
|
show details |

|
#33
N 10th St
Philadelphia, PA 19141
|
1,680 sq. feet
|
1 baths 4 beds |
$30,927
|
show details |

|
#34
Fisk Ave
Philadelphia, PA 19129
|
360 sq. feet
|
1 baths 3 beds |
$37,390
|
show details |

|
#35
N 15th St
Philadelphia, PA 19141
|
1,446 sq. feet
|
1 baths 3 beds |
$3,100
|
show details |

|
#36
E Courtland St
Philadelphia, PA 19120
|
800 sq. feet
|
1 baths 3 beds |
$76,008
|
show details |

|
#37
N Sydenham St
Philadelphia, PA 19140
|
912 sq. feet
|
1 baths 3 beds |
$1
|
show details |

|
#38
Spruce St
Philadelphia, PA 19139
|
1,420 sq. feet
|
1 baths 3 beds |
$3,100
|
show details |

|
#39
W Wilt St
Philadelphia, PA 19121
|
912 sq. feet
|
1 baths 3 beds |
$1
|
show details |

|
#40
Wyalusing Ave
Philadelphia, PA 19131
|
1,348 sq. feet
|
1 baths 3 beds |
$3,100
|
show details |
| Photo | Address | Area | Beds / Baths | Price | Details |
|---|---|---|---|---|---|

|
#41
W Airdrie St
Philadelphia, PA 19140
|
1,560 sq. feet
|
1 baths 4 beds |
$1
|
show details |

|
#42
Roosevelt Blvd
Philadelphia, PA 19152
|
1,536 sq. feet
|
1 baths 4 beds |
$1
|
show details |

|
#43
S 19th St
Philadelphia, PA 19145
|
1,180 sq. feet
|
1 baths 3 beds |
$3,100
|
show details |

|
#44
Fostertown Ln
Mullica Hill, NJ 08062
|
- sq. feet
|
1 baths 3 beds |
$319,900
|
show details |

|
#45
W Oakdale St
Philadelphia, PA 19132
|
1,134 sq. feet
|
1 baths 3 beds |
$1,322,645
|
show details |

|
#46
Reinhard St
Philadelphia, PA 19142
|
1,280 sq. feet
|
1 baths 3 beds |
$1
|
show details |

|
#47
Upland St
Philadelphia, PA 19142
|
1,100 sq. feet
|
1 baths 3 beds |
$1
|
show details |

|
#48
Reinhard St
Philadelphia, PA 19142
|
1,180 sq. feet
|
1 baths 3 beds |
$1
|
show details |

|
#49
N 11th St
Philadelphia, PA 19141
|
1,210 sq. feet
|
1 baths 3 beds |
$3,100
|
show details |

|
Check over 1 million property listings on Foreclosure.com!
|
browse all offers | |||


 | Couple with Young Child Moving to South NJ--Both Want Different Things (31 replies) |
| Great Places to hear Live Music (local bands) (10 replies) |
| Are these good towns to buy a home??? (23 replies) |
| Anybody have an info on Stratford and Laurel Springs? (12 replies) |
| Anyone have any thoughts on Clementon, NJ (49 replies) |
| Somerdale or Mount Laurel? (12 replies) |

Median year apartment built: 1968
Household type by relationship:
Households: 2,012- Male householders: 339 (77 living alone), Female householders: 343 (98 living alone)
371 spouses (368 opposite-sex spouses), 72 unmarried partners, (71 opposite-sex unmarried partners), 690 children (621 natural, 15 adopted, 53 stepchildren), 46 grandchildren, 9 brothers or sisters, 58 parents, 0 foster children, 50 other relatives, 32 non-relatives
Size of family households: 108 2-persons, 121 3-persons, 101 4-persons, 68 5-persons, 33 6-persons, 21 7-or-more-persons.
Size of nonfamily households: 177 1-person, 52 2-persons, 1 4-persons.
346 married couples with children.
28 single-parent households (13 men, 15 women).
91.4% of residents of Laurel Springs speak English at home.
1.2% of residents speak Spanish at home (100% speak English very well).
2.2% of residents speak other Indo-European language at home (56% speak English very well, 40% speak English well, 5% speak English not well).
3.0% of residents speak Asian or Pacific Island language at home (48% speak English very well, 52% speak English well).
0.7% of residents speak other language at home (100% speak English very well).
Foreign born population: 110 (5.5%)
(32.7% of them are naturalized citizens)
| Here: | 7.5 |
| State: | 6.8 |
| Here: | 3.3 |
| State: | 3.9 |

- Bedrooms in owner-occupied houses and condos in Laurel Springs, New Jersey
- 0no bedroom
- 171 bedroom
- 352 bedrooms
- 2413 bedrooms
- 2084 bedrooms
- 595+ bedrooms

- Bedrooms in renter-occupied apartments in Laurel Springs, New Jersey
- 17no bedroom
- 761 bedroom
- 182 bedrooms
- 203 bedrooms
- 44 bedrooms
- 05+ bedrooms

- Cars and other vehicles available in Laurel Springs in owner-occupied houses/condos
- 11no vehicle
- 1171 vehicle
- 2082 vehicles
- 1093 vehicles
- 924 vehicles
- 245+ vehicles

- Cars and other vehicles available in Laurel Springs in renter-occupied apartments
- 19no vehicle
- 711 vehicle
- 392 vehicles
- 33 vehicles
- 44 vehicles
- 05+ vehicles

- Rooms in owner-occupied houses in Laurel Springs, New Jersey
- 01 room
- 02 rooms
- 43 rooms
- 224 rooms
- 475 rooms
- 1056 rooms
- 967 rooms
- 1198 rooms
- 1679+ rooms

- Rooms in renter-occupied apartments in Laurel Springs, New Jersey
- 171 room
- 282 rooms
- 253 rooms
- 334 rooms
- 75 rooms
- 106 rooms
- 87 rooms
- 48 rooms
- 49+ rooms


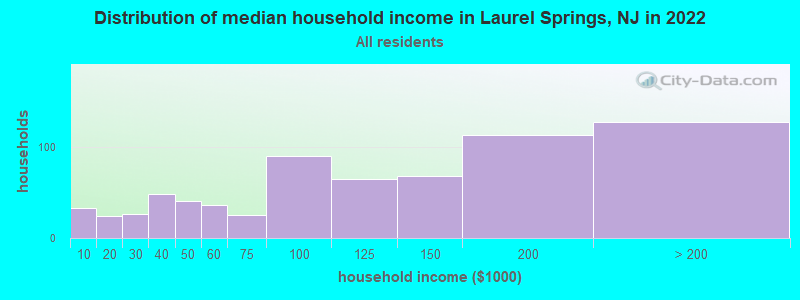
Laurel Springs, NJ household income distribution

- 33Less than $10,000
- 24$10,000 to $19,999
- 26$20,000 to $29,999
- 48$30,000 to $39,999
- 41$40,000 to $49,999
- 36$50,000 to $59,999
- 25$60,000 to $74,999
- 90$75,000 to $99,999
- 65$100,000 to $124,999
- 68$125,000 to $149,999
- 113$150,000 to $199,999
- 127$200,000 or more
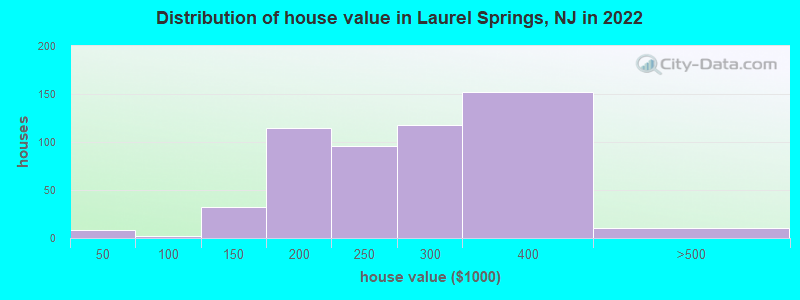
Home value of owner - occupied houses in 2022 in Laurel Springs, NJ
-
- 8Less than $10,000
- 2$60,000 to $69,999
- 13$100,000 to $124,999
- 18$125,000 to $149,999
- 43$150,000 to $174,999
- 71$175,000 to $199,999
- 96$200,000 to $249,999
- 117$250,000 to $299,999
- 152$300,000 to $399,999
- 10$400,000 to $499,999
Rent paid by renters in 2022 in Laurel Springs, NJ
-
- 33$750 to $799
- 36$800 to $899
- 13$900 to $999
- 9$1,000 to $1,249
- 4$1,250 to $1,499
- 20$1,500 to $1,999


Percentage of workers working in this county: 61.0%
Number of people working at home: 114 (10.5% of all workers)
Travel time to work (commute)
- Less than 5 minutes: 39
- 5 to 9 minutes: 146
- 10 to 14 minutes: 82
- 15 to 19 minutes: 128
- 20 to 24 minutes: 105
- 25 to 29 minutes: 45
- 30 to 34 minutes: 145
- 35 to 39 minutes: 85
- 40 to 44 minutes: 13
- 45 to 59 minutes: 53
- 60 to 89 minutes: 73
- 90 or more minutes: 49
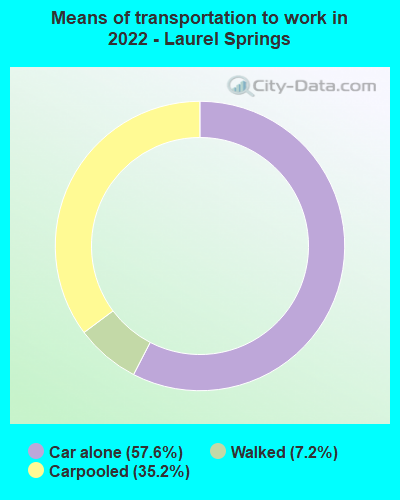
Means of transportation to work:
- Drove a car alone: 145 (39.4%)
- Carpooled: 117 (31.8%)
- Walked: 25 (6.8%)
- Worked at home: 114 (31.0%)

- Unemployment by race in 2022
- Unemployment rate for White non-Hispanic residents
- 5.2%Males
- 2.8%Females

- Year of entry for the foreign-born population in Laurel Springs, New Jersey
- 382010 or later
- 142000 to 2009
- 361990 to 1999
- 131980 to 1989
- 71970 to 1979
- 12Before 1970

First ancestries reported:
- Irish: 139 (29.3%)
- Italian: 60 (12.6%)
- English: 37 (7.8%)
- American: 36 (7.6%)
- German: 20 (4.2%)
- Czechoslovakian: 15 (3.2%)
- Russian: 12 (2.5%)
- Polish: 8 (1.7%)
- African: 5 (1.1%)
- Carpatho Rusyn: 4 (0.8%)
- European: 3 (0.6%)
- Swedish: 3 (0.6%)
- Albanian: 1 (0.2%)
- British: 1 (0.2%)
- Eastern European: 1 (0.2%)
- Scottish: 1 (0.2%)
Most common places of birth for foreign-born residents (%):
| Laurel Springs: | 26.2% (28) |
| New Jersey: | 4.0% (85,934) |
| Laurel Springs: | 21.5% (23) |
| New Jersey: | 0.9% (20,371) |
| Laurel Springs: | 14.0% (15) |
| New Jersey: | 0.7% (15,644) |
| Laurel Springs: | 13.1% (14) |
| New Jersey: | 4.8% (102,527) |
| Laurel Springs: | 12.1% (13) |
| New Jersey: | 1.1% (22,760) |
| Laurel Springs: | 5.6% (6) |
| New Jersey: | 1.2% (25,213) |
| Laurel Springs: | 1.9% (2) |
| New Jersey: | 12.8% (274,609) |
Place of birth for U.S.-born residents:
- This state: 1,432
- Other state: 453
- Northeast: 376
- Midwest: 22
- South: 46
- West: 9
97.1% of Laurel Springs residents lived in the same house 1 years ago.
Out of people who lived in different houses, 37.7% lived in this county.
Out of people who lived in different counties, 84.2% lived in New Jersey.
| Laurel Springs: | 97.1% |
| State average: | 90.4% |
Education attainment for males 25 years and older:
- No schooling: 0
- Nursery to 4th grade: 7
- 5th and 6th grade: 0
- 7th and 8th grade: 0
- 9th grade: 22
- 10th grade: 0
- 11th grade: 1
- 12th grade, no diploma: 3
- High school graduate (or equivalency): 171
- Less than 1 year of college: 61
- Some college more than 1 year, no degree: 57
- Associate degree: 53
- Bachelor's degree: 166
- Master's degree: 60
- Professional school degree: 7
- Doctorate degree: 28

Education attainment for females 25 years and older:
- No schooling: 25
- Nursery to 4th grade: 0
- 5th and 6th grade: 0
- 7th and 8th grade: 0
- 9th grade: 4
- 10th grade: 3
- 11th grade: 6
- 12th grade, no diploma: 5
- High school graduate (or equivalency): 154
- Less than 1 year of college: 50
- Some college more than 1 year, no degree: 87
- Associate degree: 61
- Bachelor's degree: 191
- Master's degree: 57
- Professional school degree: 7
- Doctorate degree: 35


Housing units in structures:
- One, detached: 593
- One, attached: 20
- Two: 7
- 3 or 4: 33
- 5 to 9: 12
- 10 to 19: 28
- 50 or more: 37
Housing units lacking complete kitchen facilities in 2022: 2.2%
House/condo owner moved in on average 20 years ago
Renter moved in on average 7 years ago

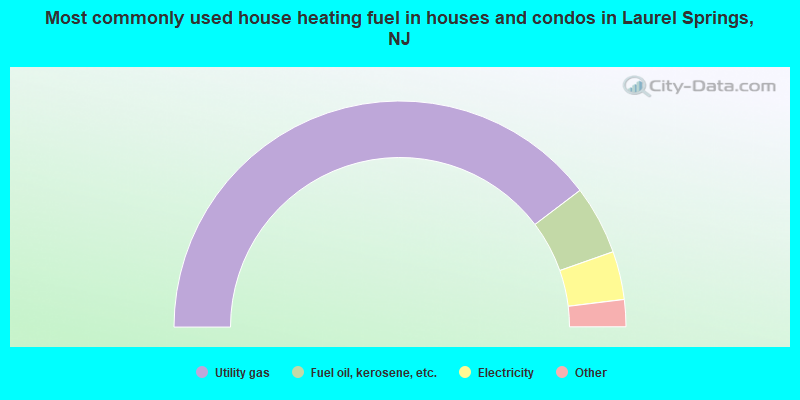
- 79.5%Utility gas
- 9.9%Fuel oil, kerosene, etc.
- 6.9%Electricity
- 2.2%No fuel used
- 1.5%Bottled, tank, or LP gas
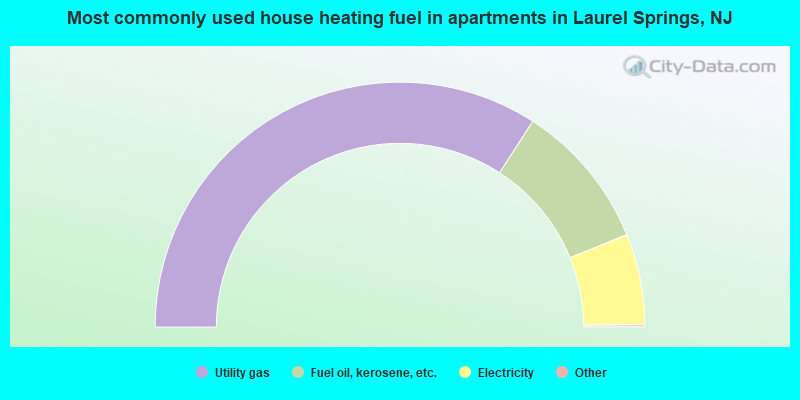
- 68.4%Utility gas
- 19.5%Fuel oil, kerosene, etc.
- 12.0%Electricity
Private vs. public school enrollment:
| Here: | 9.5% |
| New Jersey: | 12.3% |
| Here: | 25.0% |
| New Jersey: | 13.1% |
| Here: | 35.0% |
| New Jersey: | 33.2% |


