Kendall West, FL (Florida) Houses and Residents
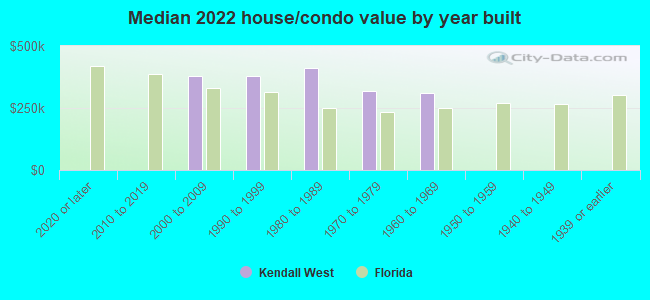
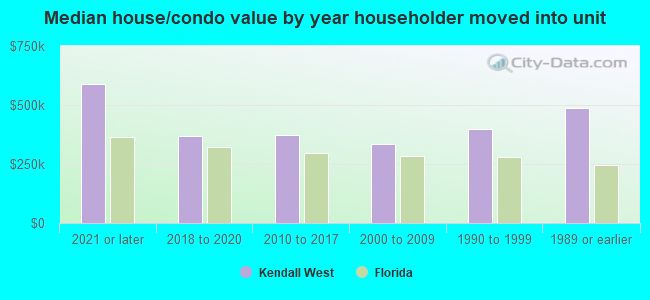
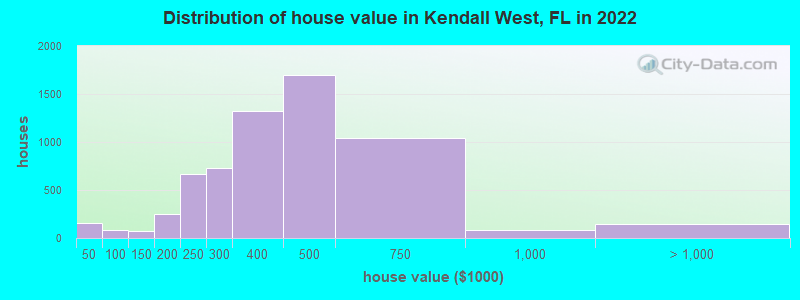
Estimated median house or condo value in 2022: $392,274 (it was $105,100 in 2000 )
Kendall West:
$392,274Florida:
$354,100
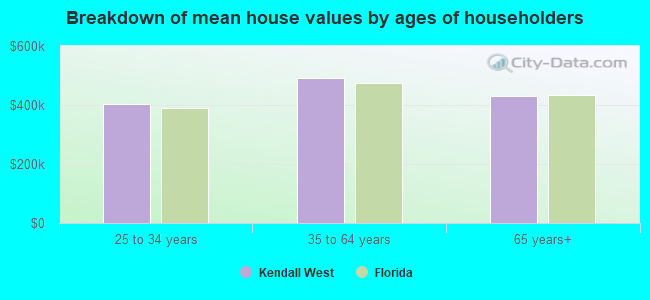
Lower value quartile - upper value quartile: $297,140 - $539,061Mean price in 2022: Detached houses: $607,958 Here:
$607,958State:
$500,941
Townhouses or other attached units: $315,825 Here:
$315,825State:
$370,869
In 2-unit structures: $173,833 Here:
$173,833State:
$423,188
In 3-to-4-unit structures: $281,659 Here:
$281,659State:
$309,944
In 5-or-more-unit structures: $257,109 Here:
$257,109State:
$447,145
Mobile homes: $194,027 Here:
$194,027State:
$113,202
Total population: 36,154 (All urban)
Houses: 13,527 (13,015 occupied: 7,099 owner occupied, 6,088 renter occupied )
% of renters here:
46%State:
33%
Housing density: 3,990 houses/condos per square mile
Median price asked for vacant for-sale houses and condos in 2022: $532,726.
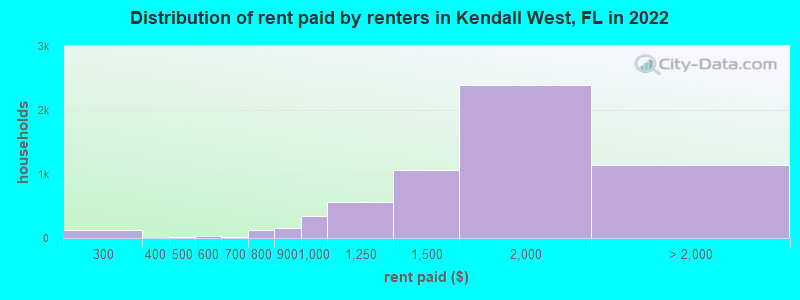
Median contract rent in 2022: $1,611 (lower quartile is $1,251, upper quartile is $1,925)
Median rent asked for vacant for-rent units in 2022: $1,884
Median gross rent in Kendall West, FL in 2022: $1,699
Housing units in Kendall West with a mortgage: 4,595 (265 second mortgage, 6 home equity loan, 227 both second mortgage and home equity loan )Houses without a mortgage: 225
Median household income for houses/condos with a mortgage: $81,584
Median household income for apartments without a mortgage: $52,951
Median monthly housing costs: $1,578
Data:
Median house or condo value ($)
Median house or condo value ($ change since 2000)
Median house or condo value ($) - White
Median house or condo value ($) - Black or African American
Median house or condo value ($) - Asian
Median house or condo value ($) - Hispanic or Latino
Median house or condo value ($) - American Indian and Alaska Native
Median house or condo value ($) - Multirace
Median house or condo value ($) - Other Race
Median price asked for mobile homes ($)
Household density (households per square mile)
Mean house or condo value by units in structure - 1, detached ($)
Mean house or condo value by units in structure - 1, attached ($)
Mean house or condo value by units in structure - 2 ($)
Mean house or condo value by units in structure by units in structure - 3 or 4 ($)
Mean house or condo value by units in structure - 5 or more ($)
Mean house or condo value by units in structure - Boat, RV, van, etc. ($)
Mean house or condo value by units in structure - Mobile home ($)
Median contract rent ($)
Median contract rent - Lower quartile ($)
Median contract rent - Upper quartile ($)
Median gross rent ($)
Urban houses (%)
Rural houses (%)
Houses occupied (%)
Houses occupied (% change since 2000)
Houses owner occupied (%)
Houses owner occupied (% change since 2000)
Houses renter occupied (%)
Houses renter occupied (% change since 2000)
Vacant housing units - For rent (%)
Vacant housing units - For rent (% change since 2000)
Vacant housing units - For sale only (%)
Vacant housing units - For sale only (% change since 2000)
Vacant housing units - Rented or sold, not occupied (%)
Vacant housing units - Rented or sold, not occupied (% change since 2000)
Vacant housing units - For seasonal, recreational, or occasional use (%)
Vacant housing units - For seasonal, recreational, or occasional use (% change since 2000)
Vacant housing units - For migrant workers (%)
Vacant housing units - For migrant workers (% change since 2000)
Vacant housing units - Other vacant (%)
Vacant housing units - Other vacant (% change since 2000)
Median monthly housing costs ($)
Median household income for houses/condos with a mortgage ($)
Median household income for houses/condos without a mortgage ($)
Median household income ($)
Median household income ($) - White
Median household income ($) - Black or African American
Median household income ($) - Asian
Median household income ($) - Hispanic or Latino
Median household income ($) - American Indian and Alaska Native
Median household income ($) - Multirace
Median household income ($) - Other Race
Mortgage status - with mortgage (%)
Mortgage status - with second mortgage (%)
Mortgage status - with home equity loan (%)
Mortgage status - with both second mortgage and home equity loan (%)
Mortgage status - without a mortgage (%)
Median year house/condo built
Median year apartment built
Household type by relationship - Male householder living alone (%)
Household type by relationship - Male householder not living alone (%)
Household type by relationship - Female householder living alone (%)
Household type by relationship - Female householder not living alone (%)
Household type by relationship - Opposite-Sex spouse (%)
Household type by relationship - Same-Sex spouse (%)
Household type by relationship - Opposite-Sex unmarried partner (%)
Household type by relationship - Same-Sex unmarried partner (%)
Household type by relationship - In group quarters (%)
Size of family households - 2-person household (%)
Size of family households - 3-person household (%)
Size of family households - 4-person household (%)
Size of family households - 5-person household (%)
Size of family households - 6-person household (%)
Size of family households - 7-or-more-person household (%)
Size of nonfamily households - 1-person household (%)
Size of nonfamily households - 2-person household (%)
Size of nonfamily households - 3-person household (%)
Size of nonfamily households - 4-person household (%)
Size of nonfamily households - 5-person household (%)
Size of nonfamily households - 6-person household (%)
Size of nonfamily households - 7-or-moreperson household (%)
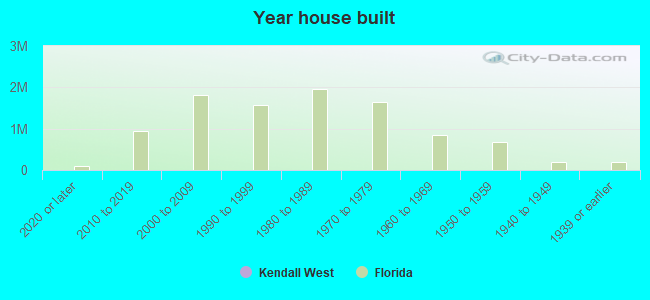
Year house built - Built 2010 or later (%)
Year house built - Built 2000 to 2009 (%)
Year house built - Built 1990 to 1999 (%)
Year house built - Built 1980 to 1989 (%)
Year house built - Built 1970 to 1979 (%)
Year house built - Built 1960 to 1969 (%)
Year house built - Built 1950 to 1959 (%)
Year house built - Built 1940 to 1949 (%)
Year house built - Built 1939 or earlier (%)
Median number of rooms in houses and condos
Median number of rooms in apartments
Median number of bedrooms in owner occupied houses
Mean number of bedrooms in owner occupied houses
Median number of bedrooms in renter occupied houses
Mean number of bedrooms in renter occupied houses
Median number of vehichles in owner occupied houses
Mean number of vehichles in owner occupied houses
Median number of vehichles in renter occupied houses
Mean number of vehichles in renter occupied houses
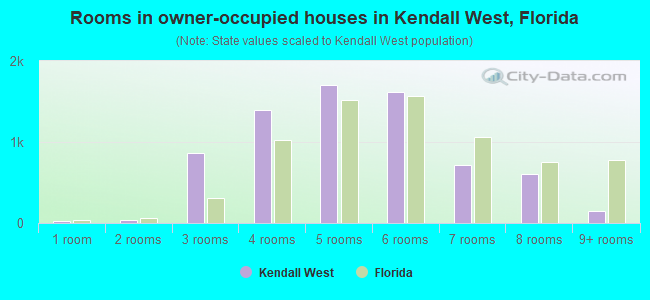
Rooms in owner-occupied houses - 1 room (%)
Rooms in owner-occupied houses - 2 rooms (%)
Rooms in owner-occupied houses - 3 rooms (%)
Rooms in owner-occupied houses - 4 rooms (%)
Rooms in owner-occupied houses - 5 rooms (%)
Rooms in owner-occupied houses - 6 rooms (%)
Rooms in owner-occupied houses - 7 rooms (%)
Rooms in owner-occupied houses - 8 rooms (%)
Rooms in owner-occupied houses - 9+ rooms (%)
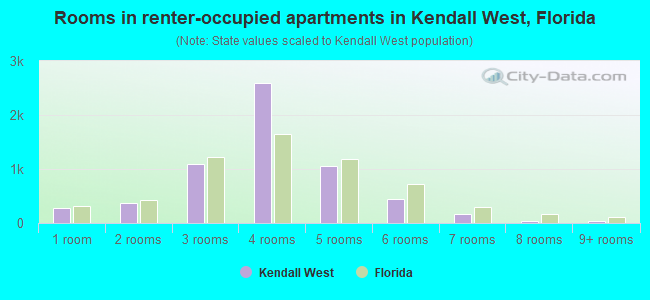
Rooms in renter-occupied houses - 1 room (%)
Rooms in renter-occupied houses - 2 rooms (%)
Rooms in renter-occupied houses - 3 rooms (%)
Rooms in renter-occupied houses - 4 rooms (%)
Rooms in renter-occupied houses - 5 rooms (%)
Rooms in renter-occupied houses - 6 rooms (%)
Rooms in renter-occupied houses - 7 rooms (%)
Rooms in renter-occupied houses - 8 rooms (%)
Rooms in renter-occupied houses - 9+ rooms (%)
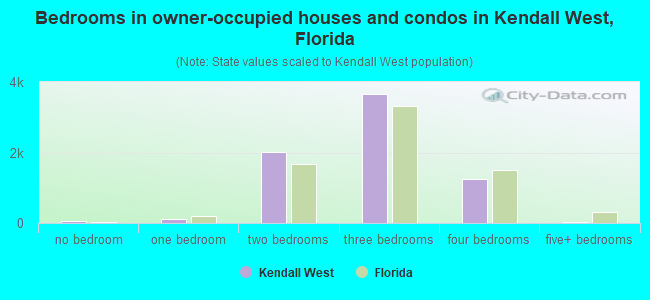
Bedrooms in owner-occupied houses - no bedrooms (%)
Bedrooms in owner-occupied houses - 1 bedroom (%)
Bedrooms in owner-occupied houses - 2 bedrooms (%)
Bedrooms in owner-occupied houses - 3 bedrooms (%)
Bedrooms in owner-occupied houses - 4 bedrooms (%)
Bedrooms in owner-occupied houses - 5+ bedrooms (%)
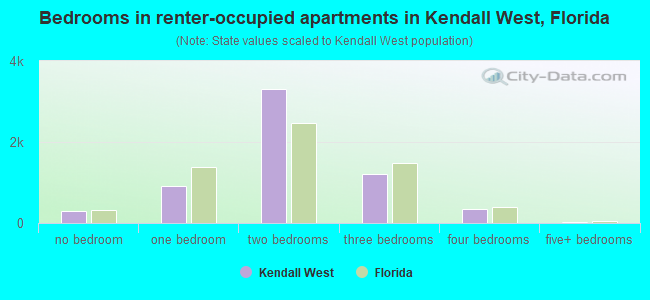
Bedrooms in renter-occupied houses - no bedrooms (%)
Bedrooms in renter-occupied houses - 1 bedroom (%)
Bedrooms in renter-occupied houses - 2 bedrooms (%)
Bedrooms in renter-occupied houses - 3 bedrooms (%)
Bedrooms in renter-occupied houses - 4 bedrooms (%)
Bedrooms in renter-occupied houses - 5+ bedrooms (%)
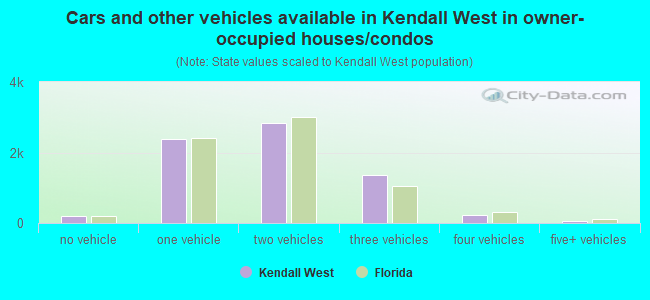
Vehicles available in owner-occupied houses - no vehicle available (%)
Vehicles available in owner-occupied houses - 1 vehicle available(%)
Vehicles available in owner-occupied houses - 2 Vehicles available (%)
Vehicles available in owner-occupied houses - 3 Vehicles available (%)
Vehicles available in owner-occupied houses - 4 Vehicles available (%)
Vehicles available in owner-occupied houses - 5+ Vehicles available (%)
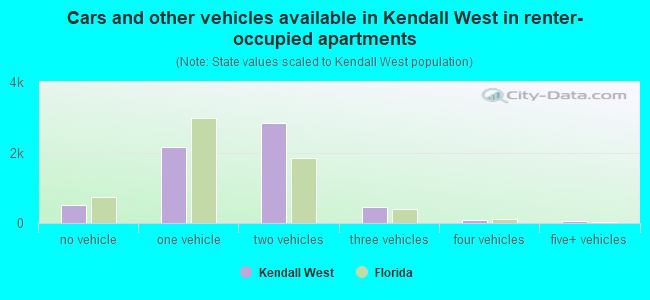
Vehicles available in renter-occupied houses - no vehicle available (%)
Vehicles available in renter-occupied houses - 1 vehicle available (%)
Vehicles available in renter-occupied houses - 2 Vehicles available (%)
Vehicles available in renter-occupied houses - 3 Vehicles available (%)
Vehicles available in renter-occupied houses - 4 Vehicles available (%)
Vehicles available in renter-occupied houses - 5+ Vehicles available (%)
Housing units in structures - 1, detached (%)
Housing units in structures - 1, attached (%)
Housing units in structures - 2 (%)
Housing units in structures - 3 or 4 (%)
Housing units in structures - 5 to 9 (%)
Housing units in structures - 10 to 19 (%)
Housing units in structures - 20 to 49 (%)
Housing units in structures - 50 or more (%)
Housing units in structures - Mobile home (%)
Housing units in structures - Boat, RV, van, etc. (%)
Housing units in structures - Owners - 1, detached (%)
Housing units in structures - Owners - 1, attached (%)
Housing units in structures - Owners - 2 (%)
Housing units in structures - Owners - 3 or 4 (%)
Housing units in structures - Owners - 5 to 9 (%)
Housing units in structures - Owners - 10 to 19 (%)
Housing units in structures - Owners - 20 to 49 (%)
Housing units in structures - Owners - 50 or more (%)
Housing units in structures - Owners - Mobile home (%)
Housing units in structures - Owners - Boat, RV, van, etc. (%)
Housing units in structures - Renters - 1, detached (%)
Housing units in structures - Renters - 1, attached (%)
Housing units in structures - Renters - 2 (%)
Housing units in structures - Renters - 3 or 4 (%)
Housing units in structures - Renters - 5 to 9 (%)
Housing units in structures - Renters - 10 to 19 (%)
Housing units in structures - Renters - 20 to 49 (%)
Housing units in structures - Renters - 50 or more (%)
Housing units in structures - Renters - Mobile home (%)
Housing units in structures - Renters - Boat, RV, van, etc. (%)
House/condo owner moved in on average (years ago)
Renter moved in on average (years ago)
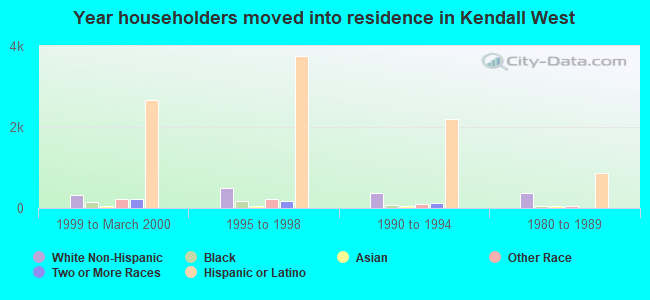
Year householder moved into unit - Moved in 1999 to March 2000 (%)
Year householder moved into unit - Moved in 1999 to March 2000 (%) - White
Year householder moved into unit - Moved in 1999 to March 2000 (%) - Black or African American
Year householder moved into unit - Moved in 1999 to March 2000 (%) - Asian
Year householder moved into unit - Moved in 1999 to March 2000 (%) - Hispanic or Latino
Year householder moved into unit - Moved in 1999 to March 2000 (%) - American Indian and Alaska Native
Year householder moved into unit - Moved in 1999 to March 2000 (%) - Multirace
Year householder moved into unit - Moved in 1999 to March 2000 (%) - Other Race
Year householder moved into unit - Moved in 1995 to 1998 (%)
Year householder moved into unit - Moved in 1995 to 1998 (%) - White
Year householder moved into unit - Moved in 1995 to 1998 (%) - Black or African American
Year householder moved into unit - Moved in 1995 to 1998 (%) - Asian
Year householder moved into unit - Moved in 1995 to 1998 (%) - Hispanic or Latino
Year householder moved into unit - Moved in 1995 to 1998 (%) - American Indian and Alaska Native
Year householder moved into unit - Moved in 1995 to 1998 (%) - Multirace
Year householder moved into unit - Moved in 1995 to 1998 (%) - Other Race
Year householder moved into unit - Moved in 1990 to 1994 (%)
Year householder moved into unit - Moved in 1990 to 1994 (%) - White
Year householder moved into unit - Moved in 1990 to 1994 (%) - Black or African American
Year householder moved into unit - Moved in 1990 to 1994 (%) - Asian
Year householder moved into unit - Moved in 1990 to 1994 (%) - Hispanic or Latino
Year householder moved into unit - Moved in 1990 to 1994 (%) - American Indian and Alaska Native
Year householder moved into unit - Moved in 1990 to 1994 (%) - Multirace
Year householder moved into unit - Moved in 1990 to 1994 (%) - Other Race
Year householder moved into unit - Moved in 1980 to 1989 (%)
Year householder moved into unit - Moved in 1980 to 1989 (%) - White
Year householder moved into unit - Moved in 1980 to 1989 (%) - Black or African American
Year householder moved into unit - Moved in 1980 to 1989 (%) - Asian
Year householder moved into unit - Moved in 1980 to 1989 (%) - Hispanic or Latino
Year householder moved into unit - Moved in 1980 to 1989 (%) - American Indian and Alaska Native
Year householder moved into unit - Moved in 1980 to 1989 (%) - Multirace
Year householder moved into unit - Moved in 1980 to 1989 (%) - Other Race
Year householder moved into unit - Moved in 1970 to 1979 (%)
Year householder moved into unit - Moved in 1970 to 1979 (%) - White
Year householder moved into unit - Moved in 1970 to 1979 (%) - Black or African American
Year householder moved into unit - Moved in 1970 to 1979 (%) - Asian
Year householder moved into unit - Moved in 1970 to 1979 (%) - Hispanic or Latino
Year householder moved into unit - Moved in 1970 to 1979 (%) - American Indian and Alaska Native
Year householder moved into unit - Moved in 1970 to 1979 (%) - Multirace
Year householder moved into unit - Moved in 1970 to 1979 (%) - Other Race
Year householder moved into unit - Moved in 1969 or earlier (%)
Year householder moved into unit - Moved in 1969 or earlier (%) - White
Year householder moved into unit - Moved in 1969 or earlier (%) - Black or African American
Year householder moved into unit - Moved in 1969 or earlier (%) - Asian
Year householder moved into unit - Moved in 1969 or earlier (%) - Hispanic or Latino
Year householder moved into unit - Moved in 1969 or earlier (%) - American Indian and Alaska Native
Year householder moved into unit - Moved in 1969 or earlier (%) - Multirace
Year householder moved into unit - Moved in 1969 or earlier (%) - Other Race
Housing units lacking complete plumbing facilities (%)
Housing units lacking complete kitchen facilities (%)
House heating fuel used in houses and condos - Utility gas (%)
House heating fuel used in houses and condos - Bottled, tank, or LP gas (%)
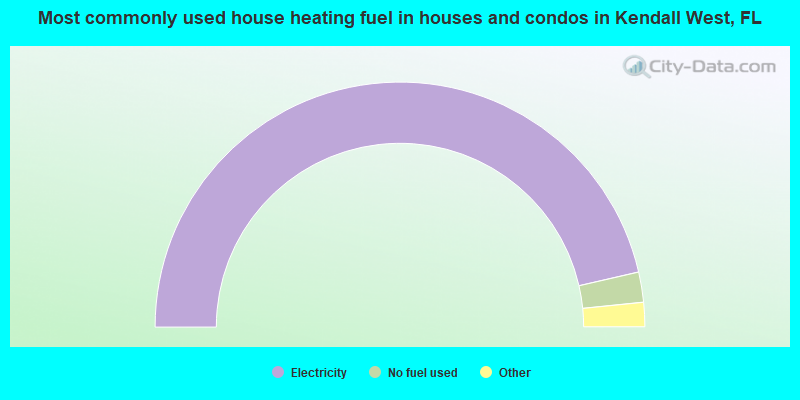
House heating fuel used in houses and condos - Electricity (%)
House heating fuel used in houses and condos - Fuel oil, kerosene, etc. (%)
House heating fuel used in houses and condos - Coal or coke (%)
House heating fuel used in houses and condos - Wood (%)
House heating fuel used in houses and condos - Solar energy (%)
House heating fuel used in houses and condos - Other fuel (%)
House heating fuel used in houses and condos - No fuel used (%)
House heating fuel used in apartments - Utility gas (%)
House heating fuel used in apartments - Bottled, tank, or LP gas (%)
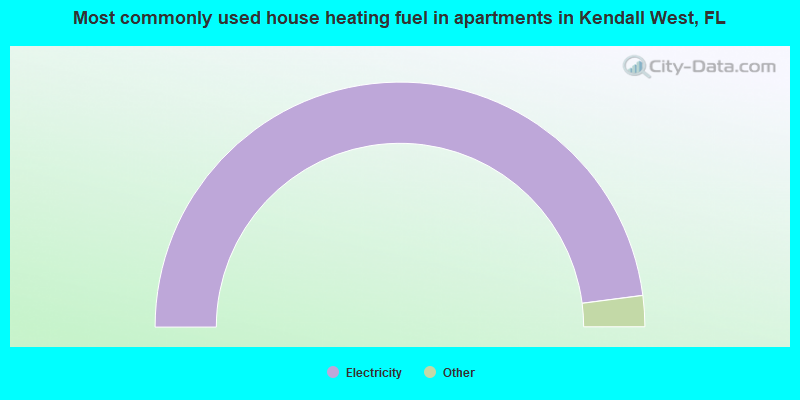
House heating fuel used in apartments - Electricity (%)
House heating fuel used in apartments - Fuel oil, kerosene, etc. (%)
House heating fuel used in apartments - Coal or coke (%)
House heating fuel used in apartments - Wood (%)
House heating fuel used in apartments - Solar energy (%)
House heating fuel used in apartments - Other fuel (%)
House heating fuel used in apartments - No fuel used (%)
Median year house/condo built: 1987Median year apartment built: 1989Household type by relationship:
Households: 35,415
Male householders: 5,529 (558 living alone ), Female householders: 7,177 (1,887 living alone )6,044 spouses (6,030 opposite-sex spouses ), 913 unmarried partners , (857 opposite-sex unmarried partners ), 10,405 children (10,101 natural , 65 adopted , 238 stepchildren ), 811 grandchildren , 457 brothers or sisters , 1,722 parents , 0 foster children , 1,112 other relatives , 1,099 non-relatives In group quarters: 142
Size of family households: 3,866 2-persons , 2,534 3-persons , 2,513 4-persons , 600 5-persons , 158 6-persons , 121 7-or-more-persons .
Size of nonfamily households: 2,622 1-person , 512 2-persons , 131 3-persons , 54 4-persons .
2,953 married couples with children. single-parent households (237 men , 1,606 women ).
8.4% of residents of Kendall West speak English at home. of residents speak Spanish at home (54% speak English very well , 25% speak English well , 14% speak English not well , 7% don't speak English at all ).of residents speak other Indo-European language at home (62% speak English very well , 32% speak English well , 6% speak English not well ).of residents speak Asian or Pacific Island language at home (66% speak English very well , 34% speak English not well ).of residents speak other language at home (83% speak English very well , 5% speak English not well , 12% don't speak English at all ).
Foreign born population: 24,599 (69.5%)of them are naturalized citizens )
Median number of rooms in houses and condos:
Median number of rooms in apartments
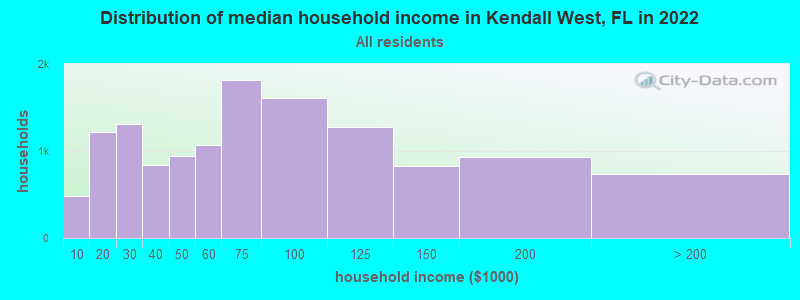
Kendall West, FL household income distribution 484 Less than $10,0001,216 $10,000 to $19,9991,306 $20,000 to $29,999841 $30,000 to $39,999938 $40,000 to $49,9991,072 $50,000 to $59,9991,814 $60,000 to $74,9991,611 $75,000 to $99,9991,273 $100,000 to $124,999824 $125,000 to $149,999936 $150,000 to $199,999731 $200,000 or more
Home value of owner - occupied houses in 2022 in Kendall West, FL 50 Less than $10,00020 $15,000 to $19,99917 $20,000 to $24,99970 $40,000 to $49,9999 $70,000 to $79,9996 $80,000 to $89,99942 $100,000 to $124,99930 $125,000 to $149,99967 $150,000 to $174,999183 $175,000 to $199,999668 $200,000 to $249,999728 $250,000 to $299,9991,326 $300,000 to $399,9991,701 $400,000 to $499,9991,045 $500,000 to $749,99982 $750,000 to $999,99968 $1,000,000 to $1,499,99976 $2,000,000 or moreRent paid by renters in 2022 in Kendall West, FL 19 $100 to $14983 $200 to $24944 $250 to $29914 $400 to $44921 $500 to $54911 $550 to $59914 $600 to $649123 $750 to $799157 $800 to $899339 $900 to $999569 $1,000 to $1,2491,057 $1,250 to $1,4992,394 $1,500 to $1,999621 $2,000 to $2,499121 $2,500 to $2,99943 $3,000 to $3,499345 No cash rent
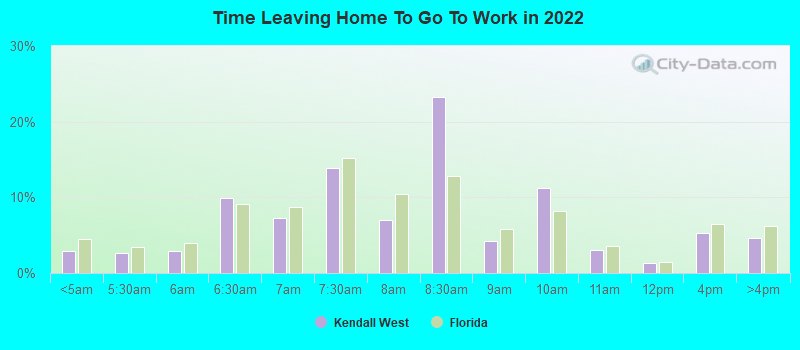
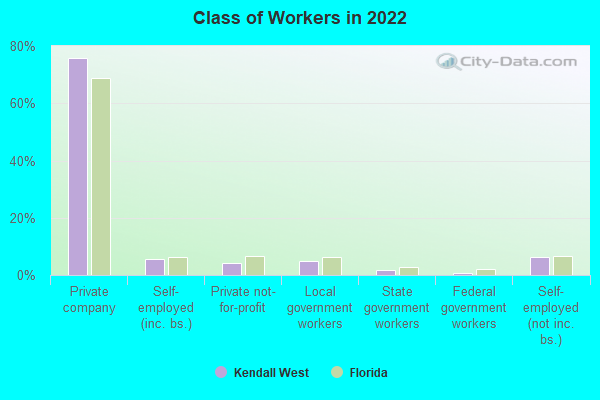
Percentage of workers working in this county: 98.4%Number of people working at home: 1,625 (8.4% of all workers )
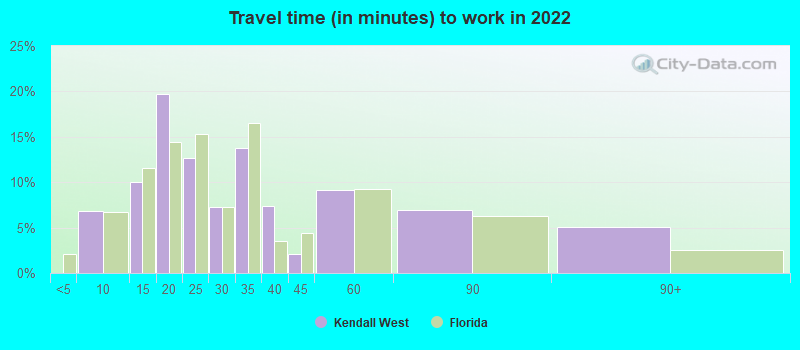
Travel time to work (commute)
Less than 5 minutes: 935 to 9 minutes: 39810 to 14 minutes: 99915 to 19 minutes: 1,62620 to 24 minutes: 2,25325 to 29 minutes: 1,20730 to 34 minutes: 2,98935 to 39 minutes: 66540 to 44 minutes: 1,29145 to 59 minutes: 2,58960 to 89 minutes: 2,03890 or more minutes: 827
Means of transportation to work:
Drove a car alone: 1,758 (51.0%)Carpooled: 331 (9.6%)Bus : 2 (0.1%)Taxi: 34 (1.0%)Walked: 93 (2.7%)Worked at home: 1,625 (47.1%)
Unemployment by race in 2022
Unemployment rate for White non-Hispanic residents 1.0% Males0.9% FemalesUnemployment rate for Black residents 6.1% FemalesUnemployment rate for Asian residents 32.9% FemalesUnemployment rate for other race residents 2.8% FemalesUnemployment rate for two or more race residents 1.8% Males2.6% FemalesUnemployment rate for Hispanic or Latino residents 1.7% Males2.6% Females
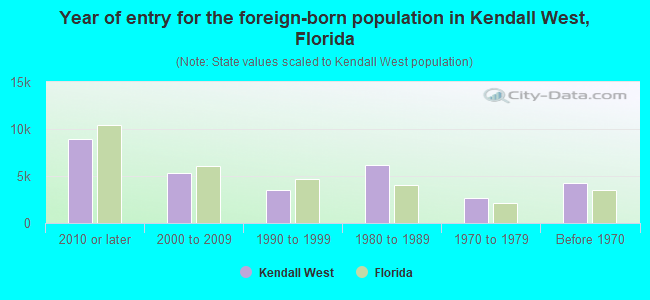
Year of entry for the foreign-born population in Kendall West, Florida
8,901 2010 or later 5,371 2000 to 2009 3,458 1990 to 1999 6,180 1980 to 1989 2,677 1970 to 1979 4,307 Before 1970
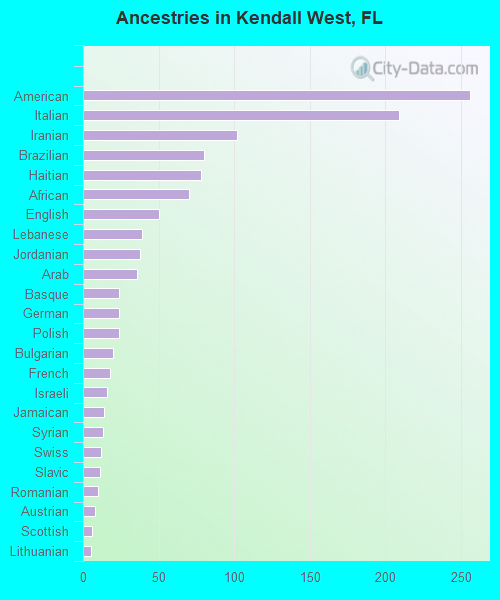
First ancestries reported:
American: 256 (1.0%)
Italian: 209 (0.8%)
Iranian: 102 (0.4%)
Brazilian: 80 (0.3%)
Haitian: 78 (0.3%)
African: 70 (0.3%)
English: 50 (0.2%)
Lebanese: 39 (0.1%)
Jordanian: 38 (0.1%)
Arab: 36 (0.1%)
Basque: 24 (0.09%)
German: 24 (0.09%)
Polish: 24 (0.09%)
Bulgarian: 20 (0.07%)
French: 18 (0.07%)
Israeli: 16 (0.06%)
Jamaican: 14 (0.05%)
Syrian: 13 (0.05%)
Swiss: 12 (0.04%)
Slavic: 11 (0.04%)
Romanian: 10 (0.04%)
Austrian: 8 (0.03%)
Scottish: 6 (0.02%)
Lithuanian: 5 (0.02%)
French Canadian: 2 (0.01%) Most common places of birth for foreign-born residents (%): Cuba Kendall West:
54.9% (13,497)Florida:
22.0% (1,006,576)
Colombia Kendall West:
10.0% (2,466)Florida:
6.5% (298,669)
Venezuela Kendall West:
7.2% (1,770)Florida:
5.7% (262,042)
Nicaragua Kendall West:
7.1% (1,757)Florida:
2.3% (105,066)
Peru Kendall West:
5.4% (1,324)Florida:
2.1% (96,693)
Mexico Kendall West:
2.1% (525)Florida:
5.6% (257,152)
Dominican Republic Kendall West:
1.5% (375)Florida:
3.0% (137,727)
Place of birth for U.S.-born residents:
This state: 8,354Other state: 1,609Northeast: 1,054Midwest: 198South: 160West: 208 92.2% of Kendall West residents lived in the same house 1 years ago.
Out of people who lived in different houses, 48.0% lived in this county.
Out of people who lived in different counties, 46.4% lived in Florida.
Kendall West:
92.2%State average:
86.3%
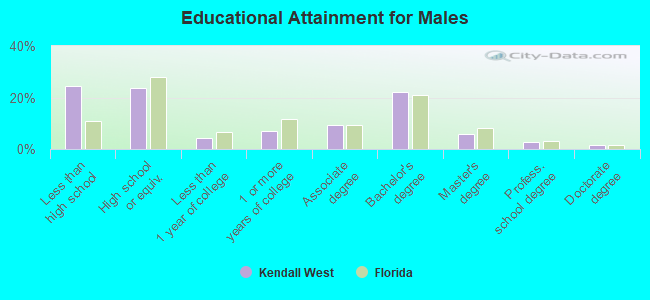
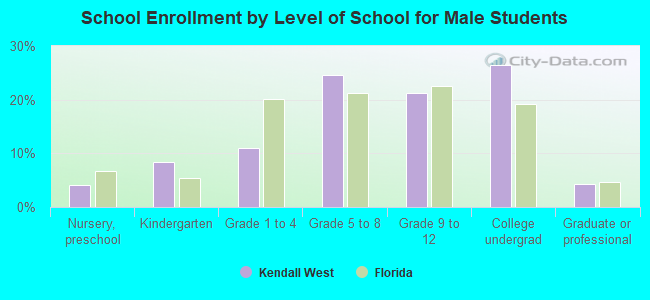
Education attainment for males 25 years and older:
No schooling: 462Nursery to 4th grade: 1065th and 6th grade: 167th and 8th grade: 729th grade: 4710th grade: 15311th grade: 11712th grade, no diploma: 1,970High school graduate (or equivalency): 2,851Less than 1 year of college: 496Some college more than 1 year, no degree: 832Associate degree: 1,108Bachelor's degree: 2,681Master's degree: 706Professional school degree: 308Doctorate degree: 175
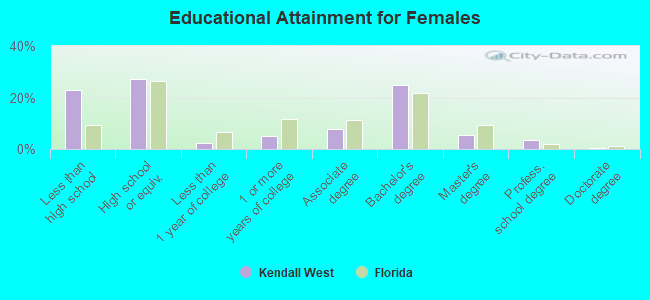
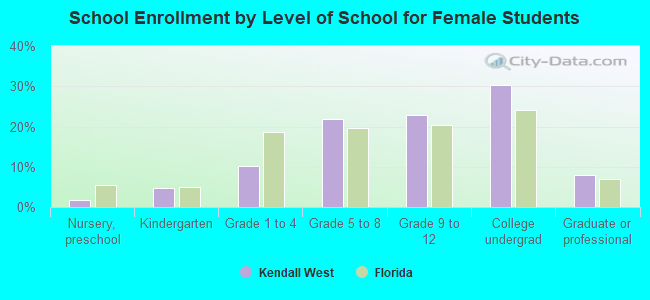
Education attainment for females 25 years and older:
No schooling: 414Nursery to 4th grade: 975th and 6th grade: 1987th and 8th grade: 559th grade: 21810th grade: 1511th grade: 18512th grade, no diploma: 2,177High school graduate (or equivalency): 4,018Less than 1 year of college: 360Some college more than 1 year, no degree: 761Associate degree: 1,167Bachelor's degree: 3,672Master's degree: 798Professional school degree: 513Doctorate degree: 67
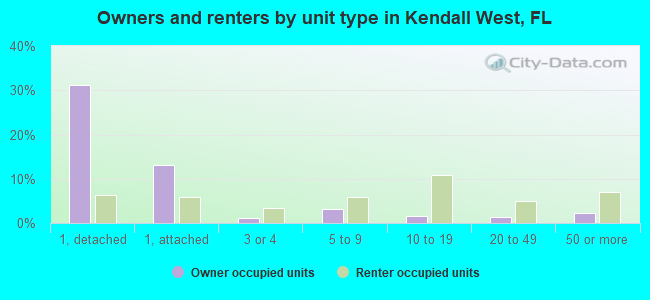
Housing units in structures:
One, detached: 5,254One, attached: 2,348Two: 1823 or 4: 6145 to 9: 1,12610 to 19: 1,66620 to 49: 92450 or more: 1,264Mobile homes: 136Boats, RVs, vans, etc.: 10Housing units lacking complete plumbing facilities in 2022: 0.3%Housing units lacking complete kitchen facilities in 2022: 0.4%House/condo owner moved in on average 14 years ago
Renter moved in on average 5 years ago
Private vs. public school enrollment:
Students in private schools in grades 1 to 8 (elementary and middle school): 217 Students in private schools in grades 9 to 12 (high school): 69 Students in private undergraduate colleges: 294