Katy, TX (Texas) Houses and Residents
| Katy: | $403,686 |
| Texas: | $275,400 |
Mean price in 2022:
Detached houses: $414,578
Here: $414,578 State: $369,058 Townhouses or other attached units: $288,424
Here: $288,424 State: $327,631 Mobile homes: $24,153
Here: $24,153 State: $124,413
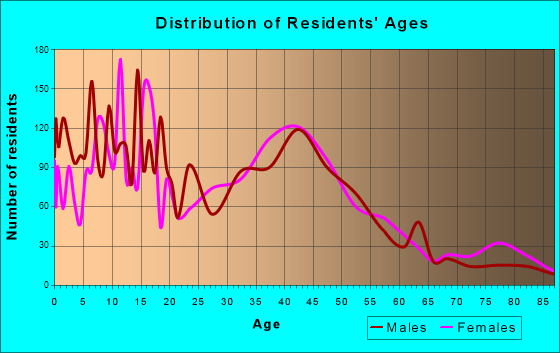
Total population: 15,591 (Urban population: 11,610, Rural population: 120 (11 farm, 109 nonfarm))
Houses: 7,973 (7,243 occupied: 5,837 owner occupied, 1,515 renter occupied)
| % of renters here: | 21% |
| State: | 38% |
Housing density: 747 houses/condos per square mile
Median price asked for vacant for-sale houses and condos in 2022: $1,455,743.
Median contract rent in 2022: $1,219 (lower quartile is $1,040, upper quartile is $1,965)
Median rent asked for vacant for-rent units in 2022: $2,356
Median gross rent in Katy, TX in 2022: $1,465
Housing units in Katy with a mortgage: 3,659 (103 second mortgage, 0 home equity loan, 61 both second mortgage and home equity loan)
Houses without a mortgage: 38
Median household income for houses/condos with a mortgage: $154,490
Median household income for apartments without a mortgage: $107,590
Median monthly housing costs: $1,719
Compare current foreclosures in Katy, TX:
| Photo | Address | Area | Beds / Baths | Price | Details |
|---|---|---|---|---|---|

|
#1
Grand Canyon Gate Dr
Katy, TX 77450
|
2,769 sq. feet
|
3 baths 4 beds |
show details | |

|
#2
Pinecreek Pass Ln
Katy, TX 77449
|
3,040 sq. feet
|
2 baths 4 beds |
show details | |

|
#3
Bear Hunters Dr
Katy, TX 77449
|
- sq. feet
|
3 baths 4 beds |
show details | |

|
#4
Wild Jasmine Ln
Katy, TX 77450
|
2,571 sq. feet
|
2 baths 4 beds |
show details | |

|
#5
Reign Wayman Ct
Katy, TX 77449
|
- sq. feet
|
2 baths 4 beds |
show details | |

|
#6
Sunflower Chase Dr
Katy, TX 77449
|
2,221 sq. feet
|
2 baths 3 beds |
show details | |

|
#7
Park Knoll Ln
Katy, TX 77450
|
2,460 sq. feet
|
2 baths 4 beds |
show details | |

|
#8
Settlers Village Dr
Katy, TX 77449
|
1,386 sq. feet
|
2 baths 3 beds |
show details | |

|
#9
Indian Ridge Ct
Katy, TX 77450
|
1,879 sq. feet
|
2 baths 4 beds |
show details | |

|
#10
Prairie Sky Lane
Katy, TX 77493
|
3,842 sq. feet
|
4 baths 5 beds |
show details |
| Photo | Address | Area | Beds / Baths | Price | Details |
|---|---|---|---|---|---|

|
#11
Apache Lake Dr
Katy, TX 77449
|
1,788 sq. feet
|
2 baths 3 beds |
show details | |

|
#12
Pax Hill Ctkaty, Tx 77493
Katy, TX 77493
|
- sq. feet
|
2 baths 3 beds |
show details | |

|
#13
Blue Water Bay Dr
Katy, TX 77494
|
2,553 sq. feet
|
2 baths 4 beds |
show details | |

|
#14
Wild Berry Dr
Katy, TX 77449
|
2,935 sq. feet
|
2 baths 4 beds |
show details | |

|
#15
Stoney Haven Dr
Katy, TX 77449
|
1,859 sq. feet
|
2 baths 4 beds |
show details | |

|
#16
Evening Moon Ln
Katy, TX 77449
|
3,934 sq. feet
|
3 baths 5 beds |
show details | |

|
#17
Bright Moon Ct
Katy, TX 77449
|
1,651 sq. feet
|
2 baths 3 beds |
show details | |

|
#18
Bassett Hall Ln
Katy, TX 77493
|
2,100 sq. feet
|
2 baths 3 beds |
show details | |

|
#19
Aubergine Springs Ln
Katy, TX 77449
|
2,050 sq. feet
|
2 baths 3 beds |
show details | |

|
#20
Karankawa Trail
Katy, TX 77493
|
2,743 sq. feet
|
3 baths 3 beds |
show details |
| Photo | Address | Area | Beds / Baths | Price | Details |
|---|---|---|---|---|---|

|
#21
Asterglen Ct
Katy, TX 77449
|
2,681 sq. feet
|
2 baths 4 beds |
show details | |

|
#22
Hall Croft Chase Ln
Katy, TX 77449
|
2,840 sq. feet
|
2 baths 4 beds |
show details | |

|
#23
Kestrel Vw
Katy, TX 77494
|
1,939 sq. feet
|
2 baths 3 beds |
show details | |

|
#24
Brinton Trails Ln
Katy, TX 77494
|
2,284 sq. feet
|
2 baths 4 beds |
show details | |

|
#25
Alexander Crossing Ln
Katy, TX 77494
|
3,621 sq. feet
|
3 baths 4 beds |
show details | |

|
#26
Leatherwood Dr
Katy, TX 77450
|
2,758 sq. feet
|
2 baths 4 beds |
show details | |

|
#27
Devon Green Dr
Katy, TX 77449
|
2,516 sq. feet
|
2 baths 4 beds |
show details | |

|
#28
Tynemeadow Ct
Katy, TX 77449
|
1,668 sq. feet
|
2 baths 3 beds |
show details | |

|
#29
Brighton Springs Ln
Katy, TX 77449
|
2,481 sq. feet
|
2 baths 4 beds |
show details | |

|
#30
Silver Cedar Trl
Katy, TX 77449
|
2,488 sq. feet
|
2 baths 4 beds |
show details |
| Photo | Address | Area | Beds / Baths | Price | Details |
|---|---|---|---|---|---|

|
#31
Granite Springs Ln
Katy, TX 77449
|
1,488 sq. feet
|
2 baths 3 beds |
show details | |

|
#32
Keystone Trl
Katy, TX 77450
|
2,259 sq. feet
|
2 baths 3 beds |
show details | |

|
#33
Williamschase Dr
Katy, TX 77449
|
1,770 sq. feet
|
2 baths 4 beds |
show details | |

|
#34
Arbor Creek Dr
Katy, TX 77449
|
1,881 sq. feet
|
2 baths 3 beds |
show details | |

|
#35
Avenue D
Katy, TX 77493
|
3,063 sq. feet
|
2 baths 3 beds |
show details | |

|
#36
Park York Dr
Katy, TX 77450
|
2,266 sq. feet
|
2 baths 4 beds |
show details | |

|
#37
Shillington Dr
Katy, TX 77450
|
3,068 sq. feet
|
2 baths 4 beds |
show details | |

|
#38
Park Green Dr
Katy, TX 77450
|
1,568 sq. feet
|
2 baths 3 beds |
show details | |

|
#39
Surrey Trail Ln
Katy, TX 77450
|
1,834 sq. feet
|
2 baths 3 beds |
show details | |

|
#40
Windmoor Dr
Katy, TX 77449
|
2,312 sq. feet
|
2 baths 4 beds |
show details |
| Photo | Address | Area | Beds / Baths | Price | Details |
|---|---|---|---|---|---|

|
#41
E Elm Cir
Katy, TX 77493
|
3,574 sq. feet
|
3 baths 4 beds |
show details | |

|
#42
Pepperrell Place St
Katy, TX 77493
|
2,573 sq. feet
|
2 baths 4 beds |
show details | |

|
#43
Crescent Cove Ct
Katy, TX 77494
|
4,094 sq. feet
|
3 baths 4 beds |
show details | |

|
#44
Hon Ct
Katy, TX 77449
|
1,408 sq. feet
|
2 baths 3 beds |
show details | |

|
#45
Ballina Meadows Ct
Katy, TX 77449
|
2,416 sq. feet
|
2 baths 4 beds |
show details | |

|
#46
Glenover Dr
Katy, TX 77450
|
2,184 sq. feet
|
2 baths 4 beds |
show details | |

|
#47
Dutton Point Dr
Katy, TX 77493
|
2,388 sq. feet
|
2 baths 3 beds |
show details | |

|
#48
Village Oak Dr
Katy, TX 77493
|
1,815 sq. feet
|
2 baths 3 beds |
show details | |

|
#49
Creekshore Dr
Katy, TX 77449
|
3,356 sq. feet
|
2 baths 4 beds |
show details | |

|
Check over 1 million property listings on Foreclosure.com!
|
browse all offers | |||

Latest news about housing in Katy, TX collected exclusively by city-data.com from local newspapers, TV, and radio stations


Median year apartment built: 1991
Household type by relationship:
Households: 23,090- Male householders: 3,968 (315 living alone), Female householders: 3,105 (629 living alone)
4,959 spouses (4,949 opposite-sex spouses), 369 unmarried partners, (351 opposite-sex unmarried partners), 9,006 children (8,551 natural, 229 adopted, 224 stepchildren), 196 grandchildren, 49 brothers or sisters, 124 parents, 25 foster children, 678 other relatives, 434 non-relatives
- In group quarters: 171
Size of family households: 1,899 2-persons, 1,279 3-persons, 1,496 4-persons, 793 5-persons, 245 6-persons, 216 7-or-more-persons.
Size of nonfamily households: 1,026 1-person, 228 2-persons, 44 3-persons, 14 4-persons, 12 5-persons.
5,437 married couples with children.
1,001 single-parent households (246 men, 755 women).
70.2% of residents of Katy speak English at home.
21.7% of residents speak Spanish at home (55% speak English very well, 19% speak English well, 7% speak English not well, 19% don't speak English at all).
1.8% of residents speak other Indo-European language at home (75% speak English very well, 21% speak English well, 4% speak English not well).
4.4% of residents speak Asian or Pacific Island language at home (67% speak English very well, 21% speak English well, 11% speak English not well).
2.0% of residents speak other language at home (100% speak English very well).
Foreign born population: 4,239 (18.4%)
(56.4% of them are naturalized citizens)
| Here: | 7.4 |
| State: | 6.3 |
| Here: | 5.2 |
| State: | 4.0 |

- Bedrooms in owner-occupied houses and condos in Katy, Texas
- 106no bedroom
- 281 bedroom
- 1322 bedrooms
- 2,3003 bedrooms
- 2,4084 bedrooms
- 8635+ bedrooms

- Bedrooms in renter-occupied apartments in Katy, Texas
- 49no bedroom
- 561 bedroom
- 7032 bedrooms
- 2773 bedrooms
- 4174 bedrooms
- 135+ bedrooms

- Cars and other vehicles available in Katy in owner-occupied houses/condos
- 122no vehicle
- 9831 vehicle
- 2,9772 vehicles
- 1,1943 vehicles
- 3924 vehicles
- 1695+ vehicles

- Cars and other vehicles available in Katy in renter-occupied apartments
- 125no vehicle
- 5691 vehicle
- 4822 vehicles
- 2063 vehicles
- 1194 vehicles
- 155+ vehicles

- Rooms in owner-occupied houses in Katy, Texas
- 1061 room
- 02 rooms
- 593 rooms
- 734 rooms
- 6365 rooms
- 1,0106 rooms
- 1,0747 rooms
- 1,1408 rooms
- 1,7409+ rooms

- Rooms in renter-occupied apartments in Katy, Texas
- 491 room
- 02 rooms
- 2043 rooms
- 2854 rooms
- 2885 rooms
- 3006 rooms
- 3187 rooms
- 258 rooms
- 469+ rooms


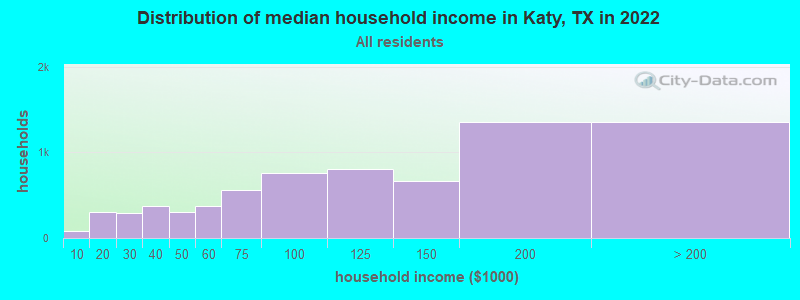
Katy, TX household income distribution

- 84Less than $10,000
- 304$10,000 to $19,999
- 289$20,000 to $29,999
- 372$30,000 to $39,999
- 302$40,000 to $49,999
- 370$50,000 to $59,999
- 562$60,000 to $74,999
- 759$75,000 to $99,999
- 806$100,000 to $124,999
- 671$125,000 to $149,999
- 1,356$150,000 to $199,999
- 1,353$200,000 or more
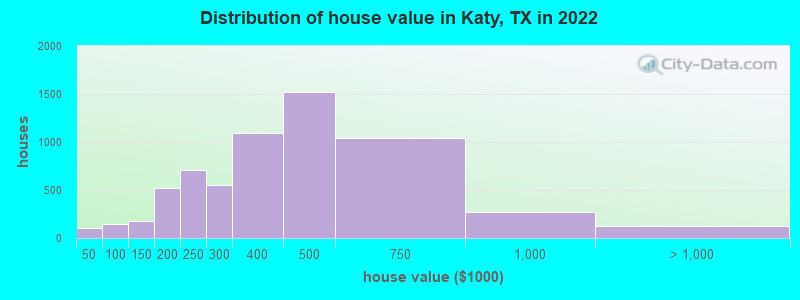
Home value of owner - occupied houses in 2022 in Katy, TX
-
- 15Less than $10,000
- 9$10,000 to $14,999
- 73$40,000 to $49,999
- 5$50,000 to $59,999
- 10$60,000 to $69,999
- 27$70,000 to $79,999
- 15$80,000 to $89,999
- 15$90,000 to $99,999
- 48$100,000 to $124,999
- 125$125,000 to $149,999
- 202$150,000 to $174,999
- 318$175,000 to $199,999
- 706$200,000 to $249,999
- 556$250,000 to $299,999
- 1,090$300,000 to $399,999
- 1,516$400,000 to $499,999
- 1,046$500,000 to $749,999
- 273$750,000 to $999,999
- 88$1,000,000 to $1,499,999
- 34$2,000,000 or more
Rent paid by renters in 2022 in Katy, TX
-
- 49$300 to $349
- 18$450 to $499
- 22$700 to $749
- 26$750 to $799
- 13$800 to $899
- 110$900 to $999
- 509$1,000 to $1,249
- 170$1,250 to $1,499
- 112$1,500 to $1,999
- 69$2,000 to $2,499
- 151$2,500 to $2,999
- 84$3,000 to $3,499
- 157No cash rent


Percentage of workers working in this county: 59.1%
Number of people working at home: 1,471 (14.0% of all workers)
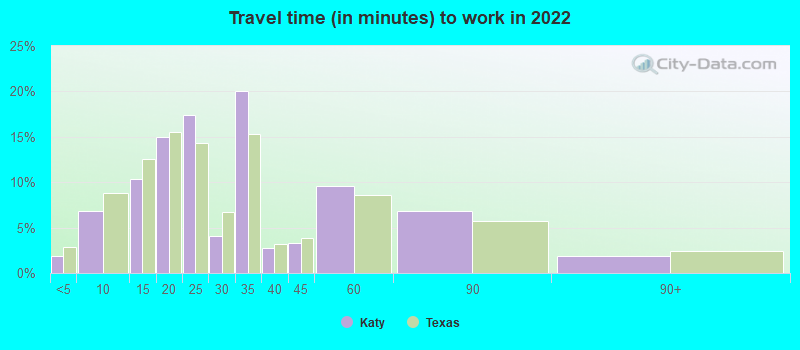
Travel time to work (commute)
- Less than 5 minutes: 455
- 5 to 9 minutes: 714
- 10 to 14 minutes: 1,158
- 15 to 19 minutes: 871
- 20 to 24 minutes: 868
- 25 to 29 minutes: 589
- 30 to 34 minutes: 1,186
- 35 to 39 minutes: 275
- 40 to 44 minutes: 387
- 45 to 59 minutes: 1,283
- 60 to 89 minutes: 1,099
- 90 or more minutes: 109
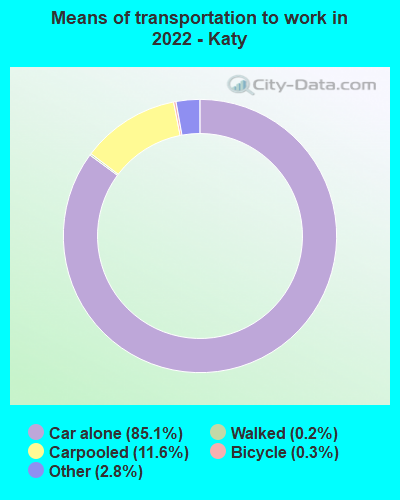
Means of transportation to work:
- Drove a car alone: 22,930 (77.9%)
- Carpooled: 3,660 (12.4%)
- Taxi: 1,030 (3.5%)
- Bicycle: 82 (0.3%)
- Walked: 57 (0.2%)
- Worked at home: 1,471 (5.0%)

- Unemployment by race in 2022
- Unemployment rate for White non-Hispanic residents
- 2.5%Males
- 5.3%Females
- Unemployment rate for Black residents
- 17.8%Males
- 7.2%Females
- Unemployment rate for Asian residents
- 15.3%Females
- Unemployment rate for other race residents
- 10.7%Males
- Unemployment rate for Hispanic or Latino residents
- 5.5%Males
- 6.8%Females

- Year of entry for the foreign-born population in Katy, Texas
- 1,7922010 or later
- 7852000 to 2009
- 1,0341990 to 1999
- 4091980 to 1989
- 2081970 to 1979
- 99Before 1970

First ancestries reported:
- German: 1,208 (10.4%)
- English: 994 (8.5%)
- American: 684 (5.9%)
- European: 360 (3.1%)
- Sudanese: 359 (3.1%)
- Scotch-Irish: 340 (2.9%)
- Italian: 312 (2.7%)
- Polish: 187 (1.6%)
- Liberian: 187 (1.6%)
- Irish: 169 (1.4%)
- Scottish: 81 (0.7%)
- Czech: 64 (0.5%)
- French: 50 (0.4%)
- Egyptian: 47 (0.4%)
- Norwegian: 47 (0.4%)
- British: 46 (0.4%)
- Arab: 43 (0.4%)
- Dutch: 40 (0.3%)
- Greek: 36 (0.3%)
- African: 35 (0.3%)
- Eastern European: 29 (0.2%)
- Canadian: 24 (0.2%)
- Czechoslovakian: 17 (0.1%)
- Hungarian: 17 (0.1%)
- Welsh: 17 (0.1%)
- Scandinavian: 11 (0.09%)
- Russian: 8 (0.07%)
- Portuguese: 5 (0.04%)
Most common places of birth for foreign-born residents (%):
| Katy: | 27.7% (1,175) |
| Texas: | 48.4% (2,411,723) |
| Katy: | 14.4% (610) |
| Texas: | 0.1% (5,241) |
| Katy: | 11.6% (491) |
| Texas: | 1.8% (87,382) |
| Katy: | 7.5% (318) |
| Texas: | 1.2% (61,555) |
| Katy: | 7.5% (317) |
| Texas: | 3.0% (147,182) |
| Katy: | 7.0% (296) |
| Texas: | 1.5% (72,413) |
| Katy: | 5.0% (214) |
| Texas: | 1.2% (62,159) |
| Katy: | 4.1% (174) |
| Texas: | 6.1% (306,347) |
| Katy: | 3.4% (144) |
| Texas: | 2.1% (103,148) |
| Katy: | 3.1% (132) |
| Texas: | 1.3% (62,978) |
| Katy: | 2.6% (110) |
| Texas: | 2.3% (115,558) |
| Katy: | 2.6% (109) |
| Texas: | 3.7% (184,770) |
| Katy: | 2.2% (95) |
| Texas: | 0.6% (27,844) |
Place of birth for U.S.-born residents:
- This state: 11,802
- Other state: 6,037
- Northeast: 585
- Midwest: 2,017
- South: 1,936
- West: 1,549
85.9% of Katy residents lived in the same house 1 years ago.
Out of people who lived in different houses, 27.1% lived in this county.
Out of people who lived in different counties, 57.9% lived in Texas.
| Katy: | 85.9% |
| State average: | 85.7% |
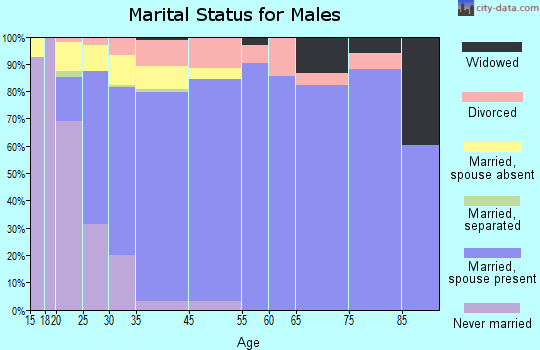
Education attainment for males 25 years and older:
- No schooling: 136
- Nursery to 4th grade: 3
- 5th and 6th grade: 198
- 7th and 8th grade: 107
- 9th grade: 39
- 10th grade: 13
- 11th grade: 52
- 12th grade, no diploma: 75
- High school graduate (or equivalency): 1,431
- Less than 1 year of college: 386
- Some college more than 1 year, no degree: 770
- Associate degree: 658
- Bachelor's degree: 1,567
- Master's degree: 1,238
- Professional school degree: 244
- Doctorate degree: 136

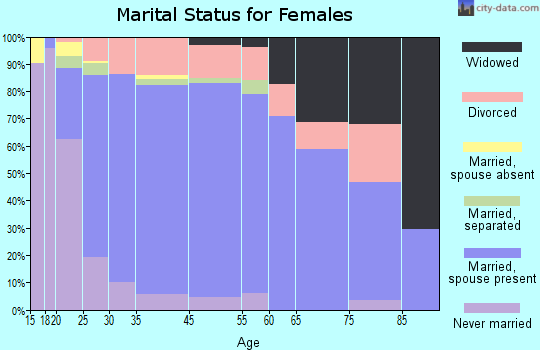
Education attainment for females 25 years and older:
- No schooling: 46
- Nursery to 4th grade: 104
- 5th and 6th grade: 54
- 7th and 8th grade: 21
- 9th grade: 31
- 10th grade: 21
- 11th grade: 78
- 12th grade, no diploma: 152
- High school graduate (or equivalency): 1,141
- Less than 1 year of college: 542
- Some college more than 1 year, no degree: 1,052
- Associate degree: 450
- Bachelor's degree: 2,495
- Master's degree: 1,174
- Professional school degree: 132
- Doctorate degree: 38

Housing units in structures:
- One, detached: 6,887
- One, attached: 166
- Two: 29
- 3 or 4: 256
- 5 to 9: 29
- 10 to 19: 59
- 20 to 49: 93
- 50 or more: 286
- Mobile homes: 145
- Boats, RVs, vans, etc.: 19
House/condo owner moved in on average 7 years ago
Renter moved in on average 4 years ago

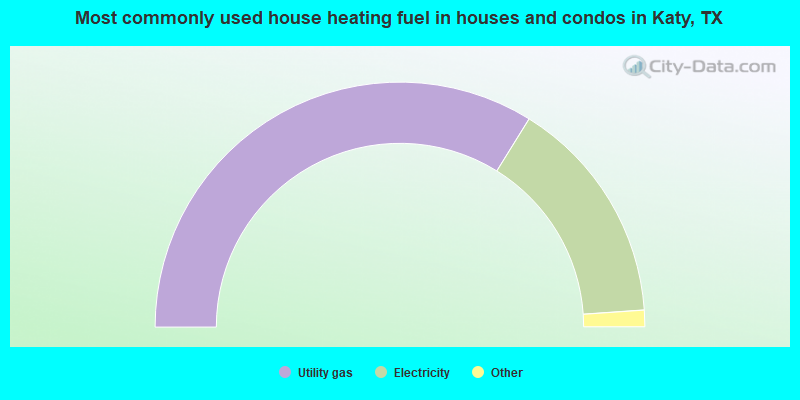
- 67.7%Utility gas
- 30.1%Electricity
- 1.5%Bottled, tank, or LP gas
- 0.7%Other fuel
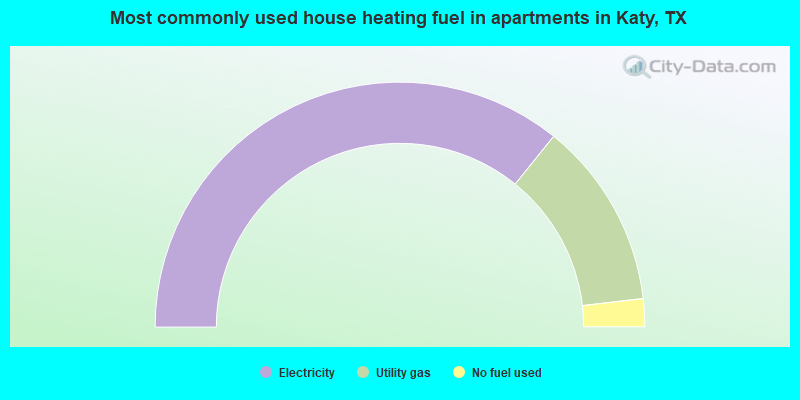
- 71.6%Electricity
- 24.7%Utility gas
- 3.7%No fuel used
Private vs. public school enrollment:
| Here: | 9.1% |
| Texas: | 8.8% |
| Here: | 6.5% |
| Texas: | 8.0% |
| Here: | 19.9% |
| Texas: | 16.2% |


