Herndon, VA (Virginia) Houses and Residents
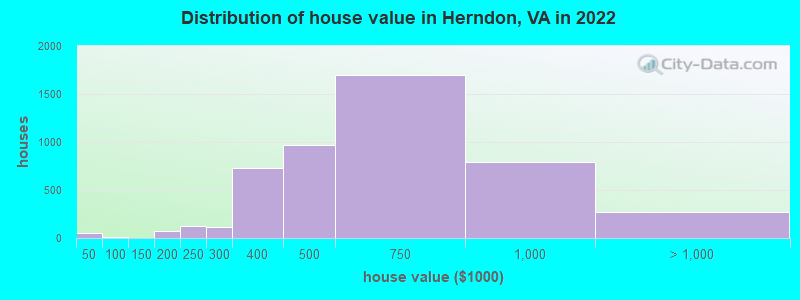
Estimated median house or condo value in 2022: $546,574 (it was $175,000 in 2000 )
Herndon:
$546,574Virginia:
$365,700
Lower value quartile - upper value quartile: $432,461 - $736,871Mean price in 2022: Detached houses: $806,826 Here:
$806,826State:
$472,865
Townhouses or other attached units: $512,890 Here:
$512,890State:
$457,437
In 5-or-more-unit structures: $322,570 Here:
$322,570State:
$382,551
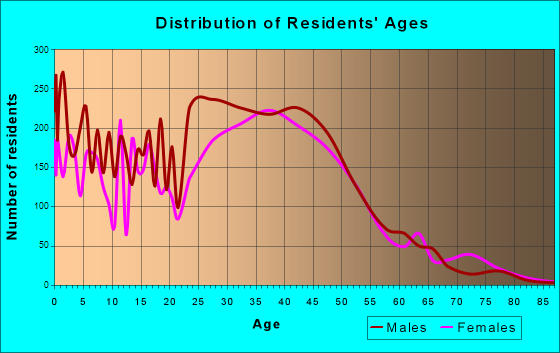
Total population: 24,554 (Urban population: 21,662, Rural population: 0)
Houses: 8,251 (7,949 occupied: 5,163 owner occupied, 2,830 renter occupied )
% of renters here:
35%State:
33%
Housing density: 1,955 houses/condos per square mile
Median price asked for vacant for-sale houses and condos in 2022 in this county: $1,038,941.
Median contract rent in 2022: $1,828 (lower quartile is $1,560, upper quartile is over $2,000)
Median rent asked for vacant for-rent units in 2022: $2,335
Median gross rent in Herndon, VA in 2022: $1,981
Housing units in Herndon with a mortgage: 3,917 (443 second mortgage, 87 home equity loan, 272 both second mortgage and home equity loan )Houses without a mortgage: 34
Median household income for houses/condos with a mortgage: $193,200
Median household income for apartments without a mortgage: $109,441
Median monthly housing costs: $2,131
Data:
Median house or condo value ($)
Median house or condo value ($ change since 2000)
Median house or condo value ($) - White
Median house or condo value ($) - Black or African American
Median house or condo value ($) - Asian
Median house or condo value ($) - Hispanic or Latino
Median house or condo value ($) - American Indian and Alaska Native
Median house or condo value ($) - Multirace
Median house or condo value ($) - Other Race
Median price asked for mobile homes ($)
Household density (households per square mile)
Mean house or condo value by units in structure - 1, detached ($)
Mean house or condo value by units in structure - 1, attached ($)
Mean house or condo value by units in structure - 2 ($)
Mean house or condo value by units in structure by units in structure - 3 or 4 ($)
Mean house or condo value by units in structure - 5 or more ($)
Mean house or condo value by units in structure - Boat, RV, van, etc. ($)
Mean house or condo value by units in structure - Mobile home ($)
Median contract rent ($)
Median contract rent - Lower quartile ($)
Median contract rent - Upper quartile ($)
Median gross rent ($)
Urban houses (%)
Rural houses (%)
Houses occupied (%)
Houses occupied (% change since 2000)
Houses owner occupied (%)
Houses owner occupied (% change since 2000)
Houses renter occupied (%)
Houses renter occupied (% change since 2000)
Vacant housing units - For rent (%)
Vacant housing units - For rent (% change since 2000)
Vacant housing units - For sale only (%)
Vacant housing units - For sale only (% change since 2000)
Vacant housing units - Rented or sold, not occupied (%)
Vacant housing units - Rented or sold, not occupied (% change since 2000)
Vacant housing units - For seasonal, recreational, or occasional use (%)
Vacant housing units - For seasonal, recreational, or occasional use (% change since 2000)
Vacant housing units - For migrant workers (%)
Vacant housing units - For migrant workers (% change since 2000)
Vacant housing units - Other vacant (%)
Vacant housing units - Other vacant (% change since 2000)
Median monthly housing costs ($)
Median household income for houses/condos with a mortgage ($)
Median household income for houses/condos without a mortgage ($)
Median household income ($)
Median household income ($) - White
Median household income ($) - Black or African American
Median household income ($) - Asian
Median household income ($) - Hispanic or Latino
Median household income ($) - American Indian and Alaska Native
Median household income ($) - Multirace
Median household income ($) - Other Race
Mortgage status - with mortgage (%)
Mortgage status - with second mortgage (%)
Mortgage status - with home equity loan (%)
Mortgage status - with both second mortgage and home equity loan (%)
Mortgage status - without a mortgage (%)
Median year house/condo built
Median year apartment built
Household type by relationship - Male householder living alone (%)
Household type by relationship - Male householder not living alone (%)
Household type by relationship - Female householder living alone (%)
Household type by relationship - Female householder not living alone (%)
Household type by relationship - Opposite-Sex spouse (%)
Household type by relationship - Same-Sex spouse (%)
Household type by relationship - Opposite-Sex unmarried partner (%)
Household type by relationship - Same-Sex unmarried partner (%)
Household type by relationship - In group quarters (%)
Size of family households - 2-person household (%)
Size of family households - 3-person household (%)
Size of family households - 4-person household (%)
Size of family households - 5-person household (%)
Size of family households - 6-person household (%)
Size of family households - 7-or-more-person household (%)
Size of nonfamily households - 1-person household (%)
Size of nonfamily households - 2-person household (%)
Size of nonfamily households - 3-person household (%)
Size of nonfamily households - 4-person household (%)
Size of nonfamily households - 5-person household (%)
Size of nonfamily households - 6-person household (%)
Size of nonfamily households - 7-or-moreperson household (%)
Year house built - Built 2010 or later (%)
Year house built - Built 2000 to 2009 (%)
Year house built - Built 1990 to 1999 (%)
Year house built - Built 1980 to 1989 (%)
Year house built - Built 1970 to 1979 (%)
Year house built - Built 1960 to 1969 (%)
Year house built - Built 1950 to 1959 (%)
Year house built - Built 1940 to 1949 (%)
Year house built - Built 1939 or earlier (%)
Median number of rooms in houses and condos
Median number of rooms in apartments
Median number of bedrooms in owner occupied houses
Mean number of bedrooms in owner occupied houses
Median number of bedrooms in renter occupied houses
Mean number of bedrooms in renter occupied houses
Median number of vehichles in owner occupied houses
Mean number of vehichles in owner occupied houses
Median number of vehichles in renter occupied houses
Mean number of vehichles in renter occupied houses
Rooms in owner-occupied houses - 1 room (%)
Rooms in owner-occupied houses - 2 rooms (%)
Rooms in owner-occupied houses - 3 rooms (%)
Rooms in owner-occupied houses - 4 rooms (%)
Rooms in owner-occupied houses - 5 rooms (%)
Rooms in owner-occupied houses - 6 rooms (%)
Rooms in owner-occupied houses - 7 rooms (%)
Rooms in owner-occupied houses - 8 rooms (%)
Rooms in owner-occupied houses - 9+ rooms (%)
Rooms in renter-occupied houses - 1 room (%)
Rooms in renter-occupied houses - 2 rooms (%)
Rooms in renter-occupied houses - 3 rooms (%)
Rooms in renter-occupied houses - 4 rooms (%)
Rooms in renter-occupied houses - 5 rooms (%)
Rooms in renter-occupied houses - 6 rooms (%)
Rooms in renter-occupied houses - 7 rooms (%)
Rooms in renter-occupied houses - 8 rooms (%)
Rooms in renter-occupied houses - 9+ rooms (%)
Bedrooms in owner-occupied houses - no bedrooms (%)
Bedrooms in owner-occupied houses - 1 bedroom (%)
Bedrooms in owner-occupied houses - 2 bedrooms (%)
Bedrooms in owner-occupied houses - 3 bedrooms (%)
Bedrooms in owner-occupied houses - 4 bedrooms (%)
Bedrooms in owner-occupied houses - 5+ bedrooms (%)
Bedrooms in renter-occupied houses - no bedrooms (%)
Bedrooms in renter-occupied houses - 1 bedroom (%)
Bedrooms in renter-occupied houses - 2 bedrooms (%)
Bedrooms in renter-occupied houses - 3 bedrooms (%)
Bedrooms in renter-occupied houses - 4 bedrooms (%)
Bedrooms in renter-occupied houses - 5+ bedrooms (%)
Vehicles available in owner-occupied houses - no vehicle available (%)
Vehicles available in owner-occupied houses - 1 vehicle available(%)
Vehicles available in owner-occupied houses - 2 Vehicles available (%)
Vehicles available in owner-occupied houses - 3 Vehicles available (%)
Vehicles available in owner-occupied houses - 4 Vehicles available (%)
Vehicles available in owner-occupied houses - 5+ Vehicles available (%)
Vehicles available in renter-occupied houses - no vehicle available (%)
Vehicles available in renter-occupied houses - 1 vehicle available (%)
Vehicles available in renter-occupied houses - 2 Vehicles available (%)
Vehicles available in renter-occupied houses - 3 Vehicles available (%)
Vehicles available in renter-occupied houses - 4 Vehicles available (%)
Vehicles available in renter-occupied houses - 5+ Vehicles available (%)
Housing units in structures - 1, detached (%)
Housing units in structures - 1, attached (%)
Housing units in structures - 2 (%)
Housing units in structures - 3 or 4 (%)
Housing units in structures - 5 to 9 (%)
Housing units in structures - 10 to 19 (%)
Housing units in structures - 20 to 49 (%)
Housing units in structures - 50 or more (%)
Housing units in structures - Mobile home (%)
Housing units in structures - Boat, RV, van, etc. (%)
Housing units in structures - Owners - 1, detached (%)
Housing units in structures - Owners - 1, attached (%)
Housing units in structures - Owners - 2 (%)
Housing units in structures - Owners - 3 or 4 (%)
Housing units in structures - Owners - 5 to 9 (%)
Housing units in structures - Owners - 10 to 19 (%)
Housing units in structures - Owners - 20 to 49 (%)
Housing units in structures - Owners - 50 or more (%)
Housing units in structures - Owners - Mobile home (%)
Housing units in structures - Owners - Boat, RV, van, etc. (%)
Housing units in structures - Renters - 1, detached (%)
Housing units in structures - Renters - 1, attached (%)
Housing units in structures - Renters - 2 (%)
Housing units in structures - Renters - 3 or 4 (%)
Housing units in structures - Renters - 5 to 9 (%)
Housing units in structures - Renters - 10 to 19 (%)
Housing units in structures - Renters - 20 to 49 (%)
Housing units in structures - Renters - 50 or more (%)
Housing units in structures - Renters - Mobile home (%)
Housing units in structures - Renters - Boat, RV, van, etc. (%)
House/condo owner moved in on average (years ago)
Renter moved in on average (years ago)
Year householder moved into unit - Moved in 1999 to March 2000 (%)
Year householder moved into unit - Moved in 1999 to March 2000 (%) - White
Year householder moved into unit - Moved in 1999 to March 2000 (%) - Black or African American
Year householder moved into unit - Moved in 1999 to March 2000 (%) - Asian
Year householder moved into unit - Moved in 1999 to March 2000 (%) - Hispanic or Latino
Year householder moved into unit - Moved in 1999 to March 2000 (%) - American Indian and Alaska Native
Year householder moved into unit - Moved in 1999 to March 2000 (%) - Multirace
Year householder moved into unit - Moved in 1999 to March 2000 (%) - Other Race
Year householder moved into unit - Moved in 1995 to 1998 (%)
Year householder moved into unit - Moved in 1995 to 1998 (%) - White
Year householder moved into unit - Moved in 1995 to 1998 (%) - Black or African American
Year householder moved into unit - Moved in 1995 to 1998 (%) - Asian
Year householder moved into unit - Moved in 1995 to 1998 (%) - Hispanic or Latino
Year householder moved into unit - Moved in 1995 to 1998 (%) - American Indian and Alaska Native
Year householder moved into unit - Moved in 1995 to 1998 (%) - Multirace
Year householder moved into unit - Moved in 1995 to 1998 (%) - Other Race
Year householder moved into unit - Moved in 1990 to 1994 (%)
Year householder moved into unit - Moved in 1990 to 1994 (%) - White
Year householder moved into unit - Moved in 1990 to 1994 (%) - Black or African American
Year householder moved into unit - Moved in 1990 to 1994 (%) - Asian
Year householder moved into unit - Moved in 1990 to 1994 (%) - Hispanic or Latino
Year householder moved into unit - Moved in 1990 to 1994 (%) - American Indian and Alaska Native
Year householder moved into unit - Moved in 1990 to 1994 (%) - Multirace
Year householder moved into unit - Moved in 1990 to 1994 (%) - Other Race
Year householder moved into unit - Moved in 1980 to 1989 (%)
Year householder moved into unit - Moved in 1980 to 1989 (%) - White
Year householder moved into unit - Moved in 1980 to 1989 (%) - Black or African American
Year householder moved into unit - Moved in 1980 to 1989 (%) - Asian
Year householder moved into unit - Moved in 1980 to 1989 (%) - Hispanic or Latino
Year householder moved into unit - Moved in 1980 to 1989 (%) - American Indian and Alaska Native
Year householder moved into unit - Moved in 1980 to 1989 (%) - Multirace
Year householder moved into unit - Moved in 1980 to 1989 (%) - Other Race
Year householder moved into unit - Moved in 1970 to 1979 (%)
Year householder moved into unit - Moved in 1970 to 1979 (%) - White
Year householder moved into unit - Moved in 1970 to 1979 (%) - Black or African American
Year householder moved into unit - Moved in 1970 to 1979 (%) - Asian
Year householder moved into unit - Moved in 1970 to 1979 (%) - Hispanic or Latino
Year householder moved into unit - Moved in 1970 to 1979 (%) - American Indian and Alaska Native
Year householder moved into unit - Moved in 1970 to 1979 (%) - Multirace
Year householder moved into unit - Moved in 1970 to 1979 (%) - Other Race
Year householder moved into unit - Moved in 1969 or earlier (%)
Year householder moved into unit - Moved in 1969 or earlier (%) - White
Year householder moved into unit - Moved in 1969 or earlier (%) - Black or African American
Year householder moved into unit - Moved in 1969 or earlier (%) - Asian
Year householder moved into unit - Moved in 1969 or earlier (%) - Hispanic or Latino
Year householder moved into unit - Moved in 1969 or earlier (%) - American Indian and Alaska Native
Year householder moved into unit - Moved in 1969 or earlier (%) - Multirace
Year householder moved into unit - Moved in 1969 or earlier (%) - Other Race
Housing units lacking complete plumbing facilities (%)
Housing units lacking complete kitchen facilities (%)
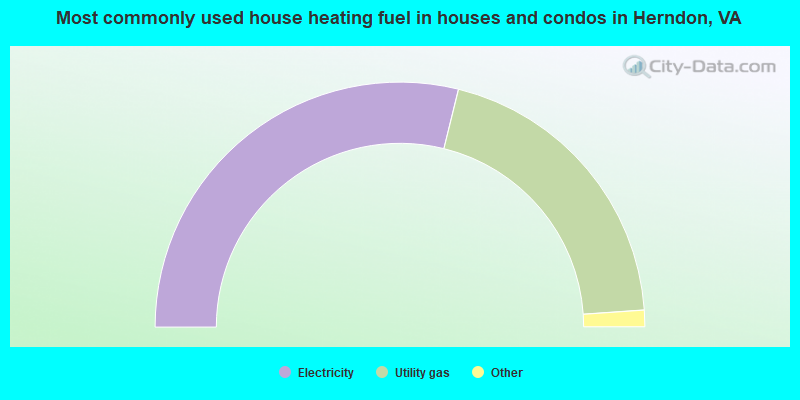
House heating fuel used in houses and condos - Utility gas (%)
House heating fuel used in houses and condos - Bottled, tank, or LP gas (%)
House heating fuel used in houses and condos - Electricity (%)
House heating fuel used in houses and condos - Fuel oil, kerosene, etc. (%)
House heating fuel used in houses and condos - Coal or coke (%)
House heating fuel used in houses and condos - Wood (%)
House heating fuel used in houses and condos - Solar energy (%)
House heating fuel used in houses and condos - Other fuel (%)
House heating fuel used in houses and condos - No fuel used (%)
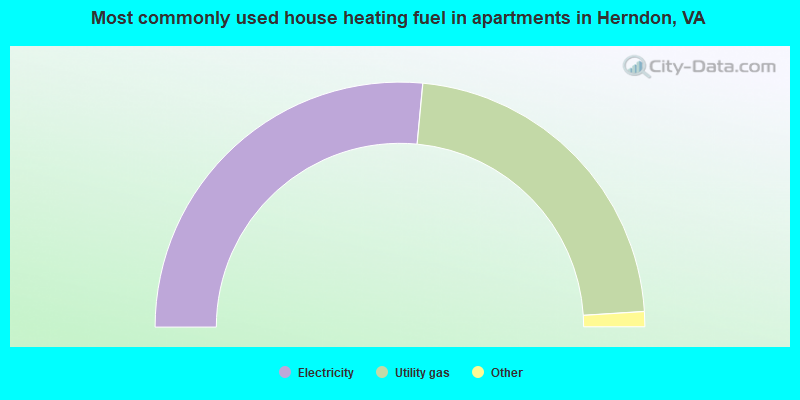
House heating fuel used in apartments - Utility gas (%)
House heating fuel used in apartments - Bottled, tank, or LP gas (%)
House heating fuel used in apartments - Electricity (%)
House heating fuel used in apartments - Fuel oil, kerosene, etc. (%)
House heating fuel used in apartments - Coal or coke (%)
House heating fuel used in apartments - Wood (%)
House heating fuel used in apartments - Solar energy (%)
House heating fuel used in apartments - Other fuel (%)
House heating fuel used in apartments - No fuel used (%)
Latest news about housing in Herndon, VA collected exclusively by city-data.com from local newspapers, TV, and radio stations
Median year house/condo built: 1981Median year apartment built: 1985Household type by relationship:
Households: 24,306
Male householders: 5,172 (910 living alone ), Female householders: 2,676 (602 living alone )4,435 spouses (4,408 opposite-sex spouses ), 513 unmarried partners , (503 opposite-sex unmarried partners ), 7,081 children (6,786 natural , 88 adopted , 206 stepchildren ), 354 grandchildren , 593 brothers or sisters , 674 parents , 0 foster children , 1,129 other relatives , 1,660 non-relatives In group quarters: 13
Size of family households: 2,016 2-persons , 1,114 3-persons , 1,212 4-persons , 699 5-persons , 346 6-persons , 303 7-or-more-persons .
Size of nonfamily households: 1,560 1-person , 586 2-persons , 129 3-persons , 28 4-persons .
3,808 married couples with children. single-parent households (313 men , 788 women ).
46.9% of residents of Herndon speak English at home. of residents speak Spanish at home (38% speak English very well , 26% speak English well , 25% speak English not well , 12% don't speak English at all ).of residents speak other Indo-European language at home (60% speak English very well , 34% speak English well , 5% speak English not well , 1% don't speak English at all ).of residents speak Asian or Pacific Island language at home (62% speak English very well , 20% speak English well , 16% speak English not well , 3% don't speak English at all ).of residents speak other language at home (79% speak English very well , 14% speak English well , 5% speak English not well , 2% don't speak English at all ).
Foreign born population: 10,188 (41.9%)of them are naturalized citizens )
Median number of rooms in houses and condos:
Median number of rooms in apartments
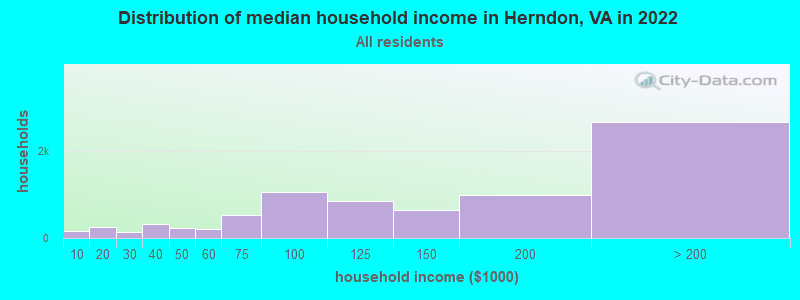
Herndon, VA household income distribution 153 Less than $10,000245 $10,000 to $19,999142 $20,000 to $29,999319 $30,000 to $39,999229 $40,000 to $49,999198 $50,000 to $59,999533 $60,000 to $74,9991,059 $75,000 to $99,999855 $100,000 to $124,999643 $125,000 to $149,999993 $150,000 to $199,9992,654 $200,000 or more
Home value of owner - occupied houses in 2022 in Herndon, VA 56 Less than $10,00012 $50,000 to $59,99911 $150,000 to $174,99966 $175,000 to $199,999127 $200,000 to $249,999109 $250,000 to $299,999725 $300,000 to $399,999965 $400,000 to $499,9991,692 $500,000 to $749,999793 $750,000 to $999,999232 $1,000,000 to $1,499,99942 $2,000,000 or moreRent paid by renters in 2022 in Herndon, VA 15 $200 to $24911 $350 to $3993 $400 to $44915 $500 to $54916 $550 to $5999 $800 to $89941 $900 to $999192 $1,000 to $1,249232 $1,250 to $1,4991,304 $1,500 to $1,999578 $2,000 to $2,499306 $2,500 to $2,999116 $3,000 to $3,49956 No cash rent
Percentage of workers working in this county: 71.9%Number of people working at home: 3,296 (22.5% of all workers )
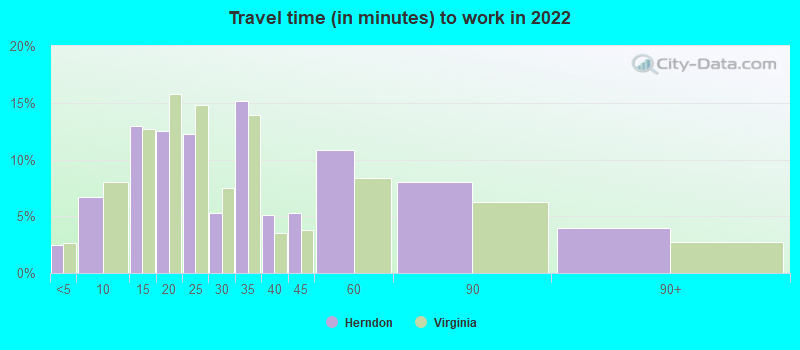
Travel time to work (commute)
Less than 5 minutes: 4625 to 9 minutes: 72010 to 14 minutes: 1,60415 to 19 minutes: 2,35320 to 24 minutes: 1,66825 to 29 minutes: 79430 to 34 minutes: 1,72335 to 39 minutes: 38640 to 44 minutes: 30745 to 59 minutes: 63760 to 89 minutes: 78790 or more minutes: 53
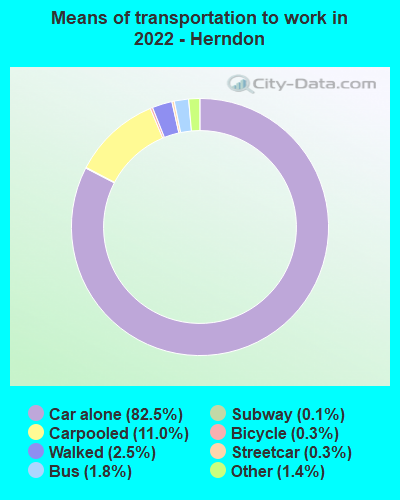
Means of transportation to work:
Drove a car alone: 14,872 (67.5%)Carpooled: 2,044 (9.3%)Bus : 225 (1.0%)Subway or elevated rail : 51 (0.2%)Long-distance train or commuter rail : 14 (0.1%)Taxi: 335 (1.5%)Bicycle: 33 (0.1%)Walked: 514 (2.3%)Worked at home: 3,296 (15.0%)
Unemployment by race in 2022
Unemployment rate for White non-Hispanic residents 1.4% Males1.8% FemalesUnemployment rate for Black residents 0.3% Males2.6% FemalesUnemployment rate for Asian residents 0.5% Males1.6% FemalesUnemployment rate for other race residents 2.3% Males4.0% FemalesUnemployment rate for two or more race residents 2.3% Males6.5% FemalesUnemployment rate for Hispanic or Latino residents 1.7% Males4.6% Females
Year of entry for the foreign-born population in Herndon, Virginia
4,459 2010 or later 2,444 2000 to 2009 1,614 1990 to 1999 2,247 1980 to 1989 563 1970 to 1979 249 Before 1970
First ancestries reported:
Irish: 604 (3.9%)
American: 467 (3.1%)
German: 458 (3.0%)
English: 401 (2.6%)
Italian: 239 (1.6%)
European: 230 (1.5%)
Armenian: 161 (1.1%)
Ethiopian: 157 (1.0%)
Polish: 126 (0.8%)
Russian: 110 (0.7%)
French Canadian: 110 (0.7%)
Romanian: 93 (0.6%)
Swedish: 91 (0.6%)
Sudanese: 91 (0.6%)
Afghan: 83 (0.5%)
African: 65 (0.4%)
Nigerian: 62 (0.4%)
Eastern European: 57 (0.4%)
Scotch-Irish: 53 (0.3%)
British: 51 (0.3%)
Egyptian: 42 (0.3%)
Yugoslavian: 42 (0.3%)
Dutch: 41 (0.3%)
Jamaican: 41 (0.3%)
Syrian: 38 (0.2%)
Danish: 38 (0.2%)
Iranian: 33 (0.2%)
British West Indian: 33 (0.2%)
Trinidadian and Tobagonian: 25 (0.2%)
Ukrainian: 25 (0.2%)
Lebanese: 22 (0.1%)
Iraqi: 21 (0.1%)
Northern European: 19 (0.1%)
Greek: 19 (0.1%)
Hungarian: 14 (0.09%)
Arab: 14 (0.09%)
Barbadian: 14 (0.09%)
French: 12 (0.08%)
Belgian: 9 (0.06%)
Lithuanian: 9 (0.06%)
Slovak: 9 (0.06%)
Slovene: 9 (0.06%)
Israeli: 8 (0.05%)
Norwegian: 7 (0.05%)
Scottish: 7 (0.05%)
Turkish: 7 (0.05%)
Welsh: 6 (0.04%)
Czech: 5 (0.03%)
Brazilian: 4 (0.03%)
Bulgarian: 3 (0.02%)
Most common places of birth for foreign-born residents (%): El Salvador Herndon:
23.9% (2,430)Virginia:
9.9% (107,534)
Honduras Herndon:
10.3% (1,053)Virginia:
3.0% (32,892)
India Herndon:
8.5% (866)Virginia:
9.0% (97,830)
Nepal Herndon:
5.7% (577)Virginia:
0.9% (9,695)
Peru Herndon:
5.5% (564)Virginia:
2.4% (26,366)
Ethiopia Herndon:
3.2% (322)Virginia:
2.9% (32,082)
Vietnam Herndon:
2.9% (298)Virginia:
4.2% (45,750)
China, excluding Hong Kong and Taiwan Herndon:
2.8% (288)Virginia:
3.9% (42,989)
Guatemala Herndon:
2.6% (269)Virginia:
3.3% (35,938)
Mexico Herndon:
2.4% (247)Virginia:
5.3% (57,498)
Philippines Herndon:
2.2% (222)Virginia:
4.8% (52,629)
Bolivia Herndon:
2.0% (199)Virginia:
2.4% (25,722)
Malaysia Herndon:
2.0% (199)Virginia:
0.2% (1,776)
Pakistan Herndon:
1.7% (171)Virginia:
2.3% (24,582)
Place of birth for U.S.-born residents:
This state: 7,047Other state: 6,488Northeast: 2,094Midwest: 1,461South: 2,038West: 890 83.1% of Herndon residents lived in the same house 1 years ago.
Out of people who lived in different houses, 39.0% lived in this county.
Out of people who lived in different counties, 50.2% lived in Virginia.
Herndon:
83.1%State average:
86.6%
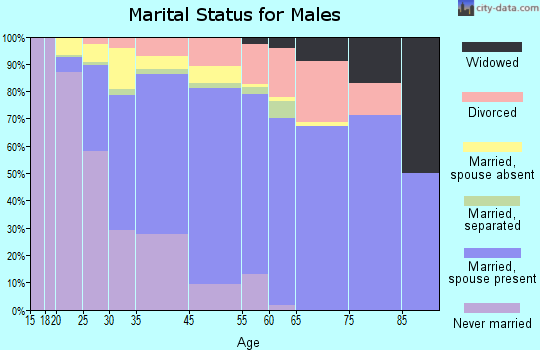
Education attainment for males 25 years and older:
No schooling: 375Nursery to 4th grade: 2455th and 6th grade: 2787th and 8th grade: 679th grade: 14210th grade: 8011th grade: 13912th grade, no diploma: 23High school graduate (or equivalency): 1,357Less than 1 year of college: 219Some college more than 1 year, no degree: 766Associate degree: 421Bachelor's degree: 2,750Master's degree: 1,600Professional school degree: 160Doctorate degree: 162
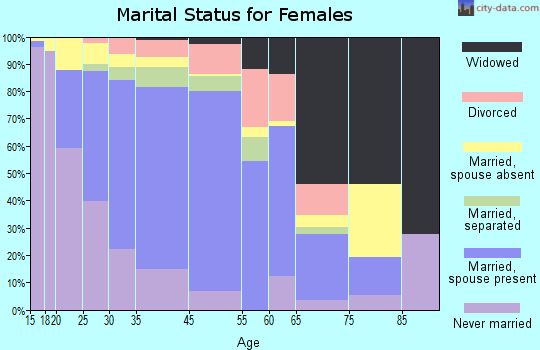
Education attainment for females 25 years and older:
No schooling: 185Nursery to 4th grade: 355th and 6th grade: 3937th and 8th grade: 279th grade: 18710th grade: 3211th grade: 8312th grade, no diploma: 106High school graduate (or equivalency): 1,099Less than 1 year of college: 307Some college more than 1 year, no degree: 600Associate degree: 391Bachelor's degree: 2,440Master's degree: 1,464Professional school degree: 82Doctorate degree: 43
Housing units in structures:
One, detached: 3,438One, attached: 2,307Two: 833 or 4: 1105 to 9: 44610 to 19: 98420 to 49: 56850 or more: 311Housing units lacking complete plumbing facilities in 2022: 1.1%Housing units lacking complete kitchen facilities in 2022: 0.5%House/condo owner moved in on average 9 years ago
Renter moved in on average 4 years ago
Private vs. public school enrollment:
Students in private schools in grades 1 to 8 (elementary and middle school): 346 Students in private schools in grades 9 to 12 (high school): 30 Students in private undergraduate colleges: 319