Hempstead, NY (New York) Houses and Residents
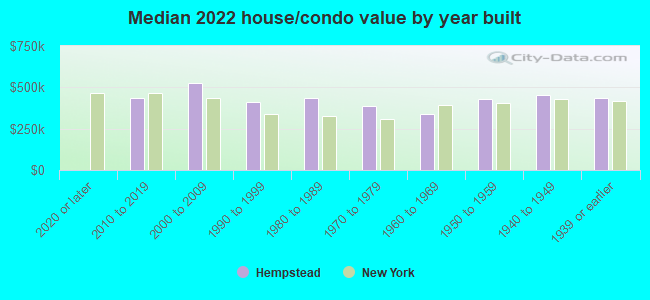
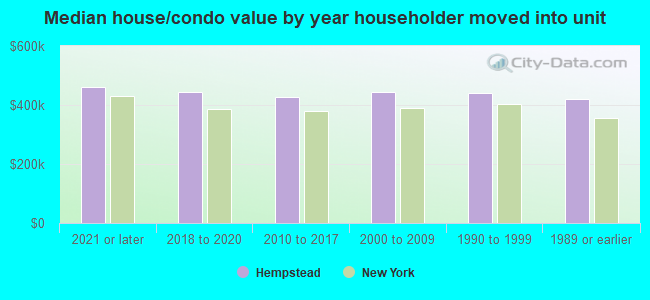
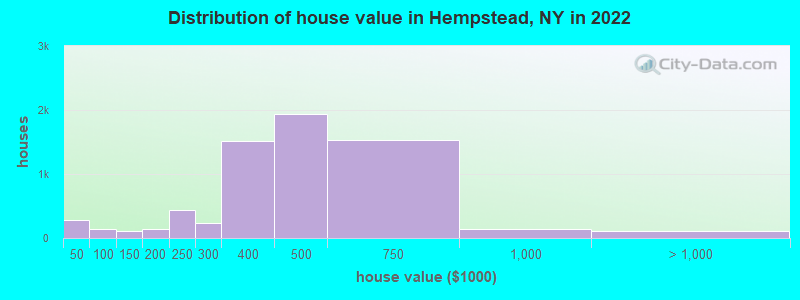
Estimated median house or condo value in 2022: $435,126 (it was $165,500 in 2000 )
Hempstead:
$435,126New York:
$400,400
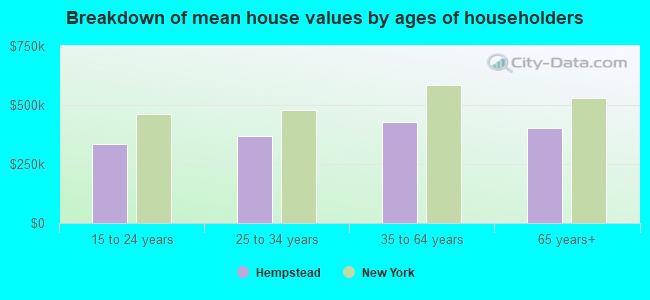
Lower value quartile - upper value quartile: $346,788 - $508,578Mean price in 2022: Detached houses: $461,344 Here:
$461,344State:
$476,719
Townhouses or other attached units: $826,684 Here:
$826,684State:
$699,270
In 2-unit structures: $509,325 Here:
$509,325State:
$713,077
In 3-to-4-unit structures: $591,538 Here:
$591,538State:
$764,568
In 5-or-more-unit structures: $298,528 Here:
$298,528State:
$912,009
Total population: 55,527 (All urban)
Houses: 18,534 (17,110 occupied: 7,550 owner occupied, 9,530 renter occupied )
% of renters here:
56%State:
46%
Housing density: 5,036 houses/condos per square mile
Median price asked for vacant for-sale houses and condos in 2022: $483,329.
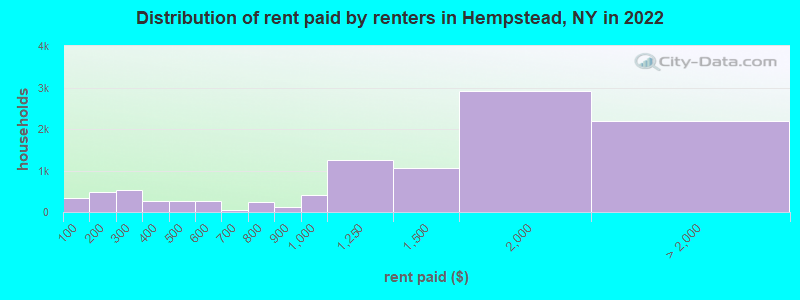
Median contract rent in 2022: $1,475 (lower quartile is $882, upper quartile is $1,973)
Median rent asked for vacant for-rent units in 2022: $1,873
Median gross rent in Hempstead, NY in 2022: $1,575
Housing units in Hempstead with a mortgage: 5,706 (426 second mortgage, 10 home equity loan, 234 both second mortgage and home equity loan )Houses without a mortgage: 115
Median household income for houses/condos with a mortgage: $130,208
Median household income for apartments without a mortgage: $94,427
Median monthly housing costs: $1,897
Data:
Median house or condo value ($)
Median house or condo value ($ change since 2000)
Median house or condo value ($) - White
Median house or condo value ($) - Black or African American
Median house or condo value ($) - Asian
Median house or condo value ($) - Hispanic or Latino
Median house or condo value ($) - American Indian and Alaska Native
Median house or condo value ($) - Multirace
Median house or condo value ($) - Other Race
Median price asked for mobile homes ($)
Household density (households per square mile)
Mean house or condo value by units in structure - 1, detached ($)
Mean house or condo value by units in structure - 1, attached ($)
Mean house or condo value by units in structure - 2 ($)
Mean house or condo value by units in structure by units in structure - 3 or 4 ($)
Mean house or condo value by units in structure - 5 or more ($)
Mean house or condo value by units in structure - Boat, RV, van, etc. ($)
Mean house or condo value by units in structure - Mobile home ($)
Median contract rent ($)
Median contract rent - Lower quartile ($)
Median contract rent - Upper quartile ($)
Median gross rent ($)
Urban houses (%)
Rural houses (%)
Houses occupied (%)
Houses occupied (% change since 2000)
Houses owner occupied (%)
Houses owner occupied (% change since 2000)
Houses renter occupied (%)
Houses renter occupied (% change since 2000)
Vacant housing units - For rent (%)
Vacant housing units - For rent (% change since 2000)
Vacant housing units - For sale only (%)
Vacant housing units - For sale only (% change since 2000)
Vacant housing units - Rented or sold, not occupied (%)
Vacant housing units - Rented or sold, not occupied (% change since 2000)
Vacant housing units - For seasonal, recreational, or occasional use (%)
Vacant housing units - For seasonal, recreational, or occasional use (% change since 2000)
Vacant housing units - For migrant workers (%)
Vacant housing units - For migrant workers (% change since 2000)
Vacant housing units - Other vacant (%)
Vacant housing units - Other vacant (% change since 2000)
Median monthly housing costs ($)
Median household income for houses/condos with a mortgage ($)
Median household income for houses/condos without a mortgage ($)
Median household income ($)
Median household income ($) - White
Median household income ($) - Black or African American
Median household income ($) - Asian
Median household income ($) - Hispanic or Latino
Median household income ($) - American Indian and Alaska Native
Median household income ($) - Multirace
Median household income ($) - Other Race
Mortgage status - with mortgage (%)
Mortgage status - with second mortgage (%)
Mortgage status - with home equity loan (%)
Mortgage status - with both second mortgage and home equity loan (%)
Mortgage status - without a mortgage (%)
Median year house/condo built
Median year apartment built
Household type by relationship - Male householder living alone (%)
Household type by relationship - Male householder not living alone (%)
Household type by relationship - Female householder living alone (%)
Household type by relationship - Female householder not living alone (%)
Household type by relationship - Opposite-Sex spouse (%)
Household type by relationship - Same-Sex spouse (%)
Household type by relationship - Opposite-Sex unmarried partner (%)
Household type by relationship - Same-Sex unmarried partner (%)
Household type by relationship - In group quarters (%)
Size of family households - 2-person household (%)
Size of family households - 3-person household (%)
Size of family households - 4-person household (%)
Size of family households - 5-person household (%)
Size of family households - 6-person household (%)
Size of family households - 7-or-more-person household (%)
Size of nonfamily households - 1-person household (%)
Size of nonfamily households - 2-person household (%)
Size of nonfamily households - 3-person household (%)
Size of nonfamily households - 4-person household (%)
Size of nonfamily households - 5-person household (%)
Size of nonfamily households - 6-person household (%)
Size of nonfamily households - 7-or-moreperson household (%)
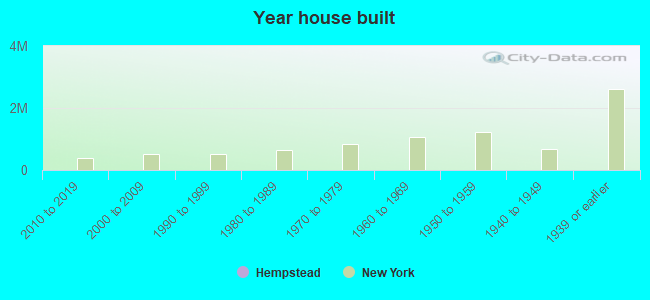
Year house built - Built 2010 or later (%)
Year house built - Built 2000 to 2009 (%)
Year house built - Built 1990 to 1999 (%)
Year house built - Built 1980 to 1989 (%)
Year house built - Built 1970 to 1979 (%)
Year house built - Built 1960 to 1969 (%)
Year house built - Built 1950 to 1959 (%)
Year house built - Built 1940 to 1949 (%)
Year house built - Built 1939 or earlier (%)
Median number of rooms in houses and condos
Median number of rooms in apartments
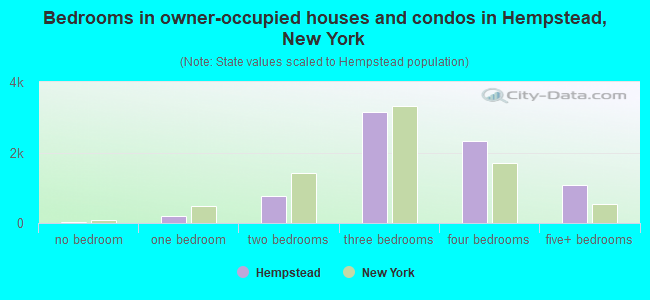
Median number of bedrooms in owner occupied houses
Mean number of bedrooms in owner occupied houses
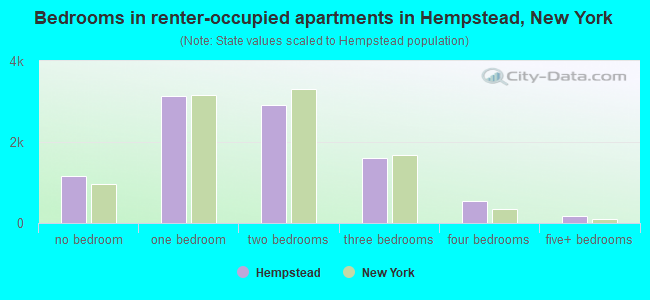
Median number of bedrooms in renter occupied houses
Mean number of bedrooms in renter occupied houses
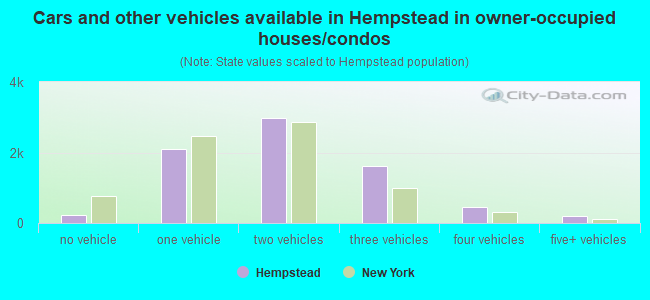
Median number of vehichles in owner occupied houses
Mean number of vehichles in owner occupied houses
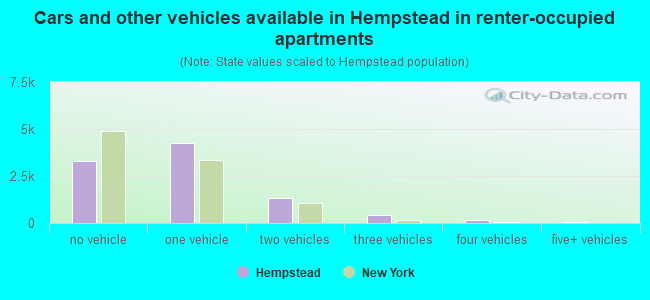
Median number of vehichles in renter occupied houses
Mean number of vehichles in renter occupied houses
Rooms in owner-occupied houses - 1 room (%)
Rooms in owner-occupied houses - 2 rooms (%)
Rooms in owner-occupied houses - 3 rooms (%)
Rooms in owner-occupied houses - 4 rooms (%)
Rooms in owner-occupied houses - 5 rooms (%)
Rooms in owner-occupied houses - 6 rooms (%)
Rooms in owner-occupied houses - 7 rooms (%)
Rooms in owner-occupied houses - 8 rooms (%)
Rooms in owner-occupied houses - 9+ rooms (%)
Rooms in renter-occupied houses - 1 room (%)
Rooms in renter-occupied houses - 2 rooms (%)
Rooms in renter-occupied houses - 3 rooms (%)
Rooms in renter-occupied houses - 4 rooms (%)
Rooms in renter-occupied houses - 5 rooms (%)
Rooms in renter-occupied houses - 6 rooms (%)
Rooms in renter-occupied houses - 7 rooms (%)
Rooms in renter-occupied houses - 8 rooms (%)
Rooms in renter-occupied houses - 9+ rooms (%)
Bedrooms in owner-occupied houses - no bedrooms (%)
Bedrooms in owner-occupied houses - 1 bedroom (%)
Bedrooms in owner-occupied houses - 2 bedrooms (%)
Bedrooms in owner-occupied houses - 3 bedrooms (%)
Bedrooms in owner-occupied houses - 4 bedrooms (%)
Bedrooms in owner-occupied houses - 5+ bedrooms (%)
Bedrooms in renter-occupied houses - no bedrooms (%)
Bedrooms in renter-occupied houses - 1 bedroom (%)
Bedrooms in renter-occupied houses - 2 bedrooms (%)
Bedrooms in renter-occupied houses - 3 bedrooms (%)
Bedrooms in renter-occupied houses - 4 bedrooms (%)
Bedrooms in renter-occupied houses - 5+ bedrooms (%)
Vehicles available in owner-occupied houses - no vehicle available (%)
Vehicles available in owner-occupied houses - 1 vehicle available(%)
Vehicles available in owner-occupied houses - 2 Vehicles available (%)
Vehicles available in owner-occupied houses - 3 Vehicles available (%)
Vehicles available in owner-occupied houses - 4 Vehicles available (%)
Vehicles available in owner-occupied houses - 5+ Vehicles available (%)
Vehicles available in renter-occupied houses - no vehicle available (%)
Vehicles available in renter-occupied houses - 1 vehicle available (%)
Vehicles available in renter-occupied houses - 2 Vehicles available (%)
Vehicles available in renter-occupied houses - 3 Vehicles available (%)
Vehicles available in renter-occupied houses - 4 Vehicles available (%)
Vehicles available in renter-occupied houses - 5+ Vehicles available (%)
Housing units in structures - 1, detached (%)
Housing units in structures - 1, attached (%)
Housing units in structures - 2 (%)
Housing units in structures - 3 or 4 (%)
Housing units in structures - 5 to 9 (%)
Housing units in structures - 10 to 19 (%)
Housing units in structures - 20 to 49 (%)
Housing units in structures - 50 or more (%)
Housing units in structures - Mobile home (%)
Housing units in structures - Boat, RV, van, etc. (%)
Housing units in structures - Owners - 1, detached (%)
Housing units in structures - Owners - 1, attached (%)
Housing units in structures - Owners - 2 (%)
Housing units in structures - Owners - 3 or 4 (%)
Housing units in structures - Owners - 5 to 9 (%)
Housing units in structures - Owners - 10 to 19 (%)
Housing units in structures - Owners - 20 to 49 (%)
Housing units in structures - Owners - 50 or more (%)
Housing units in structures - Owners - Mobile home (%)
Housing units in structures - Owners - Boat, RV, van, etc. (%)
Housing units in structures - Renters - 1, detached (%)
Housing units in structures - Renters - 1, attached (%)
Housing units in structures - Renters - 2 (%)
Housing units in structures - Renters - 3 or 4 (%)
Housing units in structures - Renters - 5 to 9 (%)
Housing units in structures - Renters - 10 to 19 (%)
Housing units in structures - Renters - 20 to 49 (%)
Housing units in structures - Renters - 50 or more (%)
Housing units in structures - Renters - Mobile home (%)
Housing units in structures - Renters - Boat, RV, van, etc. (%)
House/condo owner moved in on average (years ago)
Renter moved in on average (years ago)
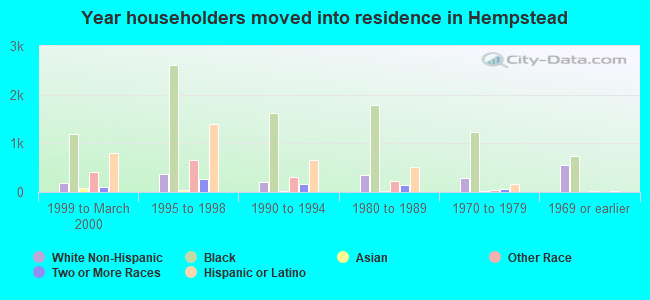
Year householder moved into unit - Moved in 1999 to March 2000 (%)
Year householder moved into unit - Moved in 1999 to March 2000 (%) - White
Year householder moved into unit - Moved in 1999 to March 2000 (%) - Black or African American
Year householder moved into unit - Moved in 1999 to March 2000 (%) - Asian
Year householder moved into unit - Moved in 1999 to March 2000 (%) - Hispanic or Latino
Year householder moved into unit - Moved in 1999 to March 2000 (%) - American Indian and Alaska Native
Year householder moved into unit - Moved in 1999 to March 2000 (%) - Multirace
Year householder moved into unit - Moved in 1999 to March 2000 (%) - Other Race
Year householder moved into unit - Moved in 1995 to 1998 (%)
Year householder moved into unit - Moved in 1995 to 1998 (%) - White
Year householder moved into unit - Moved in 1995 to 1998 (%) - Black or African American
Year householder moved into unit - Moved in 1995 to 1998 (%) - Asian
Year householder moved into unit - Moved in 1995 to 1998 (%) - Hispanic or Latino
Year householder moved into unit - Moved in 1995 to 1998 (%) - American Indian and Alaska Native
Year householder moved into unit - Moved in 1995 to 1998 (%) - Multirace
Year householder moved into unit - Moved in 1995 to 1998 (%) - Other Race
Year householder moved into unit - Moved in 1990 to 1994 (%)
Year householder moved into unit - Moved in 1990 to 1994 (%) - White
Year householder moved into unit - Moved in 1990 to 1994 (%) - Black or African American
Year householder moved into unit - Moved in 1990 to 1994 (%) - Asian
Year householder moved into unit - Moved in 1990 to 1994 (%) - Hispanic or Latino
Year householder moved into unit - Moved in 1990 to 1994 (%) - American Indian and Alaska Native
Year householder moved into unit - Moved in 1990 to 1994 (%) - Multirace
Year householder moved into unit - Moved in 1990 to 1994 (%) - Other Race
Year householder moved into unit - Moved in 1980 to 1989 (%)
Year householder moved into unit - Moved in 1980 to 1989 (%) - White
Year householder moved into unit - Moved in 1980 to 1989 (%) - Black or African American
Year householder moved into unit - Moved in 1980 to 1989 (%) - Asian
Year householder moved into unit - Moved in 1980 to 1989 (%) - Hispanic or Latino
Year householder moved into unit - Moved in 1980 to 1989 (%) - American Indian and Alaska Native
Year householder moved into unit - Moved in 1980 to 1989 (%) - Multirace
Year householder moved into unit - Moved in 1980 to 1989 (%) - Other Race
Year householder moved into unit - Moved in 1970 to 1979 (%)
Year householder moved into unit - Moved in 1970 to 1979 (%) - White
Year householder moved into unit - Moved in 1970 to 1979 (%) - Black or African American
Year householder moved into unit - Moved in 1970 to 1979 (%) - Asian
Year householder moved into unit - Moved in 1970 to 1979 (%) - Hispanic or Latino
Year householder moved into unit - Moved in 1970 to 1979 (%) - American Indian and Alaska Native
Year householder moved into unit - Moved in 1970 to 1979 (%) - Multirace
Year householder moved into unit - Moved in 1970 to 1979 (%) - Other Race
Year householder moved into unit - Moved in 1969 or earlier (%)
Year householder moved into unit - Moved in 1969 or earlier (%) - White
Year householder moved into unit - Moved in 1969 or earlier (%) - Black or African American
Year householder moved into unit - Moved in 1969 or earlier (%) - Asian
Year householder moved into unit - Moved in 1969 or earlier (%) - Hispanic or Latino
Year householder moved into unit - Moved in 1969 or earlier (%) - American Indian and Alaska Native
Year householder moved into unit - Moved in 1969 or earlier (%) - Multirace
Year householder moved into unit - Moved in 1969 or earlier (%) - Other Race
Housing units lacking complete plumbing facilities (%)
Housing units lacking complete kitchen facilities (%)
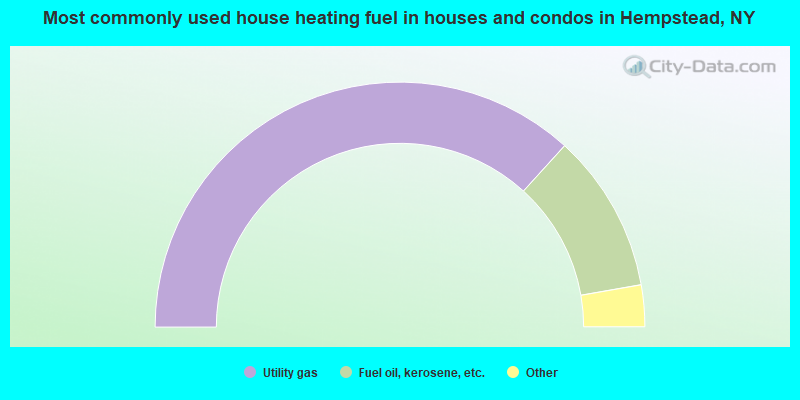
House heating fuel used in houses and condos - Utility gas (%)
House heating fuel used in houses and condos - Bottled, tank, or LP gas (%)
House heating fuel used in houses and condos - Electricity (%)
House heating fuel used in houses and condos - Fuel oil, kerosene, etc. (%)
House heating fuel used in houses and condos - Coal or coke (%)
House heating fuel used in houses and condos - Wood (%)
House heating fuel used in houses and condos - Solar energy (%)
House heating fuel used in houses and condos - Other fuel (%)
House heating fuel used in houses and condos - No fuel used (%)
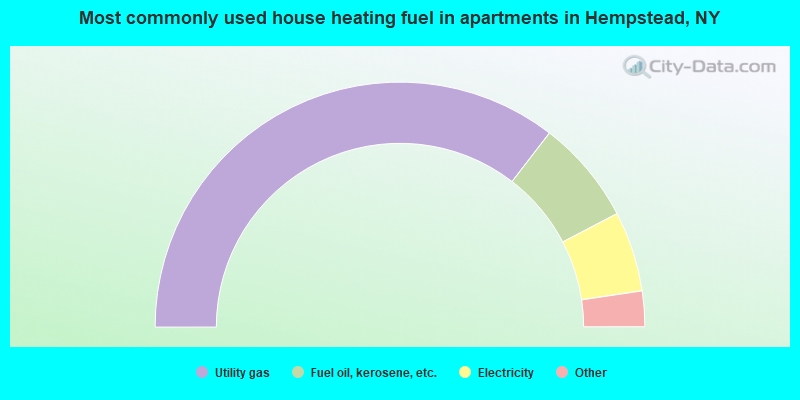
House heating fuel used in apartments - Utility gas (%)
House heating fuel used in apartments - Bottled, tank, or LP gas (%)
House heating fuel used in apartments - Electricity (%)
House heating fuel used in apartments - Fuel oil, kerosene, etc. (%)
House heating fuel used in apartments - Coal or coke (%)
House heating fuel used in apartments - Wood (%)
House heating fuel used in apartments - Solar energy (%)
House heating fuel used in apartments - Other fuel (%)
House heating fuel used in apartments - No fuel used (%)
Latest news about housing in Hempstead, NY collected exclusively by city-data.com from local newspapers, TV, and radio stations
Median year house/condo built: 1950Median year apartment built: 1966Household type by relationship:
Households: 58,327
Male householders: 6,603 (1,521 living alone ), Female householders: 10,360 (2,189 living alone )5,290 spouses (5,248 opposite-sex spouses ), 1,522 unmarried partners , (1,477 opposite-sex unmarried partners ), 18,967 children (18,096 natural , 145 adopted , 725 stepchildren ), 2,062 grandchildren , 2,641 brothers or sisters , 2,326 parents , 0 foster children , 4,358 other relatives , 3,294 non-relatives In group quarters: 900
Size of family households: 2,896 2-persons , 2,582 3-persons , 2,929 4-persons , 1,835 5-persons , 870 6-persons , 1,419 7-or-more-persons .
Size of nonfamily households: 3,868 1-person , 526 2-persons , 85 3-persons , 21 4-persons , 24 5-persons , 11 6-persons , 57 7-or-more-persons .
4,170 married couples with children. single-parent households (992 men , 4,631 women ).
51.1% of residents of Hempstead speak English at home. of residents speak Spanish at home (37% speak English very well , 18% speak English well , 30% speak English not well , 15% don't speak English at all ).of residents speak other Indo-European language at home (55% speak English very well , 23% speak English well , 14% speak English not well , 8% don't speak English at all ).of residents speak Asian or Pacific Island language at home (56% speak English very well , 28% speak English well , 15% speak English not well , 2% don't speak English at all ).of residents speak other language at home (81% speak English very well , 17% speak English well , 3% speak English not well ).
Foreign born population: 23,018 (39.5%)of them are naturalized citizens )
Median number of rooms in houses and condos:
Median number of rooms in apartments
Owner-occupied Renter-occupied
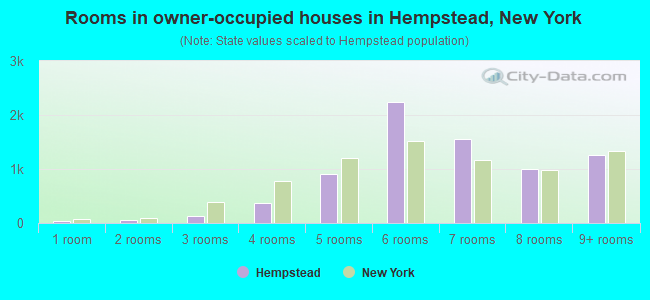
Rooms in owner-occupied houses in Hempstead, New York
37 1 room 60 2 rooms 135 3 rooms 370 4 rooms 905 5 rooms 2,238 6 rooms 1,560 7 rooms 994 8 rooms 1,252 9+ rooms
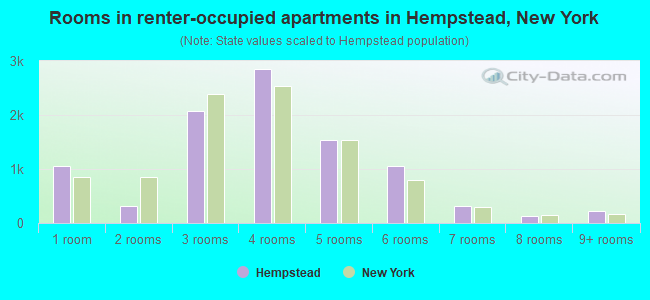
Rooms in renter-occupied apartments in Hempstead, New York
1,050 1 room 324 2 rooms 2,069 3 rooms 2,847 4 rooms 1,529 5 rooms 1,049 6 rooms 322 7 rooms 122 8 rooms 219 9+ rooms
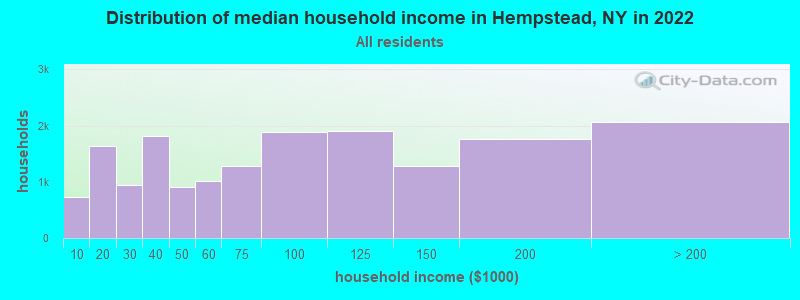
Hempstead, NY household income distribution 727 Less than $10,0001,640 $10,000 to $19,999936 $20,000 to $29,9991,808 $30,000 to $39,999903 $40,000 to $49,9991,005 $50,000 to $59,9991,287 $60,000 to $74,9991,885 $75,000 to $99,9991,898 $100,000 to $124,9991,288 $125,000 to $149,9991,764 $150,000 to $199,9992,063 $200,000 or more
Home value of owner - occupied houses in 2022 in Hempstead, NY 235 Less than $10,0009 $25,000 to $29,99917 $30,000 to $34,9998 $35,000 to $39,99910 $40,000 to $49,99984 $50,000 to $59,99918 $80,000 to $89,99930 $90,000 to $99,99972 $100,000 to $124,99936 $125,000 to $149,99965 $150,000 to $174,99967 $175,000 to $199,999440 $200,000 to $249,999242 $250,000 to $299,9991,516 $300,000 to $399,9991,943 $400,000 to $499,9991,528 $500,000 to $749,999135 $750,000 to $999,999106 $1,000,000 to $1,499,999Rent paid by renters in 2022 in Hempstead, NY 336 Less than $100315 $100 to $149164 $150 to $199405 $200 to $249117 $250 to $299172 $300 to $34998 $350 to $399160 $400 to $449111 $450 to $499229 $500 to $54947 $550 to $59928 $600 to $64925 $650 to $699144 $700 to $74985 $750 to $799109 $800 to $899414 $900 to $9991,245 $1,000 to $1,2491,063 $1,250 to $1,4992,910 $1,500 to $1,9991,114 $2,000 to $2,499617 $2,500 to $2,999116 $3,000 to $3,499136 $3,500 or more201 No cash rent
Percentage of workers working in this county: 72.0%Number of people working at home: 1,995 (7.1% of all workers )
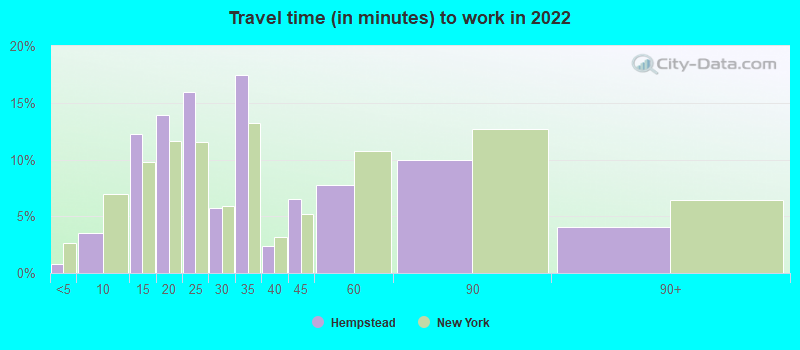
Travel time to work (commute)
Less than 5 minutes: 1615 to 9 minutes: 52110 to 14 minutes: 2,28915 to 19 minutes: 3,45320 to 24 minutes: 3,62825 to 29 minutes: 1,50430 to 34 minutes: 5,89335 to 39 minutes: 48340 to 44 minutes: 1,72945 to 59 minutes: 2,11660 to 89 minutes: 2,19290 or more minutes: 1,589
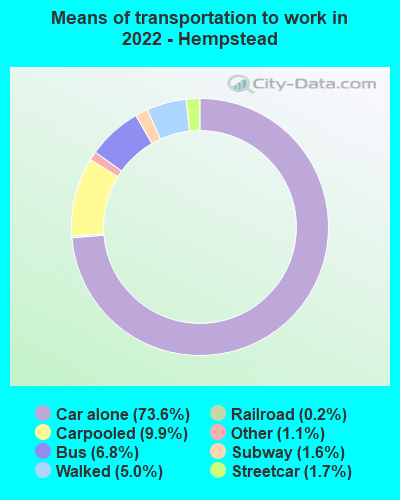
Means of transportation to work:
Drove a car alone: 11,798 (64.5%)Carpooled: 1,541 (8.4%)Bus : 1,050 (5.7%)Subway or elevated rail : 241 (1.3%)Long-distance train or commuter rail : 230 (1.3%)Light rail, streetcar or trolley : 28 (0.2%)Ferryboat: 9 (0.0%)Taxi: 260 (1.4%)Bicycle: 8 (0.0%)Walked: 856 (4.7%)Worked at home: 1,995 (10.9%)
Unemployment by race in 2022
Unemployment rate for White non-Hispanic residents 2.3% MalesUnemployment rate for Black residents 9.0% Males9.6% FemalesUnemployment rate for Asian residents 0.2% Males14.9% FemalesUnemployment rate for other race residents 6.8% Males4.5% FemalesUnemployment rate for two or more race residents 7.2% Males5.2% FemalesUnemployment rate for Hispanic or Latino residents 7.2% Males4.8% Females
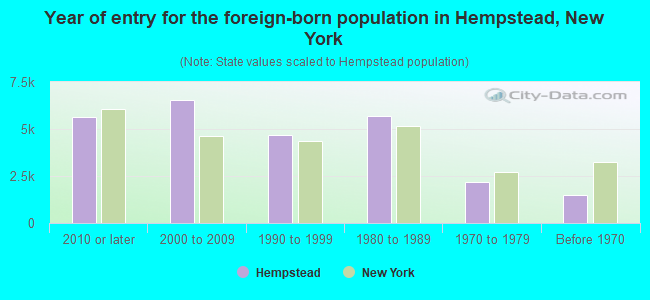
Year of entry for the foreign-born population in Hempstead, New York
5,618 2010 or later 6,552 2000 to 2009 4,707 1990 to 1999 5,679 1980 to 1989 2,158 1970 to 1979 1,469 Before 1970
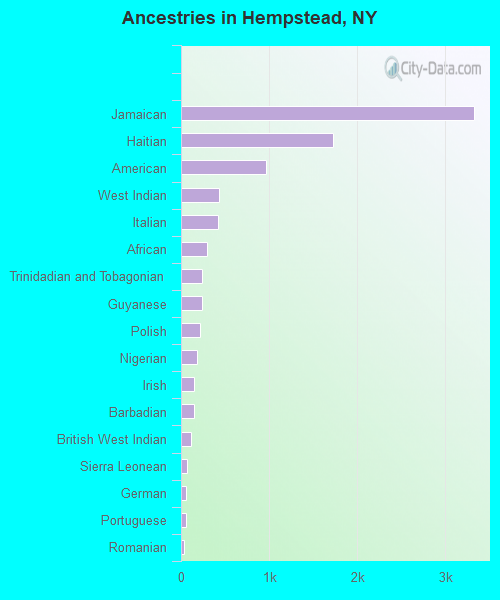
First ancestries reported:
Jamaican: 3,328 (8.2%)
Haitian: 1,728 (4.3%)
American: 959 (2.4%)
West Indian: 429 (1.1%)
Italian: 419 (1.0%)
African: 294 (0.7%)
Trinidadian and Tobagonian: 243 (0.6%)
Guyanese: 235 (0.6%)
Polish: 218 (0.5%)
Nigerian: 178 (0.4%)
Irish: 145 (0.4%)
Barbadian: 143 (0.4%)
British West Indian: 112 (0.3%)
Sierra Leonean: 63 (0.2%)
German: 61 (0.2%)
Portuguese: 55 (0.1%)
Romanian: 32 (0.08%)
Ghanaian: 29 (0.07%)
Brazilian: 26 (0.06%)
Liberian: 24 (0.06%)
Dutch: 20 (0.05%)
Israeli: 19 (0.05%)
English: 18 (0.04%)
French Canadian: 16 (0.04%)
Greek: 13 (0.03%)
Russian: 13 (0.03%)
British: 12 (0.03%)
European: 12 (0.03%)
Kenyan: 11 (0.03%)
Belgian: 7 (0.02%)
Armenian: 5 (0.01%)
French: 4 (0.01%) Most common places of birth for foreign-born residents (%): El Salvador Hempstead:
33.3% (7,409)New York:
2.4% (108,067)
Honduras Hempstead:
11.6% (2,577)New York:
1.2% (55,571)
Jamaica Hempstead:
11.2% (2,493)New York:
5.0% (227,557)
Haiti Hempstead:
8.3% (1,853)New York:
2.8% (126,936)
Dominican Republic Hempstead:
5.3% (1,174)New York:
11.1% (501,040)
Guatemala Hempstead:
4.4% (982)New York:
1.4% (61,245)
Ecuador Hempstead:
3.3% (745)New York:
3.9% (177,448)
Colombia Hempstead:
2.8% (631)New York:
2.5% (111,920)
Trinidad and Tobago Hempstead:
2.1% (477)New York:
2.0% (91,428)
Mexico Hempstead:
1.9% (414)New York:
4.8% (214,559)
Venezuela Hempstead:
1.7% (372)New York:
0.4% (19,652)
Guyana Hempstead:
1.6% (349)New York:
3.8% (172,129)
Place of birth for U.S.-born residents:
This state: 31,025Other state: 3,516Northeast: 327Midwest: 281South: 2,552West: 362 90.6% of Hempstead residents lived in the same house 1 years ago.
Out of people who lived in different houses, 36.1% lived in this county.
Out of people who lived in different counties, 85.6% lived in New York.
Hempstead:
90.6%State average:
89.6%
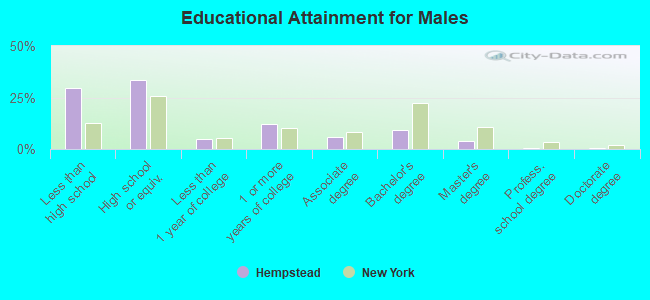
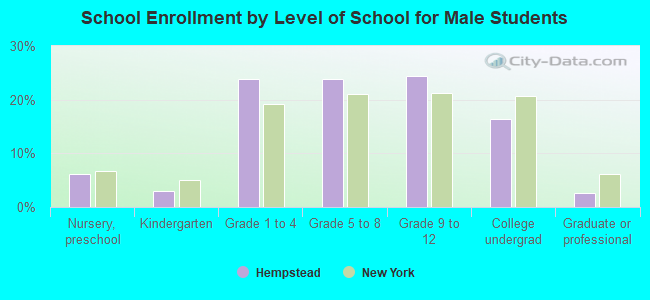
Education attainment for males 25 years and older:
No schooling: 1,877Nursery to 4th grade: 6645th and 6th grade: 9017th and 8th grade: 4629th grade: 23410th grade: 12111th grade: 32012th grade, no diploma: 791High school graduate (or equivalency): 6,079Less than 1 year of college: 869Some college more than 1 year, no degree: 2,188Associate degree: 1,066Bachelor's degree: 1,715Master's degree: 707Professional school degree: 100Doctorate degree: 46
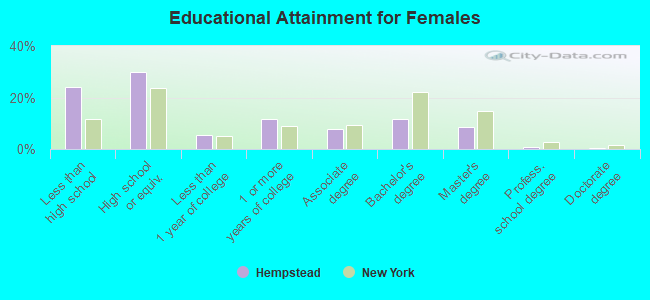
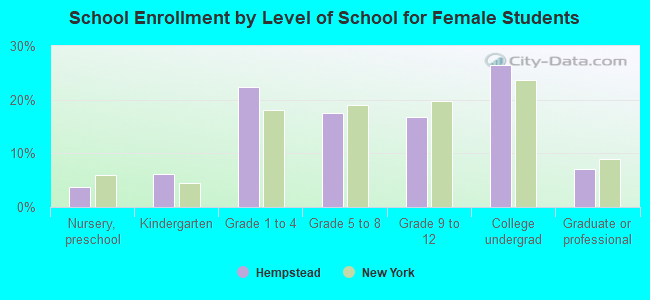
Education attainment for females 25 years and older:
No schooling: 1,389Nursery to 4th grade: 7055th and 6th grade: 6187th and 8th grade: 4259th grade: 25410th grade: 15911th grade: 51412th grade, no diploma: 843High school graduate (or equivalency): 6,117Less than 1 year of college: 1,130Some college more than 1 year, no degree: 2,339Associate degree: 1,596Bachelor's degree: 2,349Master's degree: 1,706Professional school degree: 181Doctorate degree: 47
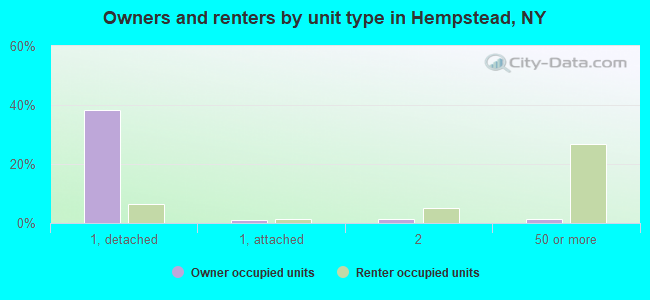
Housing units in structures:
One, detached: 8,339One, attached: 575Two: 1,2723 or 4: 6215 to 9: 77810 to 19: 72620 to 49: 1,40950 or more: 4,730Mobile homes: 80Housing units lacking complete plumbing facilities in 2022: 1.0%Housing units lacking complete kitchen facilities in 2022: 1.1%House/condo owner moved in on average 14 years ago
Renter moved in on average 6 years ago
Private vs. public school enrollment:
Students in private schools in grades 1 to 8 (elementary and middle school): 403 Students in private schools in grades 9 to 12 (high school): 325 Students in private undergraduate colleges: 649