Harker Heights, TX (Texas) Houses and Residents
| Harker Heights: | $286,805 |
| Texas: | $275,400 |
Total population: 28,526 (Urban population: 16,110, Rural population: 1,199 (6 farm, 1,193 nonfarm))
Houses: 13,328 (12,293 occupied: 7,038 owner occupied, 5,517 renter occupied)
| % of renters here: | 44% |
| State: | 38% |
Housing density: 1,044 houses/condos per square mile
Median price asked for vacant for-sale houses and condos in 2022: $133,778.
Median contract rent in 2022: $812 (lower quartile is $716, upper quartile is $1,176)
Median rent asked for vacant for-rent units in 2022: $872
Median gross rent in Harker Heights, TX in 2022: $1,103
Housing units in Harker Heights with a mortgage: 4,954 (230 second mortgage, 0 home equity loan, 228 both second mortgage and home equity loan)
Houses without a mortgage: 53
Median household income for houses/condos with a mortgage: $107,929
Median household income for apartments without a mortgage: $62,440
Median monthly housing costs: $1,252
Compare current foreclosures near Harker Heights, TX:
| Photo | Address | Area | Beds / Baths | Price | Details |
|---|---|---|---|---|---|

|
#1
Wickiup Trl
Harker Heights, TX 76548
|
- sq. feet
|
- baths - beds |
show details | |

|
#2
Llama Trl
Harker Heights, TX 76548
|
- sq. feet
|
- baths - beds |
show details | |

|
#3
Lancaster Dr
Belton, TX 76513
|
2,085 sq. feet
|
2 baths 3 beds |
show details | |

|
#4
Kirk Ave
Killeen, TX 76543
|
1,402 sq. feet
|
2 baths 3 beds |
show details | |

|
#5
Embers Dr
Killeen, TX 76542
|
- sq. feet
|
2 baths 4 beds |
show details | |

|
#6
Carmen St
Killeen, TX 76541
|
- sq. feet
|
2 baths 4 beds |
show details | |

|
#7
Red Oak Dr
Kln-Harker Heights, TX 76548
|
1,958 sq. feet
|
2 baths - beds |
show details | |

|
#8
Salado Dr
Temple, TX 76502
|
- sq. feet
|
2 baths 4 beds |
show details | |

|
#9
Shawn Dr
Killeen, TX 76542
|
- sq. feet
|
2 baths 3 beds |
show details | |

|
#10
N 7th St # B
Copperas Cove, TX 76522
|
2,176 sq. feet
|
3 baths - beds |
show details |
| Photo | Address | Area | Beds / Baths | Price | Details |
|---|---|---|---|---|---|

|
#11
Tanner Rd
Copperas Cove, TX 76522
|
1,463 sq. feet
|
2 baths - beds |
show details | |

|
#12
Northern Dancer Dr
Copperas Cove, TX 76522
|
1,618 sq. feet
|
2 baths - beds |
show details | |

|
#13
Bond St
Copperas Cove, TX 76522
|
2,185 sq. feet
|
2 baths - beds |
show details | |

|
#14
Eagle Trl
Copperas Cove, TX 76522
|
3,474 sq. feet
|
3 baths - beds |
show details | |

|
#15
Jeffery Ln
Copperas Cove, TX 76522
|
1,933 sq. feet
|
2 baths - beds |
show details | |

|
#16
Breaker Cir
Temple, TX 76502
|
- sq. feet
|
2 baths 3 beds |
show details | |

|
#17
Magnolia St
Copperas Cove, TX 76522
|
1,659 sq. feet
|
2 baths - beds |
show details | |

|
#18
Dixon Cir
Copperas Cove, TX 76522
|
1,580 sq. feet
|
2 baths - beds |
show details | |

|
#19
Bermuda Dr
Killeen, TX 76549
|
- sq. feet
|
2 baths 3 beds |
show details | |

|
#20
Goodnight Dr
Killeen, TX 76541
|
- sq. feet
|
1 baths 3 beds |
show details |
| Photo | Address | Area | Beds / Baths | Price | Details |
|---|---|---|---|---|---|

|
#21
Johnson Dr
Killeen, TX 76549
|
- sq. feet
|
2 baths 3 beds |
show details | |

|
#22
Turquoise
Killeen, TX 76542
|
1,685 sq. feet
|
- baths - beds |
show details | |

|
#23
Hinkle Ave
Killeen, TX 76549
|
- sq. feet
|
2 baths 2 beds |
show details | |

|
#24
Double Creek Dr
Jarrell, TX 76537
|
1,700 sq. feet
|
2 baths - beds |
show details | |

|
#25
Shiela Ct
Copperas Cove, TX 76522
|
1,766 sq. feet
|
2 baths - beds |
show details | |

|
#26
Shady Hill Dr
Temple, TX 76502
|
- sq. feet
|
2 baths 3 beds |
show details | |

|
#27
Katelyn Cir
Copperas Cove, TX 76522
|
1,565 sq. feet
|
2 baths - beds |
show details | |

|
#28
Cottonwood Ln
Temple, TX 76502
|
- sq. feet
|
2 baths 5 beds |
show details | |

|
#29
S Roy Reynolds Dr
Kln-Harker Heights, TX 76548
|
- sq. feet
|
2 baths 4 beds |
show details | |

|
#30
Diana Ln
Kln-Harker Heights, TX 76548
|
- sq. feet
|
2 baths 4 beds |
show details |
| Photo | Address | Area | Beds / Baths | Price | Details |
|---|---|---|---|---|---|

|
#31
Scott Dr
Copperas Cove, TX 76522
|
2,064 sq. feet
|
2 baths - beds |
show details | |

|
#32
Oliver Loving Dr
Killeen, TX 76549
|
- sq. feet
|
- baths - beds |
show details | |

|
#33
Damascus Dr
Belton, TX 76513
|
- sq. feet
|
- baths - beds |
show details | |

|
#34
Deer Park Rd
Killeen, TX 76542
|
- sq. feet
|
- baths - beds |
show details | |

|
#35
Cactus Flower Ln
Killeen, TX 76549
|
- sq. feet
|
- baths - beds |
show details | |

|
#36
Magnolia Rd
Killeen, TX 76549
|
- sq. feet
|
- baths - beds |
show details | |

|
#37
Hollow Loop
Salado, TX 76571
|
- sq. feet
|
- baths - beds |
show details | |

|
#38
Pintail Loop
Copperas Cove, TX 76522
|
- sq. feet
|
- baths - beds |
show details | |

|
#39
Cordillera Dr
Killeen, TX 76549
|
- sq. feet
|
- baths - beds |
show details | |

|
#40
Twin Oaks Dr Apt 1607
Temple, TX 76504
|
- sq. feet
|
- baths - beds |
show details |
| Photo | Address | Area | Beds / Baths | Price | Details |
|---|---|---|---|---|---|

|
#41
Verde Dr
Killeen, TX 76549
|
- sq. feet
|
- baths - beds |
show details | |

|
#42
Azura Way
Killeen, TX 76549
|
- sq. feet
|
- baths - beds |
show details | |

|
#43
Karankawa Cir Apt 4
Killeen, TX 76544
|
- sq. feet
|
- baths - beds |
show details | |

|
#44
Creekside Dr
Belton, TX 76513
|
- sq. feet
|
- baths - beds |
show details | |

|
#45
W Avenue D
Belton, TX 76513
|
- sq. feet
|
1 baths - beds |
show details | |

|
#46
Colonel Dr
Killeen, TX 76549
|
- sq. feet
|
- baths - beds |
show details | |

|
#47
Fairbanks St
Copperas Cove, TX 76522
|
- sq. feet
|
- baths - beds |
show details | |

|
#48
Abergavenny Dr
Belton, TX 76513
|
- sq. feet
|
- baths - beds |
show details | |

|
#49
Cody Poe Rd
Killeen, TX 76549
|
- sq. feet
|
- baths - beds |
show details | |

|
Check over 1 million property listings on Foreclosure.com!
|
browse all offers | |||


 | Is Temple, TX a good place for Real Estate investment? (9 replies) |
| Rental Homes in Temple (3 replies) |
| Moving to Ft. Hood...where to buy a home? (12 replies) |
| Relocating - Granbury to Austin, 1+ Acre Preferred (10 replies) |
| Killeen - which areas are less safe or nice ? (9 replies) |
| Anyone familiar with Temple? (18 replies) |

Median year apartment built: 1998
Household type by relationship:
Households: 34,415- Male householders: 6,087 (1,552 living alone), Female householders: 6,182 (1,404 living alone)
5,854 spouses (5,822 opposite-sex spouses), 753 unmarried partners, (697 opposite-sex unmarried partners), 12,378 children (11,357 natural, 552 adopted, 468 stepchildren), 522 grandchildren, 549 brothers or sisters, 520 parents, 0 foster children, 759 other relatives, 604 non-relatives
- In group quarters: 202
Size of family households: 3,913 2-persons, 1,994 3-persons, 1,749 4-persons, 1,055 5-persons, 321 6-persons, 127 7-or-more-persons.
Size of nonfamily households: 2,922 1-person, 354 2-persons, 68 3-persons, 25 5-persons.
6,082 married couples with children.
2,919 single-parent households (573 men, 2,346 women).
78.1% of residents of Harker Heights speak English at home.
11.5% of residents speak Spanish at home (76% speak English very well, 9% speak English well, 9% speak English not well, 6% don't speak English at all).
3.8% of residents speak other Indo-European language at home (91% speak English very well, 4% speak English well, 4% speak English not well, 1% don't speak English at all).
3.9% of residents speak Asian or Pacific Island language at home (62% speak English very well, 22% speak English well, 8% speak English not well, 8% don't speak English at all).
1.1% of residents speak other language at home (100% speak English very well).
Foreign born population: 4,041 (11.7%)
(48.3% of them are naturalized citizens)
| Here: | 6.3 |
| State: | 6.3 |
| Here: | 4.2 |
| State: | 4.0 |

- Bedrooms in owner-occupied houses and condos in Harker Heights, Texas
- 0no bedroom
- 161 bedroom
- 3782 bedrooms
- 3,0503 bedrooms
- 3,1924 bedrooms
- 4025+ bedrooms

- Bedrooms in renter-occupied apartments in Harker Heights, Texas
- 59no bedroom
- 6671 bedroom
- 1,9442 bedrooms
- 2,1203 bedrooms
- 5374 bedrooms
- 1905+ bedrooms

- Cars and other vehicles available in Harker Heights in owner-occupied houses/condos
- 123no vehicle
- 1,4221 vehicle
- 3,3772 vehicles
- 1,4793 vehicles
- 4334 vehicles
- 2055+ vehicles

- Cars and other vehicles available in Harker Heights in renter-occupied apartments
- 646no vehicle
- 2,4271 vehicle
- 1,8042 vehicles
- 5473 vehicles
- 944 vehicles
- 05+ vehicles

- Rooms in owner-occupied houses in Harker Heights, Texas
- 01 room
- 02 rooms
- 1553 rooms
- 3184 rooms
- 1,4845 rooms
- 1,7086 rooms
- 1,3797 rooms
- 8558 rooms
- 1,1419+ rooms

- Rooms in renter-occupied apartments in Harker Heights, Texas
- 591 room
- 4422 rooms
- 9113 rooms
- 1,6494 rooms
- 6975 rooms
- 7316 rooms
- 5717 rooms
- 2038 rooms
- 2549+ rooms


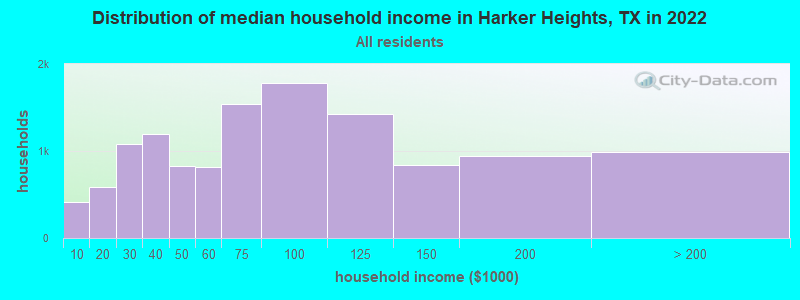
Harker Heights, TX household income distribution

- 413Less than $10,000
- 583$10,000 to $19,999
- 1,078$20,000 to $29,999
- 1,194$30,000 to $39,999
- 822$40,000 to $49,999
- 820$50,000 to $59,999
- 1,537$60,000 to $74,999
- 1,785$75,000 to $99,999
- 1,427$100,000 to $124,999
- 834$125,000 to $149,999
- 948$150,000 to $199,999
- 988$200,000 or more
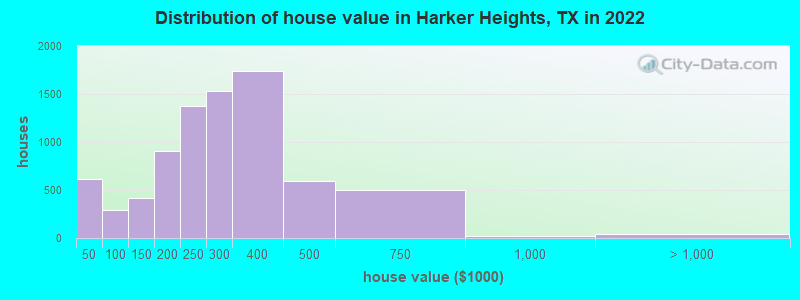
Home value of owner - occupied houses in 2022 in Harker Heights, TX
-
- 319Less than $10,000
- 127$10,000 to $14,999
- 29$15,000 to $19,999
- 8$20,000 to $24,999
- 89$25,000 to $29,999
- 37$30,000 to $34,999
- 7$40,000 to $49,999
- 22$50,000 to $59,999
- 75$60,000 to $69,999
- 138$70,000 to $79,999
- 21$80,000 to $89,999
- 28$90,000 to $99,999
- 169$100,000 to $124,999
- 243$125,000 to $149,999
- 359$150,000 to $174,999
- 549$175,000 to $199,999
- 1,375$200,000 to $249,999
- 1,531$250,000 to $299,999
- 1,736$300,000 to $399,999
- 592$400,000 to $499,999
- 502$500,000 to $749,999
- 22$750,000 to $999,999
- 44$1,000,000 to $1,499,999
Rent paid by renters in 2022 in Harker Heights, TX
-
- 16$150 to $199
- 34$200 to $249
- 20$300 to $349
- 41$400 to $449
- 186$450 to $499
- 128$500 to $549
- 162$550 to $599
- 240$600 to $649
- 247$650 to $699
- 425$700 to $749
- 824$750 to $799
- 699$800 to $899
- 137$900 to $999
- 957$1,000 to $1,249
- 204$1,250 to $1,499
- 823$1,500 to $1,999
- 215$2,000 to $2,499
- 8$2,500 to $2,999
- 174No cash rent


Percentage of workers working in this county: 85.8%
Number of people working at home: 1,785 (10.5% of all workers)
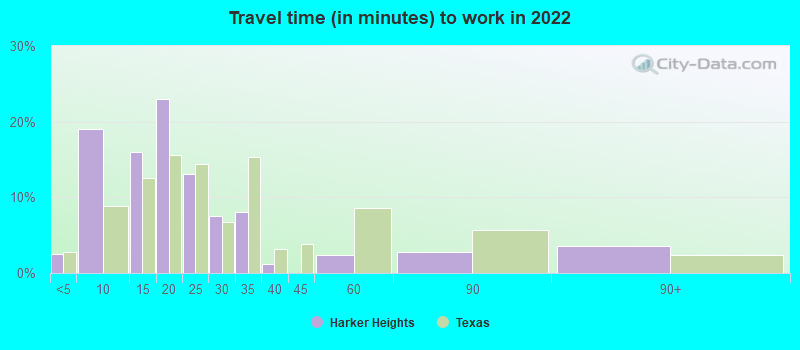
Travel time to work (commute)
- Less than 5 minutes: 337
- 5 to 9 minutes: 1,480
- 10 to 14 minutes: 2,028
- 15 to 19 minutes: 3,032
- 20 to 24 minutes: 2,465
- 25 to 29 minutes: 1,820
- 30 to 34 minutes: 1,479
- 35 to 39 minutes: 242
- 40 to 44 minutes: 259
- 45 to 59 minutes: 539
- 60 to 89 minutes: 1,231
- 90 or more minutes: 366
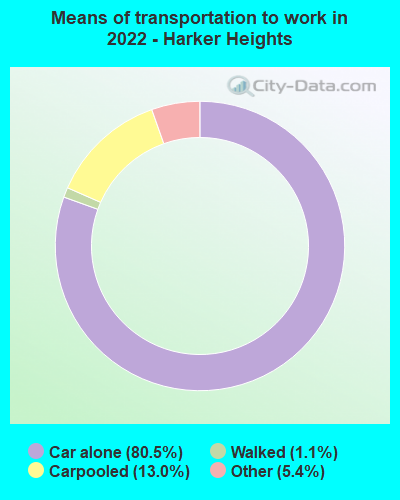
Means of transportation to work:
- Drove a car alone: 6,418 (67.6%)
- Carpooled: 1,025 (10.8%)
- Taxi: 599 (6.3%)
- Bicycle: 4 (0.0%)
- Walked: 71 (0.7%)
- Worked at home: 1,785 (18.8%)

- Unemployment by race in 2022
- Unemployment rate for White non-Hispanic residents
- 2.6%Males
- 1.4%Females
- Unemployment rate for Black residents
- 3.6%Males
- 5.6%Females
- Unemployment rate for other race residents
- 16.6%Males
- Unemployment rate for two or more race residents
- 7.9%Males
- 4.3%Females
- Unemployment rate for Hispanic or Latino residents
- 16.6%Males
- 2.8%Females

- Year of entry for the foreign-born population in Harker Heights, Texas
- 1,8362010 or later
- 7162000 to 2009
- 5001990 to 1999
- 3011980 to 1989
- 3941970 to 1979
- 307Before 1970

First ancestries reported:
- American: 2,898 (14.8%)
- German: 1,262 (6.5%)
- Dutch: 515 (2.6%)
- Irish: 468 (2.4%)
- Jamaican: 375 (1.9%)
- English: 331 (1.7%)
- European: 311 (1.6%)
- Nigerian: 276 (1.4%)
- Polish: 251 (1.3%)
- Norwegian: 186 (1.0%)
- Italian: 170 (0.9%)
- Scottish: 108 (0.6%)
- British: 100 (0.5%)
- African: 87 (0.4%)
- Syrian: 85 (0.4%)
- Hungarian: 58 (0.3%)
- Swiss: 39 (0.2%)
- Scotch-Irish: 39 (0.2%)
- Egyptian: 38 (0.2%)
- West Indian: 37 (0.2%)
- Guyanese: 36 (0.2%)
- Austrian: 33 (0.2%)
- Russian: 32 (0.2%)
- Albanian: 31 (0.2%)
- Ukrainian: 29 (0.1%)
- Portuguese: 27 (0.1%)
- Canadian: 27 (0.1%)
- Latvian: 19 (0.10%)
- Scandinavian: 16 (0.08%)
- Eastern European: 14 (0.07%)
- Northern European: 13 (0.07%)
- French: 13 (0.07%)
- Arab: 12 (0.06%)
- Welsh: 8 (0.04%)
- Greek: 7 (0.04%)
- Czech: 6 (0.03%)
- Swedish: 5 (0.03%)
Most common places of birth for foreign-born residents (%):
| Harker Heights: | 16.5% (574) |
| Texas: | 48.4% (2,411,723) |
| Harker Heights: | 11.3% (395) |
| Texas: | 0.0% (1,934) |
| Harker Heights: | 8.2% (287) |
| Texas: | 0.1% (5,793) |
| Harker Heights: | 8.0% (278) |
| Texas: | 1.8% (87,382) |
| Harker Heights: | 6.9% (241) |
| Texas: | 0.4% (17,748) |
| Harker Heights: | 6.8% (238) |
| Texas: | 0.8% (37,989) |
| Harker Heights: | 6.0% (208) |
| Texas: | 3.7% (184,770) |
| Harker Heights: | 5.5% (192) |
| Texas: | 1.2% (60,172) |
| Harker Heights: | 4.2% (147) |
| Texas: | 0.3% (15,368) |
| Harker Heights: | 4.0% (139) |
| Texas: | 1.9% (96,110) |
| Harker Heights: | 3.6% (127) |
| Texas: | 2.1% (103,148) |
| Harker Heights: | 2.5% (87) |
| Texas: | 0.6% (27,844) |
| Harker Heights: | 1.8% (62) |
| Texas: | 6.1% (306,347) |
Place of birth for U.S.-born residents:
- This state: 12,315
- Other state: 15,830
- Northeast: 1,520
- Midwest: 3,040
- South: 6,511
- West: 4,663
80.0% of Harker Heights residents lived in the same house 1 years ago.
Out of people who lived in different houses, 31.0% lived in this county.
Out of people who lived in different counties, 37.8% lived in Texas.
| Harker Heights: | 80.0% |
| State average: | 85.7% |
Education attainment for males 25 years and older:
- No schooling: 92
- Nursery to 4th grade: 15
- 5th and 6th grade: 134
- 7th and 8th grade: 96
- 9th grade: 400
- 10th grade: 0
- 11th grade: 88
- 12th grade, no diploma: 236
- High school graduate (or equivalency): 1,967
- Less than 1 year of college: 889
- Some college more than 1 year, no degree: 2,021
- Associate degree: 1,022
- Bachelor's degree: 2,178
- Master's degree: 759
- Professional school degree: 232
- Doctorate degree: 68

Education attainment for females 25 years and older:
- No schooling: 398
- Nursery to 4th grade: 32
- 5th and 6th grade: 114
- 7th and 8th grade: 0
- 9th grade: 268
- 10th grade: 104
- 11th grade: 93
- 12th grade, no diploma: 264
- High school graduate (or equivalency): 2,523
- Less than 1 year of college: 761
- Some college more than 1 year, no degree: 2,139
- Associate degree: 1,101
- Bachelor's degree: 2,571
- Master's degree: 792
- Professional school degree: 79
- Doctorate degree: 32


Housing units in structures:
- One, detached: 8,622
- One, attached: 240
- Two: 655
- 3 or 4: 1,368
- 5 to 9: 130
- 10 to 19: 607
- 20 to 49: 11
- 50 or more: 181
- Mobile homes: 1,511
Housing units lacking complete kitchen facilities in 2022: 1.3%
House/condo owner moved in on average 7 years ago
Renter moved in on average 2 years ago

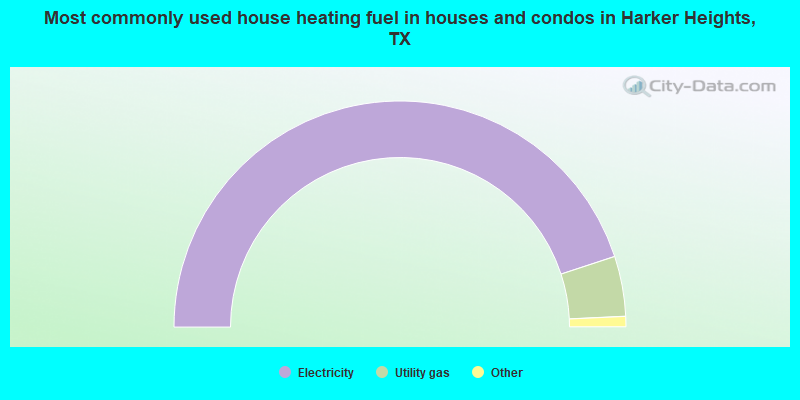
- 90.0%Electricity
- 8.6%Utility gas
- 0.9%No fuel used
- 0.4%Solar energy
- 0.2%Bottled, tank, or LP gas
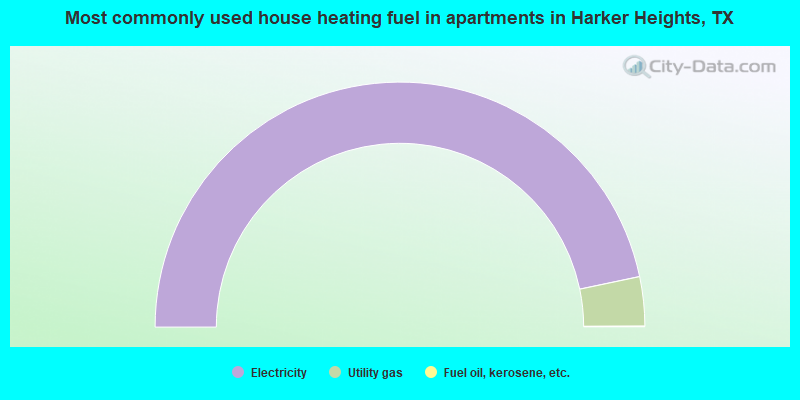
- 93.4%Electricity
- 6.5%Utility gas
- 0.1%Fuel oil, kerosene, etc.
Private vs. public school enrollment:
| Here: | 10.2% |
| Texas: | 8.8% |
| Here: | 11.7% |
| Texas: | 8.0% |
| Here: | 9.3% |
| Texas: | 16.2% |


