Greenville, NC (North Carolina) Houses and Residents
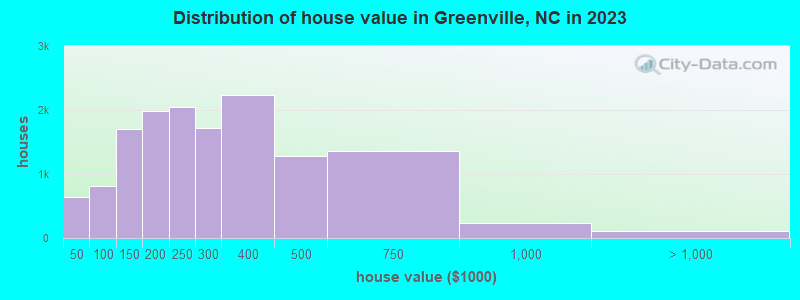
Estimated median house or condo value in 2022: $231,400 (it was $92,100 in 2000 )
Greenville:
$231,400North Carolina:
$280,600
Lower value quartile - upper value quartile: $163,500 - $335,900Mean price in 2022: Detached houses: $307,687 Here:
$307,687State:
$375,326
Townhouses or other attached units: $210,780 Here:
$210,780State:
$317,935
In 2-unit structures: $102,486 Here:
$102,486State:
$250,488
In 3-to-4-unit structures: $172,496 Here:
$172,496State:
$254,939
In 5-or-more-unit structures: $83,559 Here:
$83,559State:
$329,290
Mobile homes: $67,031 Here:
$67,031State:
$124,933
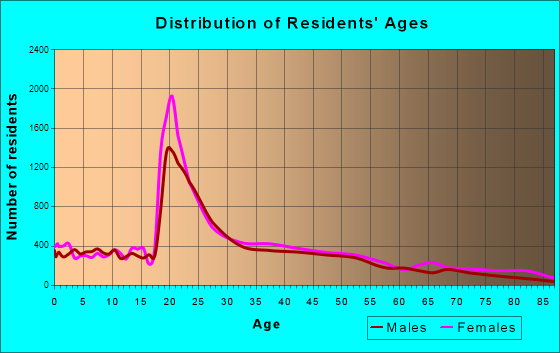
Total population: 89,852 (Urban population: 59,682, Rural population: 703 (all nonfarm) )
Houses: 45,880 (41,645 occupied: 13,927 owner occupied, 27,718 renter occupied )
% of renters here:
67%State:
33%
Housing density: 1,794 houses/condos per square mile
Median price asked for vacant for-sale houses and condos in 2022: $151,106.
Median contract rent in 2022: $765 (lower quartile is $621, upper quartile is $1,099)
Median rent asked for vacant for-rent units in 2022: $1,399
Median gross rent in Greenville, NC in 2022: $921
Housing units in Greenville with a mortgage: 10,003 (1,033 second mortgage, 0 home equity loan, 853 both second mortgage and home equity loan )Houses without a mortgage: 214
Median household income for houses/condos with a mortgage: $85,365
Median household income for apartments without a mortgage: $50,870
Median monthly housing costs: $991
Data:
Median house or condo value ($)
Median house or condo value ($ change since 2000)
Median house or condo value ($) - White
Median house or condo value ($) - Black or African American
Median house or condo value ($) - Asian
Median house or condo value ($) - Hispanic or Latino
Median house or condo value ($) - American Indian and Alaska Native
Median house or condo value ($) - Multirace
Median house or condo value ($) - Other Race
Median price asked for mobile homes ($)
Household density (households per square mile)
Mean house or condo value by units in structure - 1, detached ($)
Mean house or condo value by units in structure - 1, attached ($)
Mean house or condo value by units in structure - 2 ($)
Mean house or condo value by units in structure by units in structure - 3 or 4 ($)
Mean house or condo value by units in structure - 5 or more ($)
Mean house or condo value by units in structure - Boat, RV, van, etc. ($)
Mean house or condo value by units in structure - Mobile home ($)
Median contract rent ($)
Median contract rent - Lower quartile ($)
Median contract rent - Upper quartile ($)
Median gross rent ($)
Urban houses (%)
Rural houses (%)
Houses occupied (%)
Houses occupied (% change since 2000)
Houses owner occupied (%)
Houses owner occupied (% change since 2000)
Houses renter occupied (%)
Houses renter occupied (% change since 2000)
Vacant housing units - For rent (%)
Vacant housing units - For rent (% change since 2000)
Vacant housing units - For sale only (%)
Vacant housing units - For sale only (% change since 2000)
Vacant housing units - Rented or sold, not occupied (%)
Vacant housing units - Rented or sold, not occupied (% change since 2000)
Vacant housing units - For seasonal, recreational, or occasional use (%)
Vacant housing units - For seasonal, recreational, or occasional use (% change since 2000)
Vacant housing units - For migrant workers (%)
Vacant housing units - For migrant workers (% change since 2000)
Vacant housing units - Other vacant (%)
Vacant housing units - Other vacant (% change since 2000)
Median monthly housing costs ($)
Median household income for houses/condos with a mortgage ($)
Median household income for houses/condos without a mortgage ($)
Median household income ($)
Median household income ($) - White
Median household income ($) - Black or African American
Median household income ($) - Asian
Median household income ($) - Hispanic or Latino
Median household income ($) - American Indian and Alaska Native
Median household income ($) - Multirace
Median household income ($) - Other Race
Mortgage status - with mortgage (%)
Mortgage status - with second mortgage (%)
Mortgage status - with home equity loan (%)
Mortgage status - with both second mortgage and home equity loan (%)
Mortgage status - without a mortgage (%)
Median year house/condo built
Median year apartment built
Household type by relationship - Male householder living alone (%)
Household type by relationship - Male householder not living alone (%)
Household type by relationship - Female householder living alone (%)
Household type by relationship - Female householder not living alone (%)
Household type by relationship - Opposite-Sex spouse (%)
Household type by relationship - Same-Sex spouse (%)
Household type by relationship - Opposite-Sex unmarried partner (%)
Household type by relationship - Same-Sex unmarried partner (%)
Household type by relationship - In group quarters (%)
Size of family households - 2-person household (%)
Size of family households - 3-person household (%)
Size of family households - 4-person household (%)
Size of family households - 5-person household (%)
Size of family households - 6-person household (%)
Size of family households - 7-or-more-person household (%)
Size of nonfamily households - 1-person household (%)
Size of nonfamily households - 2-person household (%)
Size of nonfamily households - 3-person household (%)
Size of nonfamily households - 4-person household (%)
Size of nonfamily households - 5-person household (%)
Size of nonfamily households - 6-person household (%)
Size of nonfamily households - 7-or-moreperson household (%)
Year house built - Built 2010 or later (%)
Year house built - Built 2000 to 2009 (%)
Year house built - Built 1990 to 1999 (%)
Year house built - Built 1980 to 1989 (%)
Year house built - Built 1970 to 1979 (%)
Year house built - Built 1960 to 1969 (%)
Year house built - Built 1950 to 1959 (%)
Year house built - Built 1940 to 1949 (%)
Year house built - Built 1939 or earlier (%)
Median number of rooms in houses and condos
Median number of rooms in apartments
Median number of bedrooms in owner occupied houses
Mean number of bedrooms in owner occupied houses
Median number of bedrooms in renter occupied houses
Mean number of bedrooms in renter occupied houses
Median number of vehichles in owner occupied houses
Mean number of vehichles in owner occupied houses
Median number of vehichles in renter occupied houses
Mean number of vehichles in renter occupied houses
Rooms in owner-occupied houses - 1 room (%)
Rooms in owner-occupied houses - 2 rooms (%)
Rooms in owner-occupied houses - 3 rooms (%)
Rooms in owner-occupied houses - 4 rooms (%)
Rooms in owner-occupied houses - 5 rooms (%)
Rooms in owner-occupied houses - 6 rooms (%)
Rooms in owner-occupied houses - 7 rooms (%)
Rooms in owner-occupied houses - 8 rooms (%)
Rooms in owner-occupied houses - 9+ rooms (%)
Rooms in renter-occupied houses - 1 room (%)
Rooms in renter-occupied houses - 2 rooms (%)
Rooms in renter-occupied houses - 3 rooms (%)
Rooms in renter-occupied houses - 4 rooms (%)
Rooms in renter-occupied houses - 5 rooms (%)
Rooms in renter-occupied houses - 6 rooms (%)
Rooms in renter-occupied houses - 7 rooms (%)
Rooms in renter-occupied houses - 8 rooms (%)
Rooms in renter-occupied houses - 9+ rooms (%)
Bedrooms in owner-occupied houses - no bedrooms (%)
Bedrooms in owner-occupied houses - 1 bedroom (%)
Bedrooms in owner-occupied houses - 2 bedrooms (%)
Bedrooms in owner-occupied houses - 3 bedrooms (%)
Bedrooms in owner-occupied houses - 4 bedrooms (%)
Bedrooms in owner-occupied houses - 5+ bedrooms (%)
Bedrooms in renter-occupied houses - no bedrooms (%)
Bedrooms in renter-occupied houses - 1 bedroom (%)
Bedrooms in renter-occupied houses - 2 bedrooms (%)
Bedrooms in renter-occupied houses - 3 bedrooms (%)
Bedrooms in renter-occupied houses - 4 bedrooms (%)
Bedrooms in renter-occupied houses - 5+ bedrooms (%)
Vehicles available in owner-occupied houses - no vehicle available (%)
Vehicles available in owner-occupied houses - 1 vehicle available(%)
Vehicles available in owner-occupied houses - 2 Vehicles available (%)
Vehicles available in owner-occupied houses - 3 Vehicles available (%)
Vehicles available in owner-occupied houses - 4 Vehicles available (%)
Vehicles available in owner-occupied houses - 5+ Vehicles available (%)
Vehicles available in renter-occupied houses - no vehicle available (%)
Vehicles available in renter-occupied houses - 1 vehicle available (%)
Vehicles available in renter-occupied houses - 2 Vehicles available (%)
Vehicles available in renter-occupied houses - 3 Vehicles available (%)
Vehicles available in renter-occupied houses - 4 Vehicles available (%)
Vehicles available in renter-occupied houses - 5+ Vehicles available (%)
Housing units in structures - 1, detached (%)
Housing units in structures - 1, attached (%)
Housing units in structures - 2 (%)
Housing units in structures - 3 or 4 (%)
Housing units in structures - 5 to 9 (%)
Housing units in structures - 10 to 19 (%)
Housing units in structures - 20 to 49 (%)
Housing units in structures - 50 or more (%)
Housing units in structures - Mobile home (%)
Housing units in structures - Boat, RV, van, etc. (%)
Housing units in structures - Owners - 1, detached (%)
Housing units in structures - Owners - 1, attached (%)
Housing units in structures - Owners - 2 (%)
Housing units in structures - Owners - 3 or 4 (%)
Housing units in structures - Owners - 5 to 9 (%)
Housing units in structures - Owners - 10 to 19 (%)
Housing units in structures - Owners - 20 to 49 (%)
Housing units in structures - Owners - 50 or more (%)
Housing units in structures - Owners - Mobile home (%)
Housing units in structures - Owners - Boat, RV, van, etc. (%)
Housing units in structures - Renters - 1, detached (%)
Housing units in structures - Renters - 1, attached (%)
Housing units in structures - Renters - 2 (%)
Housing units in structures - Renters - 3 or 4 (%)
Housing units in structures - Renters - 5 to 9 (%)
Housing units in structures - Renters - 10 to 19 (%)
Housing units in structures - Renters - 20 to 49 (%)
Housing units in structures - Renters - 50 or more (%)
Housing units in structures - Renters - Mobile home (%)
Housing units in structures - Renters - Boat, RV, van, etc. (%)
House/condo owner moved in on average (years ago)
Renter moved in on average (years ago)
Year householder moved into unit - Moved in 1999 to March 2000 (%)
Year householder moved into unit - Moved in 1999 to March 2000 (%) - White
Year householder moved into unit - Moved in 1999 to March 2000 (%) - Black or African American
Year householder moved into unit - Moved in 1999 to March 2000 (%) - Asian
Year householder moved into unit - Moved in 1999 to March 2000 (%) - Hispanic or Latino
Year householder moved into unit - Moved in 1999 to March 2000 (%) - American Indian and Alaska Native
Year householder moved into unit - Moved in 1999 to March 2000 (%) - Multirace
Year householder moved into unit - Moved in 1999 to March 2000 (%) - Other Race
Year householder moved into unit - Moved in 1995 to 1998 (%)
Year householder moved into unit - Moved in 1995 to 1998 (%) - White
Year householder moved into unit - Moved in 1995 to 1998 (%) - Black or African American
Year householder moved into unit - Moved in 1995 to 1998 (%) - Asian
Year householder moved into unit - Moved in 1995 to 1998 (%) - Hispanic or Latino
Year householder moved into unit - Moved in 1995 to 1998 (%) - American Indian and Alaska Native
Year householder moved into unit - Moved in 1995 to 1998 (%) - Multirace
Year householder moved into unit - Moved in 1995 to 1998 (%) - Other Race
Year householder moved into unit - Moved in 1990 to 1994 (%)
Year householder moved into unit - Moved in 1990 to 1994 (%) - White
Year householder moved into unit - Moved in 1990 to 1994 (%) - Black or African American
Year householder moved into unit - Moved in 1990 to 1994 (%) - Asian
Year householder moved into unit - Moved in 1990 to 1994 (%) - Hispanic or Latino
Year householder moved into unit - Moved in 1990 to 1994 (%) - American Indian and Alaska Native
Year householder moved into unit - Moved in 1990 to 1994 (%) - Multirace
Year householder moved into unit - Moved in 1990 to 1994 (%) - Other Race
Year householder moved into unit - Moved in 1980 to 1989 (%)
Year householder moved into unit - Moved in 1980 to 1989 (%) - White
Year householder moved into unit - Moved in 1980 to 1989 (%) - Black or African American
Year householder moved into unit - Moved in 1980 to 1989 (%) - Asian
Year householder moved into unit - Moved in 1980 to 1989 (%) - Hispanic or Latino
Year householder moved into unit - Moved in 1980 to 1989 (%) - American Indian and Alaska Native
Year householder moved into unit - Moved in 1980 to 1989 (%) - Multirace
Year householder moved into unit - Moved in 1980 to 1989 (%) - Other Race
Year householder moved into unit - Moved in 1970 to 1979 (%)
Year householder moved into unit - Moved in 1970 to 1979 (%) - White
Year householder moved into unit - Moved in 1970 to 1979 (%) - Black or African American
Year householder moved into unit - Moved in 1970 to 1979 (%) - Asian
Year householder moved into unit - Moved in 1970 to 1979 (%) - Hispanic or Latino
Year householder moved into unit - Moved in 1970 to 1979 (%) - American Indian and Alaska Native
Year householder moved into unit - Moved in 1970 to 1979 (%) - Multirace
Year householder moved into unit - Moved in 1970 to 1979 (%) - Other Race
Year householder moved into unit - Moved in 1969 or earlier (%)
Year householder moved into unit - Moved in 1969 or earlier (%) - White
Year householder moved into unit - Moved in 1969 or earlier (%) - Black or African American
Year householder moved into unit - Moved in 1969 or earlier (%) - Asian
Year householder moved into unit - Moved in 1969 or earlier (%) - Hispanic or Latino
Year householder moved into unit - Moved in 1969 or earlier (%) - American Indian and Alaska Native
Year householder moved into unit - Moved in 1969 or earlier (%) - Multirace
Year householder moved into unit - Moved in 1969 or earlier (%) - Other Race
Housing units lacking complete plumbing facilities (%)
Housing units lacking complete kitchen facilities (%)
House heating fuel used in houses and condos - Utility gas (%)
House heating fuel used in houses and condos - Bottled, tank, or LP gas (%)
House heating fuel used in houses and condos - Electricity (%)
House heating fuel used in houses and condos - Fuel oil, kerosene, etc. (%)
House heating fuel used in houses and condos - Coal or coke (%)
House heating fuel used in houses and condos - Wood (%)
House heating fuel used in houses and condos - Solar energy (%)
House heating fuel used in houses and condos - Other fuel (%)
House heating fuel used in houses and condos - No fuel used (%)
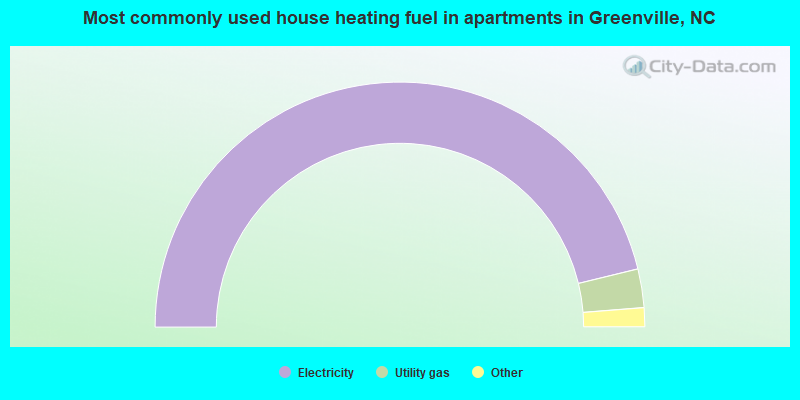
House heating fuel used in apartments - Utility gas (%)
House heating fuel used in apartments - Bottled, tank, or LP gas (%)
House heating fuel used in apartments - Electricity (%)
House heating fuel used in apartments - Fuel oil, kerosene, etc. (%)
House heating fuel used in apartments - Coal or coke (%)
House heating fuel used in apartments - Wood (%)
House heating fuel used in apartments - Solar energy (%)
House heating fuel used in apartments - Other fuel (%)
House heating fuel used in apartments - No fuel used (%)
Latest news about housing in Greenville, NC collected exclusively by city-data.com from local newspapers, TV, and radio stations
Median year house/condo built: 2001Median year apartment built: 2001Household type by relationship:
Households: 89,222
Male householders: 17,235 (6,297 living alone ), Female householders: 24,410 (9,191 living alone )11,361 spouses (11,329 opposite-sex spouses ), 3,044 unmarried partners , (2,839 opposite-sex unmarried partners ), 17,811 children (17,261 natural , 397 adopted , 153 stepchildren ), 472 grandchildren , 782 brothers or sisters , 1,553 parents , 58 foster children , 835 other relatives , 6,985 non-relatives In group quarters: 4,676
Size of family households: 10,935 2-persons , 4,865 3-persons , 1,736 4-persons , 1,428 5-persons , 128 6-persons , 183 7-or-more-persons .
Size of nonfamily households: 15,488 1-person , 4,931 2-persons , 1,254 3-persons , 697 4-persons .
6,649 married couples with children. single-parent households (1,409 men , 7,020 women ).
93.5% of residents of Greenville speak English at home. of residents speak Spanish at home (65% speak English very well , 27% speak English well , 5% speak English not well , 3% don't speak English at all ).of residents speak other Indo-European language at home (66% speak English very well , 31% speak English well , 3% speak English not well ).of residents speak Asian or Pacific Island language at home (58% speak English very well , 22% speak English well , 15% speak English not well , 5% don't speak English at all ).of residents speak other language at home (68% speak English very well , 27% speak English well , 4% speak English not well ).
Foreign born population: 5,900 (6.6%)of them are naturalized citizens )
Median number of rooms in houses and condos:
Median number of rooms in apartments
Owner-occupied Renter-occupied
Bedrooms in owner-occupied houses and condos in Greenville, North Carolina
0 no bedroom 92 1 bedroom 1,740 2 bedrooms 8,378 3 bedrooms 2,285 4 bedrooms 1,432 5+ bedrooms
Bedrooms in renter-occupied apartments in Greenville, North Carolina
468 no bedroom 7,121 1 bedroom 11,084 2 bedrooms 7,115 3 bedrooms 1,638 4 bedrooms 292 5+ bedrooms
Owner-occupied Renter-occupied
Rooms in owner-occupied houses in Greenville, North Carolina
0 1 room 0 2 rooms 404 3 rooms 1,590 4 rooms 2,841 5 rooms 3,187 6 rooms 1,721 7 rooms 1,068 8 rooms 3,116 9+ rooms
Rooms in renter-occupied apartments in Greenville, North Carolina
468 1 room 1,555 2 rooms 6,992 3 rooms 7,767 4 rooms 5,410 5 rooms 3,025 6 rooms 1,398 7 rooms 546 8 rooms 557 9+ rooms
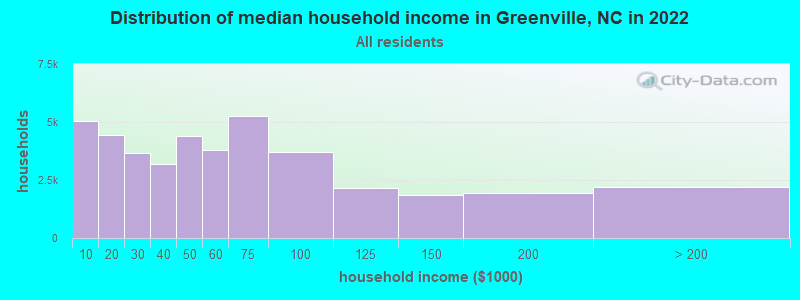
Greenville, NC household income distribution 5,042 Less than $10,0004,459 $10,000 to $19,9993,663 $20,000 to $29,9993,210 $30,000 to $39,9994,382 $40,000 to $49,9993,803 $50,000 to $59,9995,261 $60,000 to $74,9993,694 $75,000 to $99,9992,162 $100,000 to $124,9991,857 $125,000 to $149,9991,934 $150,000 to $199,9992,178 $200,000 or more
Home value of owner - occupied houses in 2022 in Greenville, NC 80 Less than $10,00014 $15,000 to $19,99910 $20,000 to $24,9997 $25,000 to $29,99960 $30,000 to $34,99921 $35,000 to $39,99984 $40,000 to $49,999125 $50,000 to $59,999443 $60,000 to $69,99922 $70,000 to $79,999293 $80,000 to $89,999198 $90,000 to $99,999706 $100,000 to $124,999735 $125,000 to $149,9991,155 $150,000 to $174,9991,309 $175,000 to $199,9992,413 $200,000 to $249,9991,788 $250,000 to $299,9992,000 $300,000 to $399,9991,381 $400,000 to $499,999829 $500,000 to $749,999257 $750,000 to $999,99991 $1,000,000 to $1,499,9998 $2,000,000 or moreRent paid by renters in 2022 in Greenville, NC 398 Less than $100241 $150 to $199120 $200 to $249293 $250 to $299444 $300 to $349223 $350 to $399232 $400 to $4491,143 $450 to $4991,223 $500 to $5491,591 $550 to $5992,061 $600 to $6492,992 $650 to $6992,100 $700 to $7491,656 $750 to $7992,625 $800 to $8991,588 $900 to $9993,519 $1,000 to $1,2491,909 $1,250 to $1,4991,426 $1,500 to $1,999880 $2,000 to $2,499172 $2,500 to $2,999265 $3,000 to $3,499617 No cash rent
Percentage of workers working in this county: 87.2%Number of people working at home: 5,957 (13.4% of all workers )
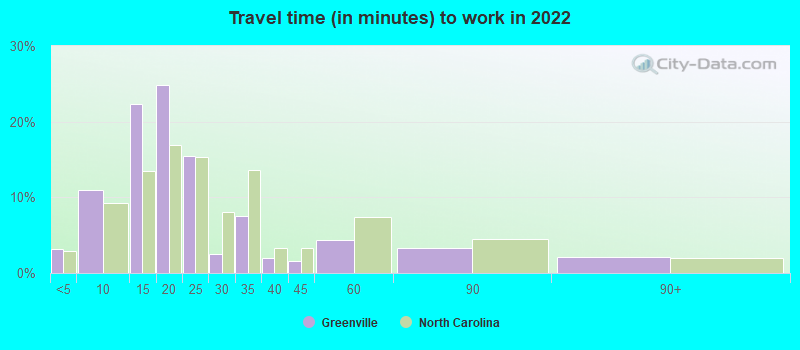
Travel time to work (commute)
Less than 5 minutes: 1,5905 to 9 minutes: 5,52710 to 14 minutes: 11,05115 to 19 minutes: 9,21520 to 24 minutes: 4,38825 to 29 minutes: 49330 to 34 minutes: 2,81135 to 39 minutes: 1,11440 to 44 minutes: 81945 to 59 minutes: 80560 to 89 minutes: 86590 or more minutes: 737
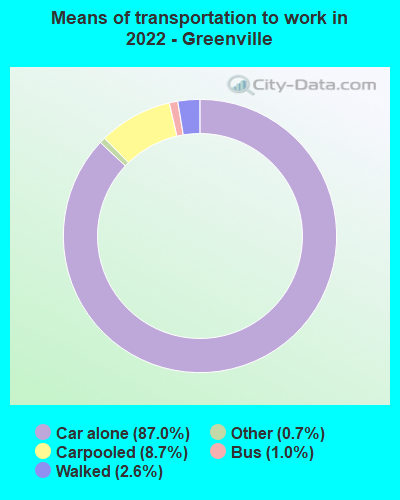
Means of transportation to work:
Drove a car alone: 46,127 (76.4%)Carpooled: 4,789 (7.9%)Bus : 362 (0.6%)Taxi: 367 (0.6%)Bicycle: 42 (0.1%)Walked: 1,476 (2.4%)Worked at home: 5,957 (9.9%)
Unemployment by race in 2022
Unemployment rate for White non-Hispanic residents 2.9% Males3.0% FemalesUnemployment rate for Black residents 8.7% Males9.2% FemalesUnemployment rate for Asian residents 5.7% FemalesUnemployment rate for other race residents 31.4% Males7.2% FemalesUnemployment rate for two or more race residents 2.2% Males7.5% FemalesUnemployment rate for Hispanic or Latino residents 17.3% Males4.4% Females
Year of entry for the foreign-born population in Greenville, North Carolina
2,269 2010 or later 1,078 2000 to 2009 626 1990 to 1999 547 1980 to 1989 253 1970 to 1979 239 Before 1970
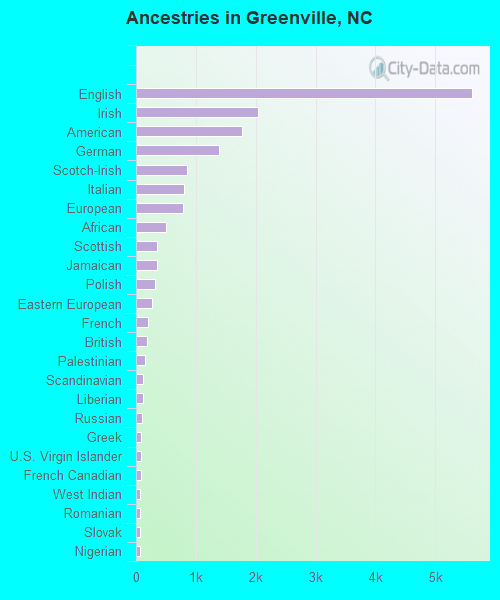
First ancestries reported:
English: 5,618 (14.7%)
Irish: 2,036 (5.3%)
American: 1,763 (4.6%)
German: 1,391 (3.6%)
Scotch-Irish: 852 (2.2%)
Italian: 796 (2.1%)
European: 782 (2.1%)
African: 508 (1.3%)
Scottish: 356 (0.9%)
Jamaican: 355 (0.9%)
Polish: 323 (0.8%)
Eastern European: 268 (0.7%)
French: 195 (0.5%)
British: 185 (0.5%)
Palestinian: 144 (0.4%)
Scandinavian: 124 (0.3%)
Liberian: 110 (0.3%)
Russian: 94 (0.2%)
Greek: 90 (0.2%)
U.S. Virgin Islander: 77 (0.2%)
French Canadian: 77 (0.2%)
West Indian: 71 (0.2%)
Romanian: 68 (0.2%)
Slovak: 66 (0.2%)
Nigerian: 66 (0.2%)
Canadian: 59 (0.2%)
Dutch: 50 (0.1%)
Albanian: 44 (0.1%)
Swiss: 40 (0.1%)
Iraqi: 39 (0.1%)
Ukrainian: 34 (0.09%)
Sudanese: 29 (0.08%)
Haitian: 29 (0.08%)
Brazilian: 27 (0.07%)
Norwegian: 24 (0.06%)
Northern European: 24 (0.06%)
Lebanese: 22 (0.06%)
Iranian: 17 (0.04%)
Welsh: 17 (0.04%)
Turkish: 15 (0.04%)
Czech: 13 (0.03%)
Armenian: 12 (0.03%)
Ghanaian: 11 (0.03%)
Barbadian: 11 (0.03%)
Jordanian: 10 (0.03%)
Portuguese: 10 (0.03%)
Danish: 6 (0.02%)
Guyanese: 5 (0.01%)
Serbian: 4 (0.01%)
Hungarian: 2 (0.01%)
Kenyan: 2 (0.01%)
Most common places of birth for foreign-born residents (%): India Greenville:
12.9% (557)North Carolina:
9.3% (80,594)
Venezuela Greenville:
8.6% (374)North Carolina:
1.2% (9,986)
Jamaica Greenville:
8.5% (368)North Carolina:
1.3% (11,419)
Philippines Greenville:
7.5% (325)North Carolina:
2.4% (20,695)
Canada Greenville:
6.8% (294)North Carolina:
2.1% (18,105)
Mexico Greenville:
5.8% (252)North Carolina:
24.7% (214,776)
Korea Greenville:
4.6% (198)North Carolina:
1.8% (15,988)
China, excluding Hong Kong and Taiwan Greenville:
4.3% (185)North Carolina:
3.2% (27,477)
Japan Greenville:
4.1% (176)North Carolina:
0.7% (5,941)
Nigeria Greenville:
3.4% (147)North Carolina:
1.1% (9,173)
Germany Greenville:
3.4% (145)North Carolina:
1.8% (15,534)
United Kingdom, excluding England and Scotland Greenville:
2.6% (113)North Carolina:
1.1% (9,831)
Liberia Greenville:
2.3% (99)North Carolina:
0.5% (4,475)
Other Eastern Europe Greenville:
2.0% (88)North Carolina:
0.2% (1,928)
Iraq Greenville:
1.9% (82)North Carolina:
0.2% (2,149)
Cuba Greenville:
1.9% (82)North Carolina:
1.0% (9,005)
Colombia Greenville:
1.8% (78)North Carolina:
2.1% (18,275)
Ghana Greenville:
1.8% (76)North Carolina:
0.5% (4,233)
Guatemala Greenville:
1.6% (68)North Carolina:
2.6% (22,964)
Place of birth for U.S.-born residents:
This state: 55,594Other state: 26,841Northeast: 10,489Midwest: 4,069South: 10,377West: 1,906 75.2% of Greenville residents lived in the same house 1 years ago.
Out of people who lived in different houses, 28.9% lived in this county.
Out of people who lived in different counties, 68.4% lived in North Carolina.
Greenville:
75.2%State average:
87.3%
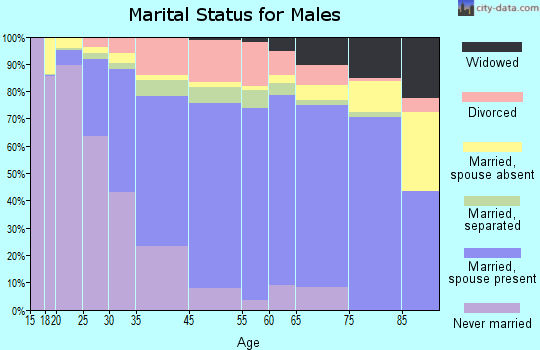
Education attainment for males 25 years and older:
No schooling: 128Nursery to 4th grade: 05th and 6th grade: 457th and 8th grade: 09th grade: 610th grade: 39811th grade: 6512th grade, no diploma: 376High school graduate (or equivalency): 5,807Less than 1 year of college: 158Some college more than 1 year, no degree: 2,822Associate degree: 3,130Bachelor's degree: 5,126Master's degree: 1,771Professional school degree: 993Doctorate degree: 897
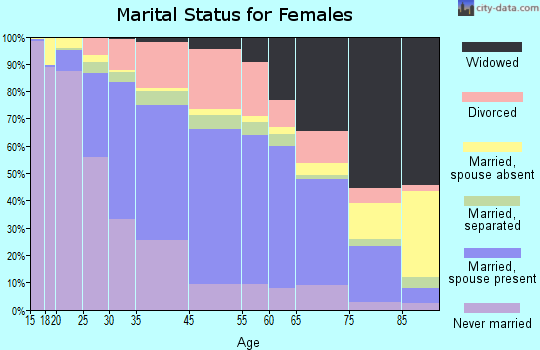
Education attainment for females 25 years and older:
No schooling: 159Nursery to 4th grade: 625th and 6th grade: 07th and 8th grade: 1779th grade: 910th grade: 4711th grade: 22812th grade, no diploma: 424High school graduate (or equivalency): 5,936Less than 1 year of college: 608Some college more than 1 year, no degree: 3,607Associate degree: 3,856Bachelor's degree: 7,199Master's degree: 4,329Professional school degree: 686Doctorate degree: 713
Housing units in structures:
One, detached: 14,656One, attached: 5,580Two: 2,9803 or 4: 2,1615 to 9: 7,66510 to 19: 7,48920 to 49: 3,03150 or more: 2,184Mobile homes: 134Housing units lacking complete plumbing facilities in 2022: 0.4%Housing units lacking complete kitchen facilities in 2022: 1.5%House/condo owner moved in on average 7 years ago
Renter moved in on average 0 years ago
Private vs. public school enrollment:
Students in private schools in grades 1 to 8 (elementary and middle school): 510 Here:
7.5%North Carolina:
13.8%
Students in private schools in grades 9 to 12 (high school): 717 Here:
20.2%North Carolina:
11.9%
Students in private undergraduate colleges: 185 Here:
1.1%North Carolina:
19.3%