Green Tree, PA (Pennsylvania) Houses and Residents
| Green Tree: | $254,368 |
| Pennsylvania: | $245,500 |
Mean price in 2022:
Detached houses: $256,326
Here: $256,326 State: $317,202
Total population: 4,991 (Urban population: 4,719, Rural population: 0)
Houses: 2,470 (2,347 occupied: 1,694 owner occupied, 611 renter occupied)
| % of renters here: | 27% |
| State: | 31% |
Housing density: 1,176 houses/condos per square mile
Median price asked for vacant for-sale houses and condos in 2022 in this county: $195,117.
Median contract rent in 2022: $1,383 (lower quartile is $1,080, upper quartile is $1,732)
Median rent asked for vacant for-rent units in 2022: $1,341
Median gross rent in Green Tree, PA in 2022: $1,587
Housing units in Green Tree with a mortgage: 932 (148 second mortgage, 0 home equity loan, 138 both second mortgage and home equity loan)
Houses without a mortgage: 121
Median household income for houses/condos with a mortgage: $107,182
Median household income for apartments without a mortgage: $71,164
Median monthly housing costs: $1,212
Compare current foreclosures near Green Tree, PA:
| Photo | Address | Area | Beds / Baths | Price | Details |
|---|---|---|---|---|---|

|
#1
Collins St
Mckeesport, PA 15132
|
1,176 sq. feet
|
1 baths 3 beds |
$24,900
|
show details |

|
#2
Kirk Ave
Pittsburgh, PA 15227
|
1,500 sq. feet
|
2 baths 3 beds |
$189,500
|
show details |

|
#3
Leslie St
East Mc Keesport, PA 15035
|
1,144 sq. feet
|
1 baths 2 beds |
$44,900
|
show details |

|
#4
Russellwood Ave
Mc Kees Rocks, PA 15136
|
1,840 sq. feet
|
1 baths 3 beds |
$32,500
|
show details |

|
#5
904 Quaill Ave
Pittsburgh, PA 15202
|
- sq. feet
|
2 baths 6 beds |
$104,000
|
show details |

|
#6
Mount Vernon St
Pittsburgh, PA 15208
|
1,452 sq. feet
|
1 baths 6 beds |
$169,500
|
show details |

|
#7
Mcintosh Dr
Mckeesport, PA 15132
|
1,306 sq. feet
|
2 baths 4 beds |
$226,500
|
show details |

|
#8
Eleanor St
Pitcairn, PA 15140
|
1,730 sq. feet
|
1 baths 4 beds |
$173,500
|
show details |

|
#9
Elwell St
Pittsburgh, PA 15207
|
875 sq. feet
|
1 baths 3 beds |
$52,000
|
show details |

|
#10
Punta Gorda St
East Mc Keesport, PA 15035
|
1,200 sq. feet
|
1 baths 3 beds |
$159,500
|
show details |
| Photo | Address | Area | Beds / Baths | Price | Details |
|---|---|---|---|---|---|

|
#11
Munson Ave
Mc Kees Rocks, PA 15136
|
1,600 sq. feet
|
1 baths 3 beds |
$149,500
|
show details |

|
#12
Perrysville Ave
Pittsburgh, PA 15202
|
2,306 sq. feet
|
1 baths 4 beds |
$441,000
|
show details |

|
#13
Brinwood Ave
Pittsburgh, PA 15227
|
1,000 sq. feet
|
2 baths 3 beds |
$215,900
|
show details |

|
#14
Triana St
Pittsburgh, PA 15210
|
1,184 sq. feet
|
1 baths 3 beds |
$151,500
|
show details |

|
#15
Grant St
Carnegie, PA 15106
|
1,345 sq. feet
|
2 baths 4 beds |
$225,500
|
show details |

|
#16
9th Ave
Elizabeth, PA 15037
|
1,554 sq. feet
|
1 baths 3 beds |
$165,000
|
show details |

|
#17
25th St
Mckeesport, PA 15132
|
1,024 sq. feet
|
1 baths 2 beds |
$44,900
|
show details |

|
#18
Catherine St
Mc Kees Rocks, PA 15136
|
2,688 sq. feet
|
2 baths 4 beds |
show details | |

|
#19
Muse Bishop Rd
Mc Donald, PA 15057
|
2,268 sq. feet
|
1 baths 2 beds |
show details | |

|
#20
Ridge Point Cir
Bridgeville, PA 15017
|
1,344 sq. feet
|
1 baths 3 beds |
show details |
| Photo | Address | Area | Beds / Baths | Price | Details |
|---|---|---|---|---|---|

|
#21
Constitution Cir
Clairton, PA 15025
|
1,064 sq. feet
|
1 baths 3 beds |
show details | |

|
#22
Tingley Ave
Pittsburgh, PA 15202
|
1,920 sq. feet
|
2 baths 2 beds |
show details | |

|
#23
Thompson Ave
Clairton, PA 15025
|
1,200 sq. feet
|
2 baths 3 beds |
show details | |

|
#24
Tingley Ave
Pittsburgh, PA 15202
|
1,404 sq. feet
|
1 baths 3 beds |
show details | |

|
#25
Boulevard Dr
Pittsburgh, PA 15217
|
1,481 sq. feet
|
1 baths 2 beds |
show details | |

|
#26
Baker Ave
Clairton, PA 15025
|
1,248 sq. feet
|
1 baths 3 beds |
show details | |

|
#27
30th St
Mckeesport, PA 15132
|
976 sq. feet
|
1 baths 2 beds |
show details | |

|
#28
Glaser Ave
Pittsburgh, PA 15202
|
1,092 sq. feet
|
2 baths 2 beds |
show details | |

|
#29
Sunset Dr
Pittsburgh, PA 15235
|
1,435 sq. feet
|
2 baths 3 beds |
show details | |

|
#30
California Ave
Pittsburgh, PA 15202
|
2,310 sq. feet
|
4 baths 4 beds |
show details |
| Photo | Address | Area | Beds / Baths | Price | Details |
|---|---|---|---|---|---|

|
#31
Grandview Ave
Mckeesport, PA 15132
|
1,764 sq. feet
|
1 baths 3 beds |
show details | |

|
#32
Lime Hollow Rd
Pittsburgh, PA 15235
|
2,512 sq. feet
|
4 baths 5 beds |
show details | |

|
#33
Songo St
Pittsburgh, PA 15227
|
1,080 sq. feet
|
2 baths 3 beds |
show details | |

|
#34
Geyer Rd
Pittsburgh, PA 15212
|
1,158 sq. feet
|
2 baths 2 beds |
show details | |

|
#35
Greenfield Ave
Pittsburgh, PA 15217
|
1,020 sq. feet
|
1 baths 2 beds |
show details | |

|
#36
Maple St
Bethel Park, PA 15102
|
1,233 sq. feet
|
2 baths 2 beds |
show details | |

|
#37
Taylor St
Pittsburgh, PA 15224
|
1,432 sq. feet
|
1 baths 2 beds |
show details | |

|
#38
N Balph Ave
Pittsburgh, PA 15202
|
1,637 sq. feet
|
2 baths 4 beds |
show details | |

|
#39
George St
Turtle Creek, PA 15145
|
1,584 sq. feet
|
1 baths 3 beds |
show details | |

|
#40
Brighton Rd
Pittsburgh, PA 15202
|
1,850 sq. feet
|
2 baths 2 beds |
show details |
| Photo | Address | Area | Beds / Baths | Price | Details |
|---|---|---|---|---|---|

|
#41
Elliott St
Verona, PA 15147
|
1,458 sq. feet
|
1 baths 2 beds |
show details | |

|
#42
Dawson Ave
Pittsburgh, PA 15202
|
2,186 sq. feet
|
1 baths 4 beds |
show details | |

|
#43
32nd St
Mckeesport, PA 15132
|
1,519 sq. feet
|
1 baths 3 beds |
show details | |

|
#44
Longmount Dr
Pittsburgh, PA 15214
|
1,794 sq. feet
|
2 baths 3 beds |
show details | |

|
#45
Taylor Ave
Pittsburgh, PA 15202
|
2,144 sq. feet
|
2 baths 3 beds |
show details | |

|
#46
Jacks Run Rd
Pittsburgh, PA 15214
|
1,386 sq. feet
|
2 baths 3 beds |
show details | |

|
#47
Dixie Dr
Pittsburgh, PA 15235
|
1,506 sq. feet
|
2 baths 3 beds |
show details | |

|
#48
Connie Dr
Pittsburgh, PA 15214
|
1,898 sq. feet
|
3 baths 4 beds |
show details | |

|
#49
Kenwood Dr
Coraopolis, PA 15108
|
900 sq. feet
|
1 baths 2 beds |
show details | |

|
Check over 1 million property listings on Foreclosure.com!
|
browse all offers | |||


Median year apartment built: 2006
Household type by relationship:
Households: 4,822- Male householders: 950 (191 living alone), Female householders: 1,360 (582 living alone)
1,107 spouses (1,101 opposite-sex spouses), 102 unmarried partners, (102 opposite-sex unmarried partners), 1,072 children (1,060 natural, 11 adopted, 0 stepchildren), 0 grandchildren, 0 brothers or sisters, 61 parents, 0 foster children, 41 other relatives, 121 non-relatives
- In group quarters: 4
Size of family households: 871 2-persons, 274 3-persons, 102 4-persons, 70 5-persons, 35 6-persons.
Size of nonfamily households: 793 1-person, 169 2-persons.
579 married couples with children.
202 single-parent households (167 men, 35 women).
91.2% of residents of Green Tree speak English at home.
0.8% of residents speak Spanish at home (100% speak English very well).
6.0% of residents speak other Indo-European language at home (31% speak English very well, 44% speak English well, 25% speak English not well).
2.7% of residents speak Asian or Pacific Island language at home (94% speak English very well, 6% speak English well).
0.4% of residents speak other language at home (100% speak English not well).
Foreign born population: 340 (7.1%)
(51.5% of them are naturalized citizens)
| Here: | 6.8 |
| State: | 6.8 |
| Here: | 4.3 |
| State: | 4.3 |

- Bedrooms in owner-occupied houses and condos in Green Tree, Pennsylvania
- 0no bedroom
- 01 bedroom
- 2572 bedrooms
- 1,0963 bedrooms
- 3274 bedrooms
- 145+ bedrooms

- Bedrooms in renter-occupied apartments in Green Tree, Pennsylvania
- 78no bedroom
- 781 bedroom
- 2892 bedrooms
- 1283 bedrooms
- 234 bedrooms
- 155+ bedrooms

- Cars and other vehicles available in Green Tree in owner-occupied houses/condos
- 35no vehicle
- 7031 vehicle
- 7562 vehicles
- 1743 vehicles
- 184 vehicles
- 95+ vehicles

- Cars and other vehicles available in Green Tree in renter-occupied apartments
- 40no vehicle
- 3401 vehicle
- 2322 vehicles
- 03 vehicles
- 04 vehicles
- 05+ vehicles

- Rooms in owner-occupied houses in Green Tree, Pennsylvania
- 01 room
- 02 rooms
- 03 rooms
- 224 rooms
- 1565 rooms
- 5296 rooms
- 4317 rooms
- 3878 rooms
- 1699+ rooms

- Rooms in renter-occupied apartments in Green Tree, Pennsylvania
- 781 room
- 92 rooms
- 443 rooms
- 2074 rooms
- 935 rooms
- 1426 rooms
- 117 rooms
- 128 rooms
- 159+ rooms


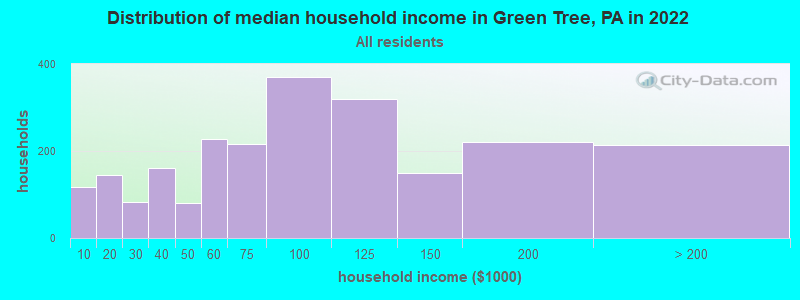
Green Tree, PA household income distribution

- 117Less than $10,000
- 145$10,000 to $19,999
- 83$20,000 to $29,999
- 161$30,000 to $39,999
- 80$40,000 to $49,999
- 227$50,000 to $59,999
- 215$60,000 to $74,999
- 371$75,000 to $99,999
- 319$100,000 to $124,999
- 149$125,000 to $149,999
- 221$150,000 to $199,999
- 213$200,000 or more
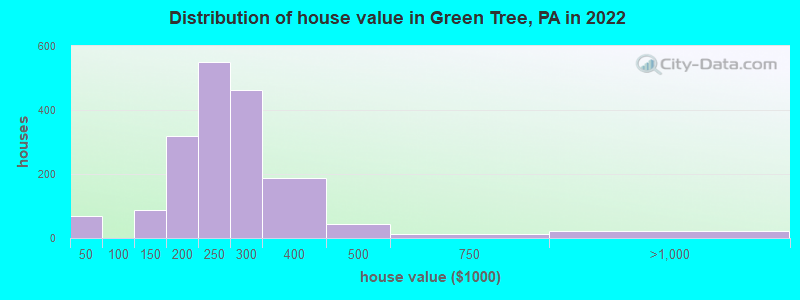
Home value of owner - occupied houses in 2022 in Green Tree, PA
-
- 4$15,000 to $19,999
- 43$20,000 to $24,999
- 21$25,000 to $29,999
- 53$100,000 to $124,999
- 31$125,000 to $149,999
- 157$150,000 to $174,999
- 160$175,000 to $199,999
- 550$200,000 to $249,999
- 462$250,000 to $299,999
- 188$300,000 to $399,999
- 43$400,000 to $499,999
- 12$500,000 to $749,999
- 11$750,000 to $999,999
- 8$1,000,000 to $1,499,999
Rent paid by renters in 2022 in Green Tree, PA
-
- 15$250 to $299
- 14$550 to $599
- 9$600 to $649
- 43$900 to $999
- 172$1,000 to $1,249
- 79$1,250 to $1,499
- 235$1,500 to $1,999
- 15$2,000 to $2,499
- 27No cash rent

Percentage of workers working in this county: 98.6%
Number of people working at home: 864 (29.7% of all workers)
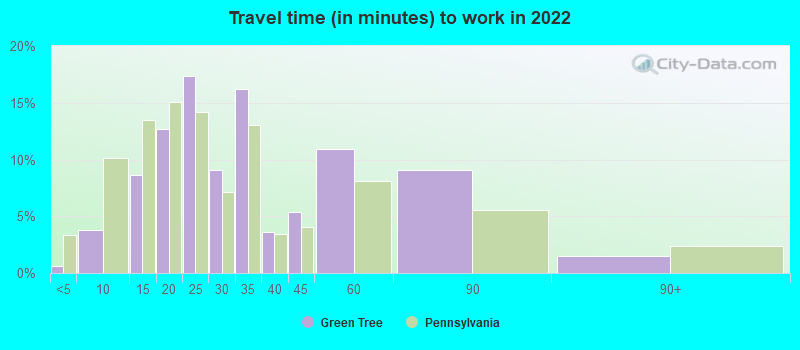
Travel time to work (commute)
- Less than 5 minutes: 53
- 5 to 9 minutes: 83
- 10 to 14 minutes: 372
- 15 to 19 minutes: 458
- 20 to 24 minutes: 378
- 25 to 29 minutes: 114
- 30 to 34 minutes: 393
- 35 to 39 minutes: 102
- 40 to 44 minutes: 85
- 45 to 59 minutes: 49
- 60 to 89 minutes: 19
- 90 or more minutes: 28
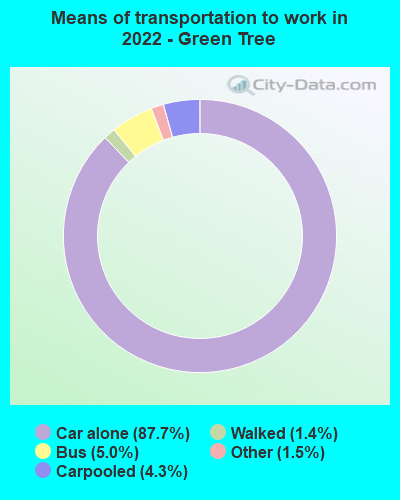
Means of transportation to work:
- Drove a car alone: 6,176 (77.6%)
- Carpooled: 294 (3.7%)
- Bus: 256 (3.2%)
- Taxi: 128 (1.6%)
- Walked: 107 (1.3%)
- Worked at home: 864 (10.9%)

- Year of entry for the foreign-born population in Green Tree, Pennsylvania
- 1382010 or later
- 512000 to 2009
- 821990 to 1999
- 251980 to 1989
- 211970 to 1979
- 115Before 1970

First ancestries reported:
- German: 416 (25.6%)
- Italian: 265 (16.3%)
- Irish: 147 (9.0%)
- Polish: 138 (8.5%)
- American: 112 (6.9%)
- Eastern European: 60 (3.7%)
- Yugoslavian: 50 (3.1%)
- Scottish: 38 (2.3%)
- European: 37 (2.3%)
- Greek: 28 (1.7%)
- English: 19 (1.2%)
- British: 12 (0.7%)
- Slovak: 11 (0.7%)
- Hungarian: 8 (0.5%)
Most common places of birth for foreign-born residents (%):
| Green Tree: | 36.1% (138) |
| Pennsylvania: | 10.7% (100,596) |
| Green Tree: | 15.2% (58) |
| Pennsylvania: | 0.3% (3,273) |
| Green Tree: | 9.9% (38) |
| Pennsylvania: | 1.8% (16,884) |
| Green Tree: | 7.3% (28) |
| Pennsylvania: | 7.2% (67,704) |
| Green Tree: | 6.8% (26) |
| Pennsylvania: | 5.8% (54,190) |
| Green Tree: | 5.0% (19) |
| Pennsylvania: | 2.2% (21,039) |
| Green Tree: | 3.7% (14) |
| Pennsylvania: | 0.6% (5,438) |
| Green Tree: | 1.6% (6) |
| Pennsylvania: | 0.5% (4,593) |
Place of birth for U.S.-born residents:
- This state: 3,864
- Other state: 586
- Northeast: 205
- Midwest: 217
- South: 157
- West: 8
90.7% of Green Tree residents lived in the same house 1 years ago.
Out of people who lived in different houses, 36.1% lived in this county.
Out of people who lived in different counties, 28.7% lived in Pennsylvania.
| Green Tree: | 90.7% |
| State average: | 89.3% |
Education attainment for males 25 years and older:
- No schooling: 0
- Nursery to 4th grade: 0
- 5th and 6th grade: 0
- 7th and 8th grade: 0
- 9th grade: 0
- 10th grade: 0
- 11th grade: 0
- 12th grade, no diploma: 11
- High school graduate (or equivalency): 333
- Less than 1 year of college: 53
- Some college more than 1 year, no degree: 304
- Associate degree: 90
- Bachelor's degree: 723
- Master's degree: 195
- Professional school degree: 0
- Doctorate degree: 26

Education attainment for females 25 years and older:
- No schooling: 0
- Nursery to 4th grade: 0
- 5th and 6th grade: 0
- 7th and 8th grade: 0
- 9th grade: 0
- 10th grade: 0
- 11th grade: 0
- 12th grade, no diploma: 41
- High school graduate (or equivalency): 409
- Less than 1 year of college: 199
- Some college more than 1 year, no degree: 325
- Associate degree: 223
- Bachelor's degree: 540
- Master's degree: 331
- Professional school degree: 46
- Doctorate degree: 11


Housing units in structures:
- One, detached: 1,934
- 3 or 4: 78
- 5 to 9: 26
- 10 to 19: 14
- 20 to 49: 126
- 50 or more: 290
House/condo owner moved in on average 17 years ago
Renter moved in on average 1 years ago

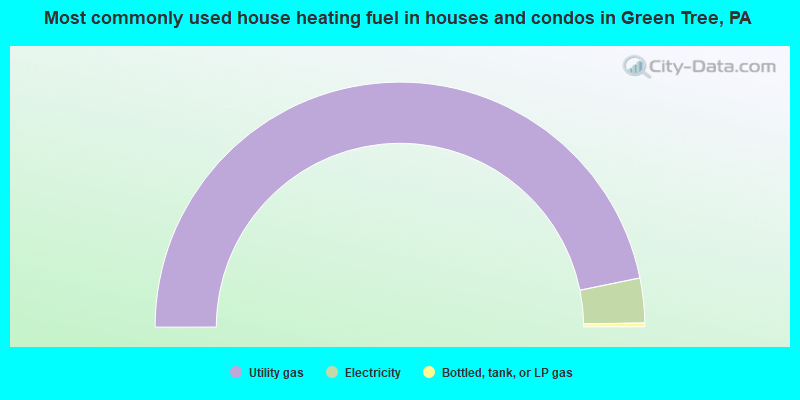
- 93.5%Utility gas
- 5.9%Electricity
- 0.5%Bottled, tank, or LP gas
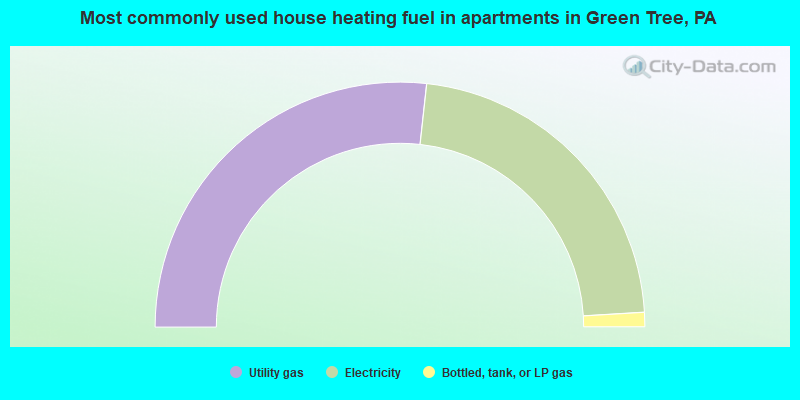
- 53.5%Utility gas
- 44.6%Electricity
- 1.9%Bottled, tank, or LP gas
Private vs. public school enrollment:
| Here: | 18.5% |
| Pennsylvania: | 15.7% |
| Here: | 14.9% |
| Pennsylvania: | 13.4% |
| Here: | 55.9% |
| Pennsylvania: | 39.8% |


