Green Pond, SC (South Carolina) Houses and Residents
| Green Pond: | $233,599 |
| South Carolina: | $254,600 |
Total population: 2,468 (Urban population: 0, Rural population: 2,417 (70 farm, 2,347 nonfarm))
Houses: 2,664 (1,002 occupied: 834 owner occupied, 168 renter occupied)
| % of renters here: | 17% |
| State: | 28% |
Housing density: 11 houses/condos per square mile
Median price asked for vacant for-sale houses and condos in 2022 in this county: $330,365.
Median contract rent in 2022: $951 (lower quartile is $992, upper quartile is $1,581)
Median rent asked for vacant for-rent units in 2022: $2,424
Median gross rent in Green Pond, SC in 2022: $1,239
Housing units in Green Pond with a mortgage: 276 (28 second mortgage, 34 home equity loan, 0 both second mortgage and home equity loan)
Houses without a mortgage: 219


Household type by relationship:
Households: 38,504- In family households: 33,052 (6,249 male householders, 4,200 female householders)
6,800 spouses, 11,214 children (10,236 natural, 304 adopted, 674 stepchildren), 1,802 grandchildren, 511 brothers or sisters, 306 parents, foster children, 727 other relatives, 1,020 non-relatives
- In nonfamily households: 5,452 (2,230 male householders (1,852 living alone)), 2,452 female householders (2,197 living alone)), 770 nonrelatives
- In group quarters: 388 (359 institutionalized population)
5,759 married couples with children.
2,923 single-parent households (511 men, 2,412 women).
95.1% of residents of Green Pond speak English at home.
2.0% of residents speak Spanish at home (87% speak English very well, 13% speak English well).
2.3% of residents speak other Indo-European language at home (89% speak English very well, 11% speak English not well).
0.6% of residents speak Asian or Pacific Island language at home (100% speak English very well).
Foreign born population: 65 (2.5%)
(104.6% of them are naturalized citizens)
| Here: | 6.2 |
| State: | 6.4 |
| Here: | 6.1 |
| State: | 4.5 |

- Bedrooms in owner-occupied houses and condos in Green Pond, South Carolina
- 0no bedroom
- 161 bedroom
- 1722 bedrooms
- 4443 bedrooms
- 1534 bedrooms
- 495+ bedrooms

- Bedrooms in renter-occupied apartments in Green Pond, South Carolina
- 0no bedroom
- 151 bedroom
- 542 bedrooms
- 753 bedrooms
- 194 bedrooms
- 55+ bedrooms

- Cars and other vehicles available in Green Pond in owner-occupied houses/condos
- 98no vehicle
- 1851 vehicle
- 4242 vehicles
- 1093 vehicles
- 134 vehicles
- 55+ vehicles

- Cars and other vehicles available in Green Pond in renter-occupied apartments
- 21no vehicle
- 871 vehicle
- 382 vehicles
- 223 vehicles
- 04 vehicles
- 05+ vehicles

- Rooms in owner-occupied houses in Green Pond, South Carolina
- 01 room
- 72 rooms
- 183 rooms
- 824 rooms
- 2255 rooms
- 2466 rooms
- 997 rooms
- 1138 rooms
- 449+ rooms

- Rooms in renter-occupied apartments in Green Pond, South Carolina
- 01 room
- 52 rooms
- 193 rooms
- 334 rooms
- 365 rooms
- 326 rooms
- 177 rooms
- 148 rooms
- 129+ rooms


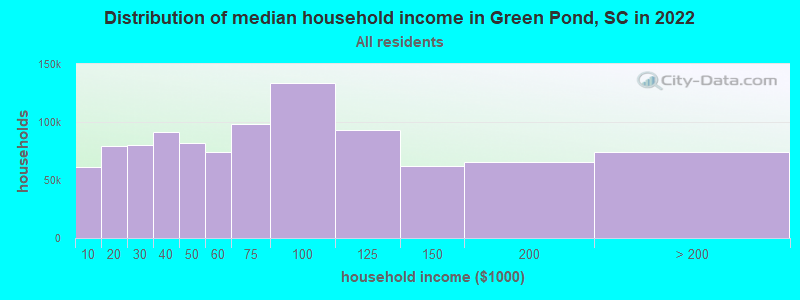
Green Pond, SC household income distribution

- 42,429Less than $10,000
- 64,904$10,000 to $19,999
- 56,776$20,000 to $29,999
- 63,042$30,000 to $39,999
- 58,192$40,000 to $49,999
- 45,450$50,000 to $59,999
- 60,604$60,000 to $74,999
- 80,325$75,000 to $99,999
- 56,680$100,000 to $124,999
- 35,508$125,000 to $149,999
- 35,323$150,000 to $199,999
- 34,824$200,000 or more
Percentage of workers working in this county: 56.2%
Number of people working at home: 69 (7.3% of all workers)
Travel time to work (commute)
- Less than 5 minutes: 40
- 5 to 9 minutes: 117
- 10 to 14 minutes: 64
- 15 to 19 minutes: 81
- 20 to 24 minutes: 95
- 25 to 29 minutes: 45
- 30 to 34 minutes: 162
- 35 to 39 minutes: 2
- 40 to 44 minutes: 36
- 45 to 59 minutes: 115
- 60 to 89 minutes: 103
- 90 or more minutes: 32
Means of transportation to work:
- Drove a car alone: 697 (75.7%)
- Carpooled: 155 (16.8%)
- Bicycle: 5 (0.5%)
- Walked: 20 (2.2%)
- Other means: 15 (1.6%)
- Worked at home: 29 (3.1%)


- Year of entry for the foreign-born population in Green Pond, South Carolina
- 01995 to March 2000
- 01990 to 1994
- 01985 to 1989
- 01980 to 1984
- 01975 to 1979
- 71970 to 1974
- 51965 to 1969
- 18Before 1965
Most common places of birth for foreign-born residents (%):
| Green Pond: | 26.7% (8) |
| South Carolina: | 0.7% (777) |
| Green Pond: | 23.3% (7) |
| South Carolina: | 0.8% (977) |
| Green Pond: | 16.7% (5) |
| South Carolina: | 0.6% (662) |
| Green Pond: | 13.3% (4) |
| South Carolina: | 0.8% (875) |
| Green Pond: | 6.7% (2) |
| South Carolina: | 6.8% (7,873) |
| Green Pond: | 6.7% (2) |
| South Carolina: | 0.2% (288) |
| Green Pond: | 6.7% (2) |
| South Carolina: | 4.8% (5,512) |
Place of birth for U.S.-born residents:
- This state: 1,623
- Other state: 740
- Northeast: 235
- Midwest: 119
- South: 369
- West: 17
60% of Green Pond residents lived in the same house 5 years ago.
Out of people who lived in different houses, 43% lived in this county.
Out of people who lived in different counties, 49% lived in South Carolina.
Education attainment for males 25 years and older:
- No schooling: 0
- Nursery to 4th grade: 6
- 5th and 6th grade: 9
- 7th and 8th grade: 16
- 9th grade: 21
- 10th grade: 23
- 11th grade: 49
- 12th grade, no diploma: 12
- High school graduate (or equivalency): 292
- Less than 1 year of college: 57
- Some college more than 1 year, no degree: 57
- Associate degree: 35
- Bachelor's degree: 126
- Master's degree: 56
- Professional school degree: 19
- Doctorate degree: 13

Education attainment for females 25 years and older:
- No schooling: 4
- Nursery to 4th grade: 19
- 5th and 6th grade: 10
- 7th and 8th grade: 54
- 9th grade: 17
- 10th grade: 30
- 11th grade: 62
- 12th grade, no diploma: 33
- High school graduate (or equivalency): 282
- Less than 1 year of college: 46
- Some college more than 1 year, no degree: 107
- Associate degree: 38
- Bachelor's degree: 144
- Master's degree: 48
- Professional school degree: 7
- Doctorate degree: 3


Housing units in structures:
- One, detached: 1,771
- One, attached: 105
- Two: 76
- 3 or 4: 65
- 5 to 9: 171
- 10 to 19: 50
- 50 or more: 71
- Mobile homes: 355
Median worth of mobile homes: $79,991
Housing units lacking complete kitchen facilities: 1.5%

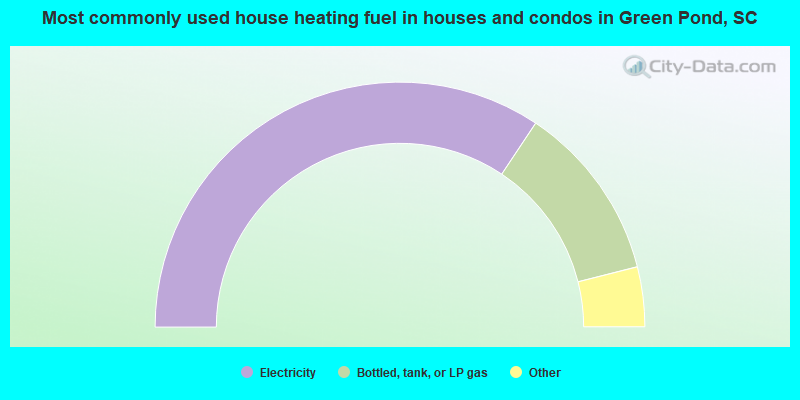
- 68.7%Electricity
- 23.4%Bottled, tank, or LP gas
- 3.2%Fuel oil, kerosene, etc.
- 2.2%Utility gas
- 1.7%Wood
- 0.8%Other fuel
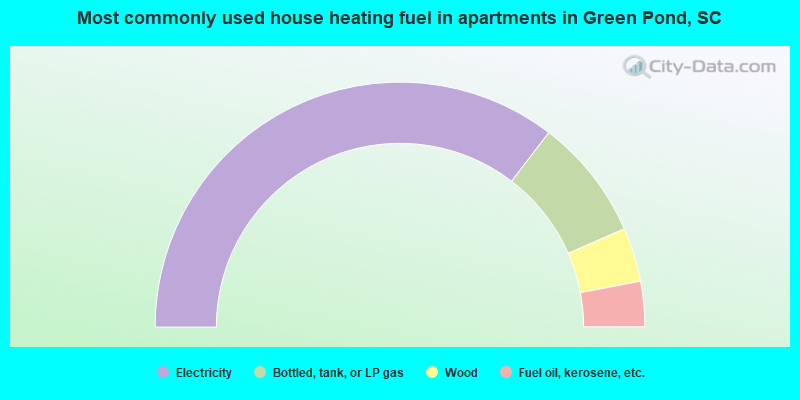
- 70.8%Electricity
- 16.1%Bottled, tank, or LP gas
- 7.1%Wood
- 6.0%Fuel oil, kerosene, etc.
Private vs. public school enrollment:
| Here: | 17.0% |
| South Carolina: | 9.2% |
| Here: | 11.5% |
| South Carolina: | 8.1% |
| Here: | 5.3% |
| South Carolina: | 20.3% |


