Greater Carrollwood, FL (Florida) Houses and Residents
| Greater Carrollwood: | $459,624 |
| Florida: | $354,100 |
Total population: 39,086 (Urban population: 33,617, Rural population: 0)
Houses: 14,525 (13,922 occupied: 9,768 owner occupied, 4,154 renter occupied)
| % of renters here: | 30% |
| State: | 33% |
Housing density: 1,518 houses/condos per square mile
Median price asked for vacant for-sale houses and condos in 2022 in this county: $333,299.
Median contract rent in 2022: $1,673 (lower quartile is $1,321, upper quartile is over $2,000)
Median rent asked for vacant for-rent units in 2022: $1,624
Median gross rent in Greater Carrollwood, FL in 2022: $1,808
Housing units in Greater Carrollwood with a mortgage: 7,130 (791 second mortgage, 786 home equity loan, 17 both second mortgage and home equity loan)
Houses without a mortgage: 1,556
Compare current foreclosures near Greater Carrollwood, FL:
| Photo | Address | Area | Beds / Baths | Price | Details |
|---|---|---|---|---|---|

|
#1
83rd Ave N Apt 120
Saint Petersburg, FL 33702
|
1,000 sq. feet
|
2 baths 2 beds |
$114,900
|
show details |

|
#2
Blue Magnolia Rd
Brandon, FL 33510
|
1,231 sq. feet
|
2 baths 2 beds |
$190,000
|
show details |

|
#3
Cactus Needle Ln
Wesley Chapel, FL 33544
|
1,576 sq. feet
|
2 baths 3 beds |
$295,000
|
show details |

|
#4
Venetian Harbor Dr NE
Saint Petersburg, FL 33702
|
2,044 sq. feet
|
2 baths 3 beds |
$483,600
|
show details |

|
#5
Oakridge Dr
Palm Harbor, FL 34685
|
2,344 sq. feet
|
2 baths 4 beds |
$690,000
|
show details |

|
#6
Us Highway 19 N Apt 19-C
Clearwater, FL 33764
|
- sq. feet
|
2 baths 2 beds |
$187,200
|
show details |

|
#7
Arena Pl
Tampa, FL 33612
|
1,445 sq. feet
|
2 baths 3 beds |
show details | |

|
#8
E Chelsea St
Tampa, FL 33603
|
1,231 sq. feet
|
1 baths 2 beds |
show details | |

|
#9
Sounding Shores Dr
Odessa, FL 33556
|
4,007 sq. feet
|
4 baths 5 beds |
show details | |

|
#10
Bayside Village Dr Apt 202
Tampa, FL 33615
|
936 sq. feet
|
1 baths 1 beds |
show details |
| Photo | Address | Area | Beds / Baths | Price | Details |
|---|---|---|---|---|---|

|
#11
E North Bay St
Tampa, FL 33603
|
832 sq. feet
|
1 baths 3 beds |
show details | |

|
#12
Berkeley Square Dr
Tampa, FL 33626
|
1,184 sq. feet
|
2 baths 2 beds |
show details | |

|
#13
Samuel Ivy Dr
Tampa, FL 33619
|
2,264 sq. feet
|
2 baths 5 beds |
show details | |

|
#14
N Ridgewood Ave
Tampa, FL 33602
|
1,666 sq. feet
|
2 baths 3 beds |
show details | |

|
#15
S Desoto St
Tampa, FL 33616
|
1,626 sq. feet
|
2 baths 3 beds |
show details | |

|
#16
Canterbury Lake Blvd
Tampa, FL 33619
|
2,470 sq. feet
|
2 baths 4 beds |
show details | |

|
#17
W Saint John St
Tampa, FL 33607
|
1,550 sq. feet
|
1 baths 3 beds |
show details | |

|
#18
E Giddens Ave
Tampa, FL 33610
|
1,448 sq. feet
|
2 baths 3 beds |
show details | |

|
#19
Palm Ave
Seffner, FL 33584
|
1,047 sq. feet
|
2 baths 3 beds |
show details | |

|
#20
Chellas Ct
Lutz, FL 33558
|
1,954 sq. feet
|
2 baths 4 beds |
show details |
| Photo | Address | Area | Beds / Baths | Price | Details |
|---|---|---|---|---|---|

|
#21
Reagan Ave
Seffner, FL 33584
|
1,125 sq. feet
|
2 baths 3 beds |
show details | |

|
#22
Middlecoff Dr
New Port Richey, FL 34655
|
1,820 sq. feet
|
2 baths 4 beds |
show details | |

|
#23
E Emily St
Tampa, FL 33603
|
2,161 sq. feet
|
2 baths 3 beds |
show details | |

|
#24
E Emily St
Tampa, FL 33603
|
4,117 sq. feet
|
2 baths 5 beds |
show details | |

|
#25
E North Bay St
Tampa, FL 33603
|
1,704 sq. feet
|
1 baths 2 beds |
show details | |

|
#26
E Lambright St
Tampa, FL 33610
|
1,008 sq. feet
|
1 baths 2 beds |
show details | |

|
#27
Globe Thistle Dr
Tampa, FL 33619
|
2,109 sq. feet
|
2 baths 4 beds |
show details | |

|
#28
Ronnie Gardens Ct
Tampa, FL 33619
|
2,415 sq. feet
|
2 baths 5 beds |
show details | |

|
#29
N Woodrow Ave
Tampa, FL 33602
|
1,502 sq. feet
|
1 baths 2 beds |
show details | |

|
#30
Ronnie Gardens Ct
Tampa, FL 33619
|
2,614 sq. feet
|
3 baths 6 beds |
show details |
| Photo | Address | Area | Beds / Baths | Price | Details |
|---|---|---|---|---|---|

|
#31
Delray Dr
Tampa, FL 33619
|
1,744 sq. feet
|
1 baths 4 beds |
show details | |

|
#32
Bermuda Isle Dr
Tampa, FL 33647
|
4,138 sq. feet
|
4 baths 5 beds |
show details | |

|
#33
Taft Ln
Seffner, FL 33584
|
1,448 sq. feet
|
2 baths 3 beds |
show details | |

|
#34
Wild Senna Blvd
Tampa, FL 33619
|
1,805 sq. feet
|
2 baths 4 beds |
show details | |

|
#35
Wild Senna Blvd
Tampa, FL 33619
|
2,949 sq. feet
|
2 baths 5 beds |
show details | |

|
#36
Lazy Oak Dr
Tampa, FL 33613
|
1,375 sq. feet
|
2 baths 2 beds |
show details | |

|
#37
Merry Oak Ave
Tampa, FL 33647
|
3,467 sq. feet
|
3 baths 4 beds |
show details | |
|
|
#38
S West Shore Blvd
Tampa, FL 33616
|
1,083 sq. feet
|
1 baths 3 beds |
show details | |

|
#39
Geraci Rd
Lutz, FL 33548
|
3,902 sq. feet
|
3 baths 3 beds |
show details | |

|
#40
Out Island Dr
Tampa, FL 33615
|
1,406 sq. feet
|
2 baths 3 beds |
show details |
| Photo | Address | Area | Beds / Baths | Price | Details |
|---|---|---|---|---|---|

|
#41
S Sparkman St
Tampa, FL 33616
|
1,257 sq. feet
|
2 baths 2 beds |
show details | |

|
#42
W Tampa Bay Blvd Apt I202
Tampa, FL 33607
|
1,440 sq. feet
|
2 baths 2 beds |
show details | |

|
#43
E Norfolk St
Tampa, FL 33610
|
1,159 sq. feet
|
1 baths 3 beds |
show details | |

|
#44
E Selma Ave
Tampa, FL 33603
|
1,060 sq. feet
|
2 baths 3 beds |
show details | |

|
#45
W Cordelia St
Tampa, FL 33607
|
1,104 sq. feet
|
1 baths 2 beds |
show details | |

|
#46
E Elm St
Tampa, FL 33610
|
1,472 sq. feet
|
2 baths 3 beds |
show details | |

|
#47
Flagstone Dr
Tampa, FL 33615
|
3,063 sq. feet
|
3 baths 4 beds |
show details | |

|
#48
Lori Ann St
Brandon, FL 33510
|
1,782 sq. feet
|
2 baths 3 beds |
show details | |

|
#49
E 97th Ave
Tampa, FL 33617
|
1,530 sq. feet
|
2 baths 2 beds |
show details | |

|
Check over 1 million property listings on Foreclosure.com!
|
browse all offers | |||

 | 120-150s houses? (43 replies) |
| house with mature trees (78 replies) |
| Average Market Price (10 replies) |
| Hillsborough more up and coming? (53 replies) |
| Safety of Temple Terrace (62 replies) |
| Talk to me about Lutz...(considering relocating) (16 replies) |

Household type by relationship:
Households: 1,207,161- In family households: 984,668 (196,832 male householders, 108,032 female householders)
209,741 spouses, 347,111 children (320,893 natural, 8,097 adopted, 18,121 stepchildren), 29,250 grandchildren, 14,341 brothers or sisters, 14,447 parents, foster children, 19,981 other relatives, 35,472 non-relatives
- In nonfamily households: 222,493 (81,133 male householders (58,180 living alone)), 88,033 female householders (70,370 living alone)), 53,327 nonrelatives
- In group quarters: 22,065 (7,929 institutionalized population)
152,649 married couples with children.
69,941 single-parent households (14,273 men, 55,668 women).
76.2% of residents of Greater Carrollwood speak English at home.
16.2% of residents speak Spanish at home (69% speak English very well, 17% speak English well, 9% speak English not well, 5% don't speak English at all).
4.7% of residents speak other Indo-European language at home (66% speak English very well, 23% speak English well, 11% speak English not well, 1% don't speak English at all).
2.5% of residents speak Asian or Pacific Island language at home (53% speak English very well, 22% speak English well, 15% speak English not well, 10% don't speak English at all).
0.4% of residents speak other language at home (57% speak English very well, 36% speak English well, 7% don't speak English at all).
Foreign born population: 11,927 (23.4%)
(60.6% of them are naturalized citizens)
| Here: | 6.2 |
| State: | 5.9 |
| Here: | 4.1 |
| State: | 4.2 |

- Bedrooms in owner-occupied houses and condos in Greater Carrollwood, Florida
- 68no bedroom
- 3741 bedroom
- 1,7292 bedrooms
- 4,3243 bedrooms
- 2,8004 bedrooms
- 4735+ bedrooms

- Bedrooms in renter-occupied apartments in Greater Carrollwood, Florida
- 382no bedroom
- 1,5521 bedroom
- 1,4582 bedrooms
- 6753 bedrooms
- 584 bedrooms
- 295+ bedrooms

- Cars and other vehicles available in Greater Carrollwood in owner-occupied houses/condos
- 244no vehicle
- 2,8121 vehicle
- 5,2002 vehicles
- 1,2983 vehicles
- 1544 vehicles
- 605+ vehicles

- Cars and other vehicles available in Greater Carrollwood in renter-occupied apartments
- 323no vehicle
- 2,3201 vehicle
- 1,2962 vehicles
- 2013 vehicles
- 144 vehicles
- 05+ vehicles

- Rooms in owner-occupied houses in Greater Carrollwood, Florida
- 191 room
- 902 rooms
- 6153 rooms
- 7544 rooms
- 1,7465 rooms
- 2,0126 rooms
- 1,8157 rooms
- 1,5888 rooms
- 1,1299+ rooms

- Rooms in renter-occupied apartments in Greater Carrollwood, Florida
- 3741 room
- 4522 rooms
- 8823 rooms
- 1,2404 rooms
- 6985 rooms
- 3006 rooms
- 1017 rooms
- 908 rooms
- 179+ rooms


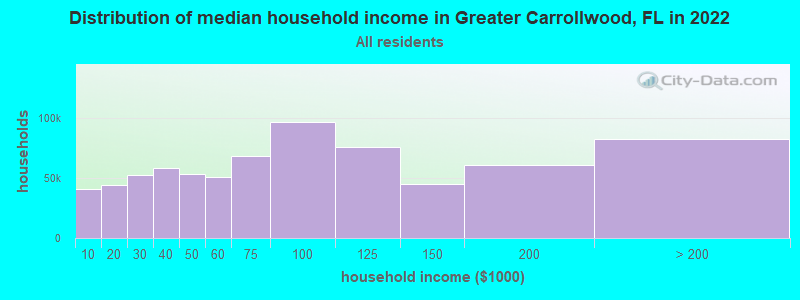
Greater Carrollwood, FL household income distribution

- 40,505Less than $10,000
- 44,372$10,000 to $19,999
- 52,248$20,000 to $29,999
- 58,068$30,000 to $39,999
- 52,967$40,000 to $49,999
- 50,825$50,000 to $59,999
- 68,264$60,000 to $74,999
- 96,698$75,000 to $99,999
- 75,644$100,000 to $124,999
- 45,258$125,000 to $149,999
- 61,176$150,000 to $199,999
- 82,564$200,000 or more
Percentage of workers working in this county: 89.5%
Number of people working at home: 6,272 (21.4% of all workers)
Travel time to work (commute)
- Less than 5 minutes: 250
- 5 to 9 minutes: 1,292
- 10 to 14 minutes: 1,802
- 15 to 19 minutes: 2,623
- 20 to 24 minutes: 3,229
- 25 to 29 minutes: 1,322
- 30 to 34 minutes: 3,418
- 35 to 39 minutes: 539
- 40 to 44 minutes: 846
- 45 to 59 minutes: 1,440
- 60 to 89 minutes: 508
- 90 or more minutes: 202
Means of transportation to work:
- Drove a car alone: 14,934 (82.9%)
- Carpooled: 2,053 (11.4%)
- Bus or trolley bus: 94 (0.5%)
- Taxi: 9 (0.0%)
- Motorcycle: 17 (0.1%)
- Bicycle: 45 (0.2%)
- Walked: 182 (1.0%)
- Other means: 137 (0.8%)
- Worked at home: 537 (3.0%)


- Year of entry for the foreign-born population in Greater Carrollwood, Florida
- 1,2231995 to March 2000
- 5851990 to 1994
- 7031985 to 1989
- 4921980 to 1984
- 5031975 to 1979
- 2251970 to 1974
- 2861965 to 1969
- 533Before 1965
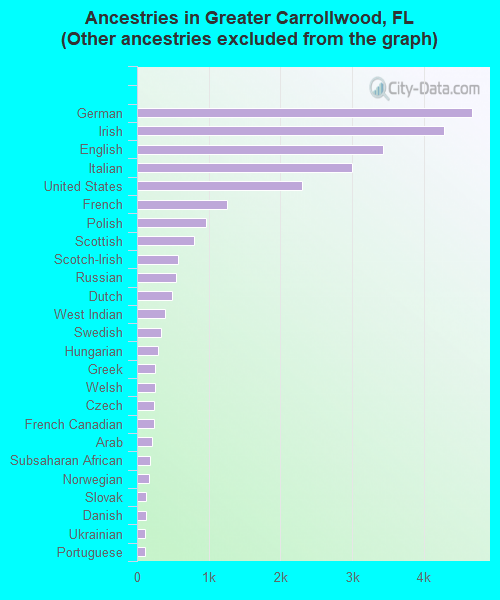
First ancestries reported:
- Other: 11,771 (31.7%)
- German: 4,675 (12.6%)
- Irish: 4,281 (11.5%)
- English: 3,432 (9.2%)
- Italian: 2,992 (8.0%)
- United States: 2,306 (6.2%)
- French: 1,252 (3.4%)
- Polish: 962 (2.6%)
- Scottish: 798 (2.1%)
- Scotch-Irish: 565 (1.5%)
- Russian: 543 (1.5%)
- Dutch: 493 (1.3%)
- West Indian: 390 (1.0%)
- Swedish: 340 (0.9%)
- Hungarian: 299 (0.8%)
- Greek: 256 (0.7%)
- Welsh: 254 (0.7%)
- Czech: 242 (0.7%)
- French Canadian: 231 (0.6%)
- Arab: 205 (0.6%)
- Subsaharan African: 185 (0.5%)
- Norwegian: 167 (0.4%)
- Slovak: 124 (0.3%)
- Danish: 123 (0.3%)
- Ukrainian: 116 (0.3%)
- Portuguese: 111 (0.3%)
- Lithuanian: 45 (0.1%)
- Swiss: 25 (0.07%)
Most common places of birth for foreign-born residents (%):
| Greater Carrollwood: | 12.9% (587) |
| Florida: | 5.9% (157,371) |
| Greater Carrollwood: | 12.2% (556) |
| Florida: | 24.1% (642,951) |
| Greater Carrollwood: | 6.4% (292) |
| Florida: | 1.1% (28,790) |
| Greater Carrollwood: | 4.4% (198) |
| Florida: | 1.1% (29,046) |
| Greater Carrollwood: | 4.3% (194) |
| Florida: | 1.2% (32,295) |
| Greater Carrollwood: | 3.1% (141) |
| Florida: | 5.3% (141,182) |
| Greater Carrollwood: | 3.0% (136) |
| Florida: | 7.1% (189,119) |
| Greater Carrollwood: | 3.0% (136) |
| Florida: | 1.8% (47,351) |
| Greater Carrollwood: | 2.7% (122) |
| Florida: | 1.6% (43,422) |
| Greater Carrollwood: | 2.6% (118) |
| Florida: | 0.6% (14,860) |
| Greater Carrollwood: | 2.3% (103) |
| Florida: | 2.4% (64,088) |
| Greater Carrollwood: | 2.2% (102) |
| Florida: | 1.7% (44,536) |
| Greater Carrollwood: | 2.2% (100) |
| Florida: | 3.7% (99,139) |
| Greater Carrollwood: | 2.2% (98) |
| Florida: | 0.7% (17,732) |
| Greater Carrollwood: | 2.1% (96) |
| Florida: | 2.5% (66,690) |
| Greater Carrollwood: | 2.1% (95) |
| Florida: | 2.6% (70,384) |
| Greater Carrollwood: | 2.0% (90) |
| Florida: | 1.1% (28,788) |
| Greater Carrollwood: | 1.9% (86) |
| Florida: | 0.2% (6,651) |
| Greater Carrollwood: | 1.8% (84) |
| Florida: | 1.2% (31,508) |
| Greater Carrollwood: | 1.8% (80) |
| Florida: | 0.7% (18,153) |
| Greater Carrollwood: | 1.5% (69) |
| Florida: | 2.0% (53,939) |
Place of birth for U.S.-born residents:
- This state: 10,840
- Other state: 16,635
- Northeast: 5,863
- Midwest: 4,929
- South: 4,962
- West: 881
50% of Greater Carrollwood residents lived in the same house 5 years ago.
Out of people who lived in different houses, 62% lived in this county.
Out of people who lived in different counties, 31% lived in Florida.
Education attainment for males 25 years and older:
- No schooling: 94
- Nursery to 4th grade: 12
- 5th and 6th grade: 68
- 7th and 8th grade: 101
- 9th grade: 91
- 10th grade: 84
- 11th grade: 95
- 12th grade, no diploma: 294
- High school graduate (or equivalency): 1,601
- Less than 1 year of college: 712
- Some college more than 1 year, no degree: 1,772
- Associate degree: 726
- Bachelor's degree: 2,943
- Master's degree: 875
- Professional school degree: 833
- Doctorate degree: 244

Education attainment for females 25 years and older:
- No schooling: 140
- Nursery to 4th grade: 32
- 5th and 6th grade: 82
- 7th and 8th grade: 117
- 9th grade: 92
- 10th grade: 149
- 11th grade: 186
- 12th grade, no diploma: 251
- High school graduate (or equivalency): 2,665
- Less than 1 year of college: 831
- Some college more than 1 year, no degree: 2,132
- Associate degree: 1,057
- Bachelor's degree: 3,437
- Master's degree: 981
- Professional school degree: 342
- Doctorate degree: 143


Housing units in structures:
- One, detached: 8,219
- One, attached: 1,935
- Two: 158
- 3 or 4: 530
- 5 to 9: 1,278
- 10 to 19: 1,020
- 20 to 49: 393
- 50 or more: 683
- Mobile homes: 309
Median worth of mobile homes: $125,886
Housing units lacking complete kitchen facilities: 0.3%

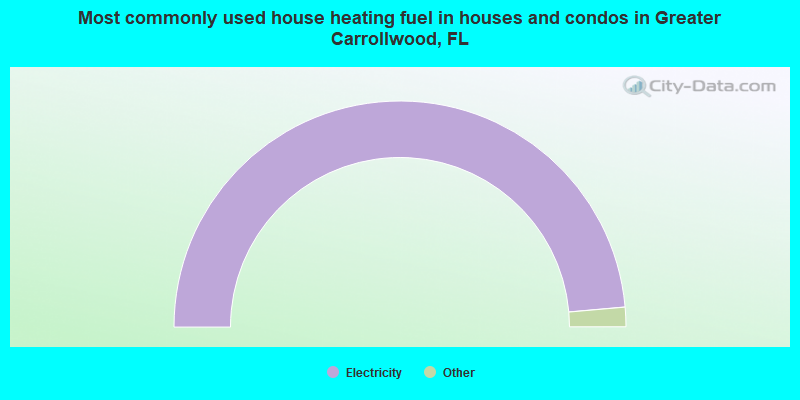
- 97.2%Electricity
- 1.3%Utility gas
- 0.6%No fuel used
- 0.4%Fuel oil, kerosene, etc.
- 0.3%Bottled, tank, or LP gas
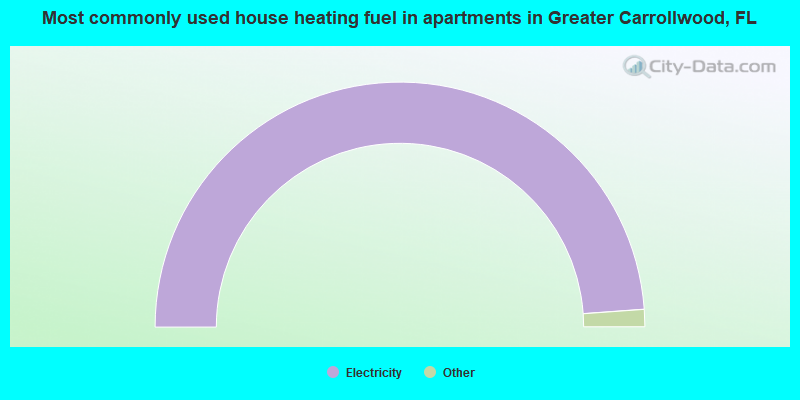
- 97.7%Electricity
- 1.1%Utility gas
- 1.0%No fuel used
- 0.2%Bottled, tank, or LP gas
Private vs. public school enrollment:
| Here: | 27.7% |
| Florida: | 11.7% |
| Here: | 22.3% |
| Florida: | 9.7% |
| Here: | 17.7% |
| Florida: | 21.0% |


