Gibbsboro, NJ (New Jersey) Houses and Residents
| Gibbsboro: | $297,722 |
| New Jersey: | $428,900 |
Total population: 2,240 (All urban)
Houses: 835 (786 occupied: 728 owner occupied, 72 renter occupied)
| % of renters here: | 9% |
| State: | 35% |
Housing density: 380 houses/condos per square mile
Median price asked for vacant for-sale houses and condos in 2022: $251,977.
Median gross rent in Gibbsboro, NJ in 2022: $-668,776,370
Housing units in Gibbsboro with a mortgage: 478 (19 second mortgage, 0 home equity loan, 19 both second mortgage and home equity loan)
Houses without a mortgage: 35
Median household income for houses/condos with a mortgage: $110,779
Median household income for apartments without a mortgage: $73,726
Median monthly housing costs: $1,866
Compare current foreclosures near Gibbsboro, NJ:
| Photo | Address | Area | Beds / Baths | Price | Details |
|---|---|---|---|---|---|

|
#1
Norcross Rd
Gibbsboro, NJ 08026
|
- sq. feet
|
2 baths 3 beds |
show details | |

|
#2
Eastwick Dr
Gibbsboro, NJ 08026
|
2,328 sq. feet
|
- baths - beds |
show details | |

|
#3
Kingsbridge Rd
Gibbsboro, NJ 08026
|
1,474 sq. feet
|
- baths - beds |
show details | |

|
#4
Holly Rd
Gibbsboro, NJ 08026
|
1,924 sq. feet
|
- baths - beds |
show details | |

|
#5
W Trace Dr
Gibbsboro, NJ 08026
|
1,678 sq. feet
|
- baths - beds |
show details | |

|
#6
N Front St Apt B
Philadelphia, PA 19123
|
2,491 sq. feet
|
2 baths 3 beds |
$599,900
|
show details |

|
#7
Yeadon Ave
Lansdowne, PA 19050
|
1,388 sq. feet
|
1 baths 3 beds |
$268,500
|
show details |

|
#8
N Hicks St
Philadelphia, PA 19132
|
970 sq. feet
|
1 baths 3 beds |
$62,900
|
show details |

|
#9
Browning Rd
Merchantville, NJ 08109
|
2,376 sq. feet
|
3 baths 5 beds |
$459,900
|
show details |

|
#10
N Main St
Williamstown, NJ 08094
|
1,077 sq. feet
|
1 baths 2 beds |
$194,900
|
show details |
| Photo | Address | Area | Beds / Baths | Price | Details |
|---|---|---|---|---|---|

|
#11
Christian St
Philadelphia, PA 19146
|
1,612 sq. feet
|
2 baths 5 beds |
$449,900
|
show details |

|
#12
Harvey Ave
Pennsauken, NJ 08110
|
1,555 sq. feet
|
2 baths 4 beds |
$405,000
|
show details |

|
#13
Harmer St
Philadelphia, PA 19131
|
1,134 sq. feet
|
1 baths 3 beds |
$70,000
|
show details |

|
#14
Wood View Dr
Mount Laurel, NJ 08054
|
6,942 sq. feet
|
2 baths 4 beds |
$510,000
|
show details |

|
#15
Foxglove Dr
Riverside, NJ 08075
|
840 sq. feet
|
1 baths 2 beds |
$113,683
|
show details |

|
#16
Manor Ln
Willingboro, NJ 08046
|
1,576 sq. feet
|
2 baths 3 beds |
$390,000
|
show details |

|
#17
Jessamine Ave
Oaklyn, NJ 08107
|
864 sq. feet
|
2 baths 5 beds |
$379,900
|
show details |

|
#18
Edgewood Ave
Audubon, NJ 08106
|
1,250 sq. feet
|
1 baths 4 beds |
$340,000
|
show details |

|
#19
Kershaw St
Philadelphia, PA 19131
|
1,284 sq. feet
|
1 baths 3 beds |
$134,500
|
show details |

|
#20
Threadleaf Ter
Burlington, NJ 08016
|
2,688 sq. feet
|
2 baths 3 beds |
$470,000
|
show details |
| Photo | Address | Area | Beds / Baths | Price | Details |
|---|---|---|---|---|---|

|
#21
Fries Mill Rd
Franklinville, NJ 08322
|
2,266 sq. feet
|
2 baths 3 beds |
$379,900
|
show details |

|
#22
N Marshall St
Philadelphia, PA 19122
|
1,769 sq. feet
|
2 baths 3 beds |
$414,500
|
show details |

|
#23
Covered Bridge Rd
Cherry Hill, NJ 08034
|
1,343 sq. feet
|
1 baths 3 beds |
$445,000
|
show details |

|
#24
Eastwick Dr
Gibbsboro, NJ 08026
|
- sq. feet
|
- baths - beds |
show details | |

|
#25
Clementon Rd W
Gibbsboro, NJ 08026
|
- sq. feet
|
- baths - beds |
show details | |

|
#26
West Rd
Gibbsboro, NJ 08026
|
- sq. feet
|
- baths - beds |
show details | |

|
#27
Chatham Rd
Gibbsboro, NJ 08026
|
- sq. feet
|
- baths - beds |
show details | |

|
#28
Eastwick Dr
Gibbsboro, NJ 08026
|
- sq. feet
|
- baths - beds |
show details | |

|
#29
S 19th St
Philadelphia, PA 19145
|
1,180 sq. feet
|
1 baths 3 beds |
$3,100
|
show details |

|
#30
Daly St
Philadelphia, PA 19148
|
840 sq. feet
|
1 baths 3 beds |
$187,620
|
show details |
| Photo | Address | Area | Beds / Baths | Price | Details |
|---|---|---|---|---|---|

|
#31
Reed St
Philadelphia, PA 19147
|
1,560 sq. feet
|
1 baths 4 beds |
$1
|
show details |

|
#32
N Etting St
Philadelphia, PA 19121
|
840 sq. feet
|
1 baths 3 beds |
$3,100
|
show details |

|
#33
S Bonsall Street
Philadelphia, PA 19146
|
1,209 sq. feet
|
1 baths 3 beds |
$1
|
show details |

|
#34
S 16th St
Philadelphia, PA 19145
|
1,080 sq. feet
|
1 baths 3 beds |
$1
|
show details |

|
#35
N Newkirk St
Philadelphia, PA 19121
|
1,050 sq. feet
|
1 baths 3 beds |
$3,100
|
show details |

|
#36
E Firth St
Philadelphia, PA 19125
|
820 sq. feet
|
1 baths 3 beds |
$1
|
show details |

|
#37
Chester Ave
Philadelphia, PA 19142
|
1,536 sq. feet
|
1 baths 4 beds |
$1
|
show details |

|
#38
W Zeralda St
Philadelphia, PA 19144
|
1,536 sq. feet
|
1 baths 4 beds |
$281,590
|
show details |

|
#39
Redner St
Philadelphia, PA 19121
|
1,014 sq. feet
|
1 baths 3 beds |
$3,100
|
show details |

|
#40
Spruce St
Philadelphia, PA 19139
|
1,420 sq. feet
|
1 baths 3 beds |
$3,100
|
show details |
| Photo | Address | Area | Beds / Baths | Price | Details |
|---|---|---|---|---|---|

|
#41
N Bancroft St
Philadelphia, PA 19140
|
932 sq. feet
|
1 baths 3 beds |
$1
|
show details |

|
#42
Greenwich St
Philadelphia, PA 19147
|
884 sq. feet
|
1 baths 3 beds |
$1
|
show details |

|
#43
S Ithan St
Philadelphia, PA 19143
|
848 sq. feet
|
1 baths 3 beds |
$30,797
|
show details |

|
#44
Dillman St
Philadelphia, PA 19140
|
728 sq. feet
|
1 baths 2 beds |
$1
|
show details |

|
#45
W Nedro Ave
Philadelphia, PA 19120
|
1,152 sq. feet
|
1 baths 3 beds |
$3,100
|
show details |

|
#46
Buist Ave
Philadelphia, PA 19153
|
1,360 sq. feet
|
1 baths 3 beds |
$228,818
|
show details |

|
#47
N 15th St
Philadelphia, PA 19141
|
1,280 sq. feet
|
1 baths 3 beds |
$71,287
|
show details |

|
#48
N Franklin St
Philadelphia, PA 19133
|
1,036 sq. feet
|
1 baths 3 beds |
$1
|
show details |

|
#49
Harlan St
Philadelphia, PA 19131
|
1,030 sq. feet
|
1 baths 3 beds |
$225,840
|
show details |

|
Check over 1 million property listings on Foreclosure.com!
|
browse all offers | |||

Latest news about housing in Gibbsboro, NJ collected exclusively by city-data.com from local newspapers, TV, and radio stations

 | How is Gibbsboro,NJ to buy home? (6 replies) |
| Family friendly towns in Camden County / Burlington County, with good amenities? (5 replies) |
| Drug use in Cherry Hill or Voorhees public school? (4 replies) |
| Advice on West Deptford (2 replies) |
| possibly working in Berlin, NJ - where to buy house? (10 replies) |
| I am looking for an apartment complex in Camden County (6 replies) |

Median year apartment built: 1987
Household type by relationship:
Households: 2,288- Male householders: 466 (66 living alone), Female householders: 319 (76 living alone)
440 spouses (440 opposite-sex spouses), 54 unmarried partners, (54 opposite-sex unmarried partners), 774 children (743 natural, 17 adopted, 14 stepchildren), 104 grandchildren, 15 brothers or sisters, 59 parents, 0 foster children, 28 other relatives, 21 non-relatives
- In group quarters: 5
Size of family households: 253 2-persons, 150 3-persons, 109 4-persons, 50 5-persons, 16 6-persons, 33 7-or-more-persons.
Size of nonfamily households: 144 1-person, 43 2-persons.
336 married couples with children.
104 single-parent households (23 men, 81 women).
88.4% of residents of Gibbsboro speak English at home.
2.7% of residents speak Spanish at home (66% speak English very well, 34% speak English not well).
3.9% of residents speak other Indo-European language at home (89% speak English very well, 11% speak English not well).
1.6% of residents speak Asian or Pacific Island language at home (29% speak English very well, 23% speak English well, 49% speak English not well).
1.7% of residents speak other language at home (57% speak English very well, 27% speak English well, 16% speak English not well).
Foreign born population: 154 (6.7%)
(61.7% of them are naturalized citizens)
| Here: | 7.3 |
| State: | 6.8 |
| Here: | 1.5 |
| State: | 3.9 |

- Bedrooms in owner-occupied houses and condos in Gibbsboro, New Jersey
- 0no bedroom
- 01 bedroom
- 522 bedrooms
- 4413 bedrooms
- 1744 bedrooms
- 605+ bedrooms

- Bedrooms in renter-occupied apartments in Gibbsboro, New Jersey
- 38no bedroom
- 01 bedroom
- 72 bedrooms
- 203 bedrooms
- 74 bedrooms
- 05+ bedrooms

- Cars and other vehicles available in Gibbsboro in owner-occupied houses/condos
- 8no vehicle
- 1691 vehicle
- 3512 vehicles
- 1383 vehicles
- 554 vehicles
- 65+ vehicles

- Cars and other vehicles available in Gibbsboro in renter-occupied apartments
- 38no vehicle
- 101 vehicle
- 182 vehicles
- 23 vehicles
- 44 vehicles
- 05+ vehicles

- Rooms in owner-occupied houses in Gibbsboro, New Jersey
- 01 room
- 02 rooms
- 03 rooms
- 234 rooms
- 1035 rooms
- 1336 rooms
- 1267 rooms
- 1148 rooms
- 2299+ rooms

- Rooms in renter-occupied apartments in Gibbsboro, New Jersey
- 381 room
- 02 rooms
- 03 rooms
- 74 rooms
- 75 rooms
- 26 rooms
- 07 rooms
- 98 rooms
- 99+ rooms


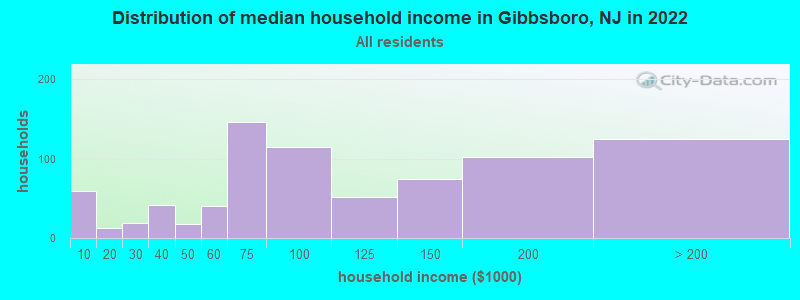
Gibbsboro, NJ household income distribution

- 59Less than $10,000
- 12$10,000 to $19,999
- 19$20,000 to $29,999
- 41$30,000 to $39,999
- 18$40,000 to $49,999
- 40$50,000 to $59,999
- 146$60,000 to $74,999
- 114$75,000 to $99,999
- 52$100,000 to $124,999
- 74$125,000 to $149,999
- 102$150,000 to $199,999
- 125$200,000 or more
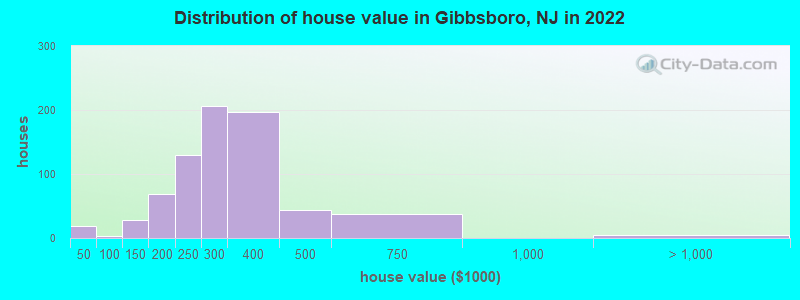
Home value of owner - occupied houses in 2022 in Gibbsboro, NJ
-
- 3Less than $10,000
- 14$25,000 to $29,999
- 2$80,000 to $89,999
- 11$100,000 to $124,999
- 16$125,000 to $149,999
- 41$150,000 to $174,999
- 26$175,000 to $199,999
- 130$200,000 to $249,999
- 206$250,000 to $299,999
- 196$300,000 to $399,999
- 43$400,000 to $499,999
- 37$500,000 to $749,999
- 5$1,000,000 to $1,499,999
Rent paid by renters in 2022 in Gibbsboro, NJ
-
- 21$150 to $199
- 1$900 to $999
- 16$1,000 to $1,249
- 1$1,250 to $1,499
- 4$1,500 to $1,999
- 1$2,000 to $2,499
- 7No cash rent


Percentage of workers working in this county: 66.3%
Number of people working at home: 139 (15.4% of all workers)
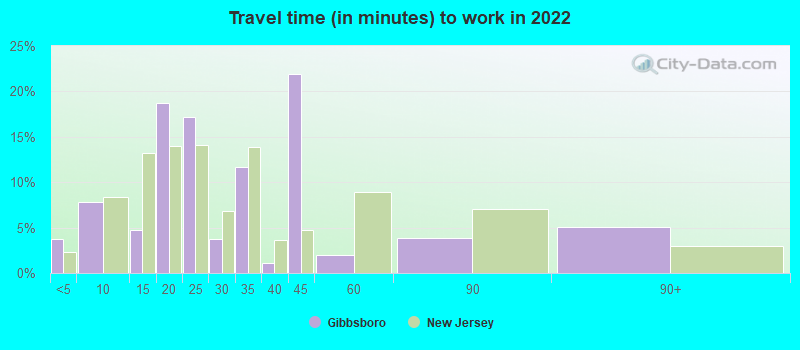
Travel time to work (commute)
- Less than 5 minutes: 4
- 5 to 9 minutes: 108
- 10 to 14 minutes: 61
- 15 to 19 minutes: 77
- 20 to 24 minutes: 99
- 25 to 29 minutes: 53
- 30 to 34 minutes: 113
- 35 to 39 minutes: 53
- 40 to 44 minutes: 17
- 45 to 59 minutes: 108
- 60 to 89 minutes: 57
- 90 or more minutes: 19
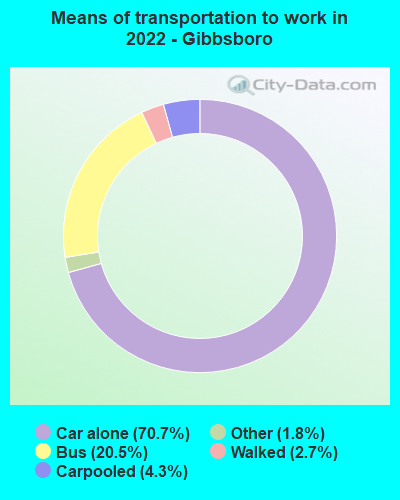
Means of transportation to work:
- Drove a car alone: 910 (59.9%)
- Carpooled: 73 (4.8%)
- Bus: 327 (21.5%)
- Taxi: 34 (2.2%)
- Walked: 49 (3.2%)
- Worked at home: 139 (9.2%)

- Unemployment by race in 2022
- Unemployment rate for White non-Hispanic residents
- 5.2%Males
- 7.9%Females
- Unemployment rate for Asian residents
- 47.4%Males
- Unemployment rate for Hispanic or Latino residents
- 31.3%Females

- Year of entry for the foreign-born population in Gibbsboro, New Jersey
- 552010 or later
- 252000 to 2009
- 591990 to 1999
- 251980 to 1989
- 41970 to 1979
- 39Before 1970
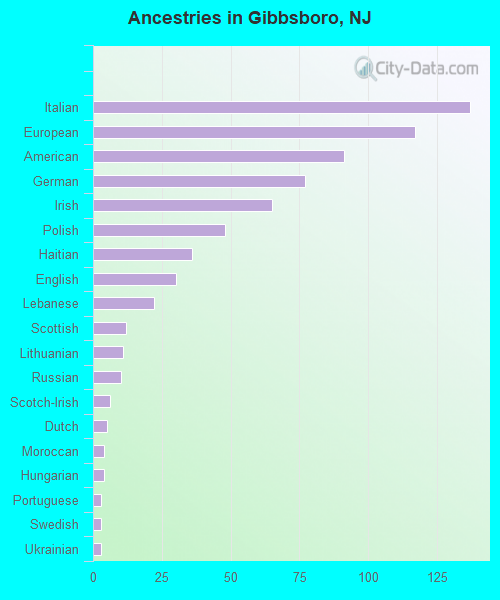
First ancestries reported:
- Italian: 137 (17.5%)
- European: 117 (14.9%)
- American: 91 (11.6%)
- German: 77 (9.8%)
- Irish: 65 (8.3%)
- Polish: 48 (6.1%)
- Haitian: 36 (4.6%)
- English: 30 (3.8%)
- Lebanese: 22 (2.8%)
- Scottish: 12 (1.5%)
- Lithuanian: 11 (1.4%)
- Russian: 10 (1.3%)
- Scotch-Irish: 6 (0.8%)
- Dutch: 5 (0.6%)
- Moroccan: 4 (0.5%)
- Hungarian: 4 (0.5%)
- Portuguese: 3 (0.4%)
- Swedish: 3 (0.4%)
- Ukrainian: 3 (0.4%)
Most common places of birth for foreign-born residents (%):
| Gibbsboro: | 21.2% (32) |
| New Jersey: | 4.0% (85,934) |
| Gibbsboro: | 15.2% (23) |
| New Jersey: | 0.2% (4,324) |
| Gibbsboro: | 13.9% (21) |
| New Jersey: | 12.8% (274,609) |
| Gibbsboro: | 6.6% (10) |
| New Jersey: | 0.3% (5,500) |
| Gibbsboro: | 6.0% (9) |
| New Jersey: | 0.1% (1,311) |
| Gibbsboro: | 5.3% (8) |
| New Jersey: | 3.7% (78,969) |
| Gibbsboro: | 5.3% (8) |
| New Jersey: | 0.5% (10,886) |
| Gibbsboro: | 4.6% (7) |
| New Jersey: | 9.7% (209,055) |
| Gibbsboro: | 4.0% (6) |
| New Jersey: | 2.2% (47,365) |
| Gibbsboro: | 3.3% (5) |
| New Jersey: | 0.8% (17,217) |
| Gibbsboro: | 2.6% (4) |
| New Jersey: | 0.5% (10,975) |
| Gibbsboro: | 2.6% (4) |
| New Jersey: | 2.3% (48,811) |
| Gibbsboro: | 2.6% (4) |
| New Jersey: | 0.3% (5,621) |
| Gibbsboro: | 2.0% (3) |
| New Jersey: | 4.8% (102,527) |
| Gibbsboro: | 2.0% (3) |
| New Jersey: | 4.2% (90,817) |
Place of birth for U.S.-born residents:
- This state: 1,249
- Other state: 828
- Northeast: 628
- Midwest: 81
- South: 103
- West: 17
87.3% of Gibbsboro residents lived in the same house 1 years ago.
Out of people who lived in different houses, 33.4% lived in this county.
Out of people who lived in different counties, 9.5% lived in New Jersey.
| Gibbsboro: | 87.3% |
| State average: | 90.4% |
Education attainment for males 25 years and older:
- No schooling: 9
- Nursery to 4th grade: 0
- 5th and 6th grade: 0
- 7th and 8th grade: 5
- 9th grade: 5
- 10th grade: 2
- 11th grade: 11
- 12th grade, no diploma: 11
- High school graduate (or equivalency): 355
- Less than 1 year of college: 41
- Some college more than 1 year, no degree: 100
- Associate degree: 67
- Bachelor's degree: 152
- Master's degree: 31
- Professional school degree: 11
- Doctorate degree: 11

Education attainment for females 25 years and older:
- No schooling: 8
- Nursery to 4th grade: 4
- 5th and 6th grade: 3
- 7th and 8th grade: 5
- 9th grade: 11
- 10th grade: 10
- 11th grade: 11
- 12th grade, no diploma: 4
- High school graduate (or equivalency): 268
- Less than 1 year of college: 81
- Some college more than 1 year, no degree: 81
- Associate degree: 34
- Bachelor's degree: 138
- Master's degree: 86
- Professional school degree: 9
- Doctorate degree: 3


Housing units in structures:
- One, detached: 786
- One, attached: 3
- Two: 2
- 5 to 9: 6
- 20 to 49: 37
Housing units lacking complete kitchen facilities in 2022: 1.8%
House/condo owner moved in on average 23 years ago
Renter moved in on average 0 years ago

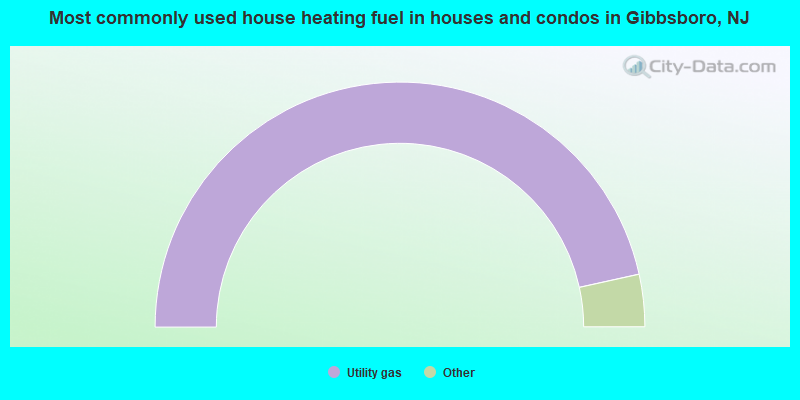
- 93.1%Utility gas
- 3.0%Electricity
- 2.1%Fuel oil, kerosene, etc.
- 1.4%Bottled, tank, or LP gas
- 0.4%Other fuel
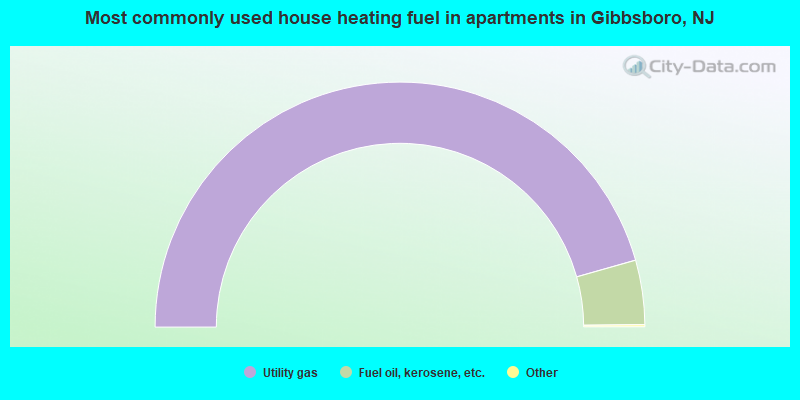
- 91.5%Utility gas
- 8.5%Fuel oil, kerosene, etc.
Private vs. public school enrollment:
| Here: | 3.6% |
| New Jersey: | 12.3% |
| Here: | 0.0% |
| New Jersey: | 13.1% |
| Here: | 51.6% |
| New Jersey: | 33.2% |


