Fort Walton Beach, FL (Florida) Houses and Residents
Estimated median house or condo value in 2022: $323,487 (it was $87,300 in 2000 )
Fort Walton Beach:
$323,487Florida:
$354,100
Lower value quartile - upper value quartile: $243,711 - $425,511Total population: 21,558 (Urban population: 20,289, Rural population: 0)
Houses: 10,219 (9,022 occupied: 5,612 owner occupied, 3,600 renter occupied )
% of renters here:
39%State:
33%
Housing density: 1,373 houses/condos per square mile
Median price asked for vacant for-sale houses and condos in 2022: $1,547,532.
Median contract rent in 2022: $1,054 (lower quartile is $844, upper quartile is $1,369)
Median rent asked for vacant for-rent units in 2022: $665
Median gross rent in Fort Walton Beach, FL in 2022: $1,237
Housing units in Fort Walton Beach with a mortgage: 3,149 (273 second mortgage, 0 home equity loan, 249 both second mortgage and home equity loan )Houses without a mortgage: 54
Median household income for houses/condos with a mortgage: $86,221
Median household income for apartments without a mortgage: $69,742
Median monthly housing costs: $1,198
Data:
Median house or condo value ($)
Median house or condo value ($ change since 2000)
Median house or condo value ($) - White
Median house or condo value ($) - Black or African American
Median house or condo value ($) - Asian
Median house or condo value ($) - Hispanic or Latino
Median house or condo value ($) - American Indian and Alaska Native
Median house or condo value ($) - Multirace
Median house or condo value ($) - Other Race
Median price asked for mobile homes ($)
Household density (households per square mile)
Mean house or condo value by units in structure - 1, detached ($)
Mean house or condo value by units in structure - 1, attached ($)
Mean house or condo value by units in structure - 2 ($)
Mean house or condo value by units in structure by units in structure - 3 or 4 ($)
Mean house or condo value by units in structure - 5 or more ($)
Mean house or condo value by units in structure - Boat, RV, van, etc. ($)
Mean house or condo value by units in structure - Mobile home ($)
Median contract rent ($)
Median contract rent - Lower quartile ($)
Median contract rent - Upper quartile ($)
Median gross rent ($)
Urban houses (%)
Rural houses (%)
Houses occupied (%)
Houses occupied (% change since 2000)
Houses owner occupied (%)
Houses owner occupied (% change since 2000)
Houses renter occupied (%)
Houses renter occupied (% change since 2000)
Vacant housing units - For rent (%)
Vacant housing units - For rent (% change since 2000)
Vacant housing units - For sale only (%)
Vacant housing units - For sale only (% change since 2000)
Vacant housing units - Rented or sold, not occupied (%)
Vacant housing units - Rented or sold, not occupied (% change since 2000)
Vacant housing units - For seasonal, recreational, or occasional use (%)
Vacant housing units - For seasonal, recreational, or occasional use (% change since 2000)
Vacant housing units - For migrant workers (%)
Vacant housing units - For migrant workers (% change since 2000)
Vacant housing units - Other vacant (%)
Vacant housing units - Other vacant (% change since 2000)
Median monthly housing costs ($)
Median household income for houses/condos with a mortgage ($)
Median household income for houses/condos without a mortgage ($)
Median household income ($)
Median household income ($) - White
Median household income ($) - Black or African American
Median household income ($) - Asian
Median household income ($) - Hispanic or Latino
Median household income ($) - American Indian and Alaska Native
Median household income ($) - Multirace
Median household income ($) - Other Race
Mortgage status - with mortgage (%)
Mortgage status - with second mortgage (%)
Mortgage status - with home equity loan (%)
Mortgage status - with both second mortgage and home equity loan (%)
Mortgage status - without a mortgage (%)
Median year house/condo built
Median year apartment built
Household type by relationship - Male householder living alone (%)
Household type by relationship - Male householder not living alone (%)
Household type by relationship - Female householder living alone (%)
Household type by relationship - Female householder not living alone (%)
Household type by relationship - Opposite-Sex spouse (%)
Household type by relationship - Same-Sex spouse (%)
Household type by relationship - Opposite-Sex unmarried partner (%)
Household type by relationship - Same-Sex unmarried partner (%)
Household type by relationship - In group quarters (%)
Size of family households - 2-person household (%)
Size of family households - 3-person household (%)
Size of family households - 4-person household (%)
Size of family households - 5-person household (%)
Size of family households - 6-person household (%)
Size of family households - 7-or-more-person household (%)
Size of nonfamily households - 1-person household (%)
Size of nonfamily households - 2-person household (%)
Size of nonfamily households - 3-person household (%)
Size of nonfamily households - 4-person household (%)
Size of nonfamily households - 5-person household (%)
Size of nonfamily households - 6-person household (%)
Size of nonfamily households - 7-or-moreperson household (%)
Year house built - Built 2010 or later (%)
Year house built - Built 2000 to 2009 (%)
Year house built - Built 1990 to 1999 (%)
Year house built - Built 1980 to 1989 (%)
Year house built - Built 1970 to 1979 (%)
Year house built - Built 1960 to 1969 (%)
Year house built - Built 1950 to 1959 (%)
Year house built - Built 1940 to 1949 (%)
Year house built - Built 1939 or earlier (%)
Median number of rooms in houses and condos
Median number of rooms in apartments
Median number of bedrooms in owner occupied houses
Mean number of bedrooms in owner occupied houses
Median number of bedrooms in renter occupied houses
Mean number of bedrooms in renter occupied houses
Median number of vehichles in owner occupied houses
Mean number of vehichles in owner occupied houses
Median number of vehichles in renter occupied houses
Mean number of vehichles in renter occupied houses
Rooms in owner-occupied houses - 1 room (%)
Rooms in owner-occupied houses - 2 rooms (%)
Rooms in owner-occupied houses - 3 rooms (%)
Rooms in owner-occupied houses - 4 rooms (%)
Rooms in owner-occupied houses - 5 rooms (%)
Rooms in owner-occupied houses - 6 rooms (%)
Rooms in owner-occupied houses - 7 rooms (%)
Rooms in owner-occupied houses - 8 rooms (%)
Rooms in owner-occupied houses - 9+ rooms (%)
Rooms in renter-occupied houses - 1 room (%)
Rooms in renter-occupied houses - 2 rooms (%)
Rooms in renter-occupied houses - 3 rooms (%)
Rooms in renter-occupied houses - 4 rooms (%)
Rooms in renter-occupied houses - 5 rooms (%)
Rooms in renter-occupied houses - 6 rooms (%)
Rooms in renter-occupied houses - 7 rooms (%)
Rooms in renter-occupied houses - 8 rooms (%)
Rooms in renter-occupied houses - 9+ rooms (%)
Bedrooms in owner-occupied houses - no bedrooms (%)
Bedrooms in owner-occupied houses - 1 bedroom (%)
Bedrooms in owner-occupied houses - 2 bedrooms (%)
Bedrooms in owner-occupied houses - 3 bedrooms (%)
Bedrooms in owner-occupied houses - 4 bedrooms (%)
Bedrooms in owner-occupied houses - 5+ bedrooms (%)
Bedrooms in renter-occupied houses - no bedrooms (%)
Bedrooms in renter-occupied houses - 1 bedroom (%)
Bedrooms in renter-occupied houses - 2 bedrooms (%)
Bedrooms in renter-occupied houses - 3 bedrooms (%)
Bedrooms in renter-occupied houses - 4 bedrooms (%)
Bedrooms in renter-occupied houses - 5+ bedrooms (%)
Vehicles available in owner-occupied houses - no vehicle available (%)
Vehicles available in owner-occupied houses - 1 vehicle available(%)
Vehicles available in owner-occupied houses - 2 Vehicles available (%)
Vehicles available in owner-occupied houses - 3 Vehicles available (%)
Vehicles available in owner-occupied houses - 4 Vehicles available (%)
Vehicles available in owner-occupied houses - 5+ Vehicles available (%)
Vehicles available in renter-occupied houses - no vehicle available (%)
Vehicles available in renter-occupied houses - 1 vehicle available (%)
Vehicles available in renter-occupied houses - 2 Vehicles available (%)
Vehicles available in renter-occupied houses - 3 Vehicles available (%)
Vehicles available in renter-occupied houses - 4 Vehicles available (%)
Vehicles available in renter-occupied houses - 5+ Vehicles available (%)
Housing units in structures - 1, detached (%)
Housing units in structures - 1, attached (%)
Housing units in structures - 2 (%)
Housing units in structures - 3 or 4 (%)
Housing units in structures - 5 to 9 (%)
Housing units in structures - 10 to 19 (%)
Housing units in structures - 20 to 49 (%)
Housing units in structures - 50 or more (%)
Housing units in structures - Mobile home (%)
Housing units in structures - Boat, RV, van, etc. (%)
Housing units in structures - Owners - 1, detached (%)
Housing units in structures - Owners - 1, attached (%)
Housing units in structures - Owners - 2 (%)
Housing units in structures - Owners - 3 or 4 (%)
Housing units in structures - Owners - 5 to 9 (%)
Housing units in structures - Owners - 10 to 19 (%)
Housing units in structures - Owners - 20 to 49 (%)
Housing units in structures - Owners - 50 or more (%)
Housing units in structures - Owners - Mobile home (%)
Housing units in structures - Owners - Boat, RV, van, etc. (%)
Housing units in structures - Renters - 1, detached (%)
Housing units in structures - Renters - 1, attached (%)
Housing units in structures - Renters - 2 (%)
Housing units in structures - Renters - 3 or 4 (%)
Housing units in structures - Renters - 5 to 9 (%)
Housing units in structures - Renters - 10 to 19 (%)
Housing units in structures - Renters - 20 to 49 (%)
Housing units in structures - Renters - 50 or more (%)
Housing units in structures - Renters - Mobile home (%)
Housing units in structures - Renters - Boat, RV, van, etc. (%)
House/condo owner moved in on average (years ago)
Renter moved in on average (years ago)
Year householder moved into unit - Moved in 1999 to March 2000 (%)
Year householder moved into unit - Moved in 1999 to March 2000 (%) - White
Year householder moved into unit - Moved in 1999 to March 2000 (%) - Black or African American
Year householder moved into unit - Moved in 1999 to March 2000 (%) - Asian
Year householder moved into unit - Moved in 1999 to March 2000 (%) - Hispanic or Latino
Year householder moved into unit - Moved in 1999 to March 2000 (%) - American Indian and Alaska Native
Year householder moved into unit - Moved in 1999 to March 2000 (%) - Multirace
Year householder moved into unit - Moved in 1999 to March 2000 (%) - Other Race
Year householder moved into unit - Moved in 1995 to 1998 (%)
Year householder moved into unit - Moved in 1995 to 1998 (%) - White
Year householder moved into unit - Moved in 1995 to 1998 (%) - Black or African American
Year householder moved into unit - Moved in 1995 to 1998 (%) - Asian
Year householder moved into unit - Moved in 1995 to 1998 (%) - Hispanic or Latino
Year householder moved into unit - Moved in 1995 to 1998 (%) - American Indian and Alaska Native
Year householder moved into unit - Moved in 1995 to 1998 (%) - Multirace
Year householder moved into unit - Moved in 1995 to 1998 (%) - Other Race
Year householder moved into unit - Moved in 1990 to 1994 (%)
Year householder moved into unit - Moved in 1990 to 1994 (%) - White
Year householder moved into unit - Moved in 1990 to 1994 (%) - Black or African American
Year householder moved into unit - Moved in 1990 to 1994 (%) - Asian
Year householder moved into unit - Moved in 1990 to 1994 (%) - Hispanic or Latino
Year householder moved into unit - Moved in 1990 to 1994 (%) - American Indian and Alaska Native
Year householder moved into unit - Moved in 1990 to 1994 (%) - Multirace
Year householder moved into unit - Moved in 1990 to 1994 (%) - Other Race
Year householder moved into unit - Moved in 1980 to 1989 (%)
Year householder moved into unit - Moved in 1980 to 1989 (%) - White
Year householder moved into unit - Moved in 1980 to 1989 (%) - Black or African American
Year householder moved into unit - Moved in 1980 to 1989 (%) - Asian
Year householder moved into unit - Moved in 1980 to 1989 (%) - Hispanic or Latino
Year householder moved into unit - Moved in 1980 to 1989 (%) - American Indian and Alaska Native
Year householder moved into unit - Moved in 1980 to 1989 (%) - Multirace
Year householder moved into unit - Moved in 1980 to 1989 (%) - Other Race
Year householder moved into unit - Moved in 1970 to 1979 (%)
Year householder moved into unit - Moved in 1970 to 1979 (%) - White
Year householder moved into unit - Moved in 1970 to 1979 (%) - Black or African American
Year householder moved into unit - Moved in 1970 to 1979 (%) - Asian
Year householder moved into unit - Moved in 1970 to 1979 (%) - Hispanic or Latino
Year householder moved into unit - Moved in 1970 to 1979 (%) - American Indian and Alaska Native
Year householder moved into unit - Moved in 1970 to 1979 (%) - Multirace
Year householder moved into unit - Moved in 1970 to 1979 (%) - Other Race
Year householder moved into unit - Moved in 1969 or earlier (%)
Year householder moved into unit - Moved in 1969 or earlier (%) - White
Year householder moved into unit - Moved in 1969 or earlier (%) - Black or African American
Year householder moved into unit - Moved in 1969 or earlier (%) - Asian
Year householder moved into unit - Moved in 1969 or earlier (%) - Hispanic or Latino
Year householder moved into unit - Moved in 1969 or earlier (%) - American Indian and Alaska Native
Year householder moved into unit - Moved in 1969 or earlier (%) - Multirace
Year householder moved into unit - Moved in 1969 or earlier (%) - Other Race
Housing units lacking complete plumbing facilities (%)
Housing units lacking complete kitchen facilities (%)
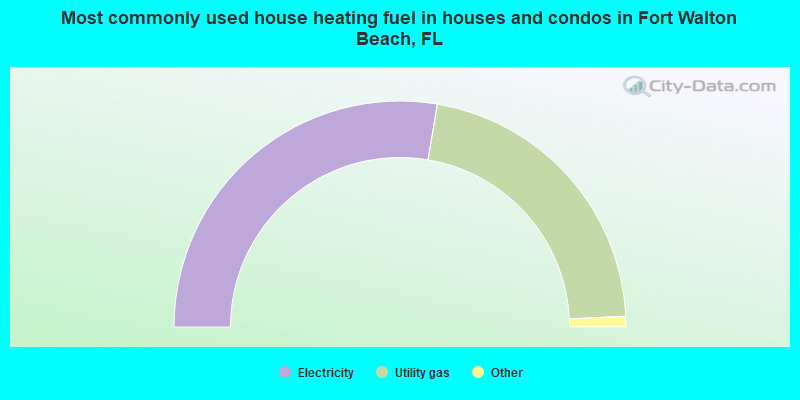
House heating fuel used in houses and condos - Utility gas (%)
House heating fuel used in houses and condos - Bottled, tank, or LP gas (%)
House heating fuel used in houses and condos - Electricity (%)
House heating fuel used in houses and condos - Fuel oil, kerosene, etc. (%)
House heating fuel used in houses and condos - Coal or coke (%)
House heating fuel used in houses and condos - Wood (%)
House heating fuel used in houses and condos - Solar energy (%)
House heating fuel used in houses and condos - Other fuel (%)
House heating fuel used in houses and condos - No fuel used (%)
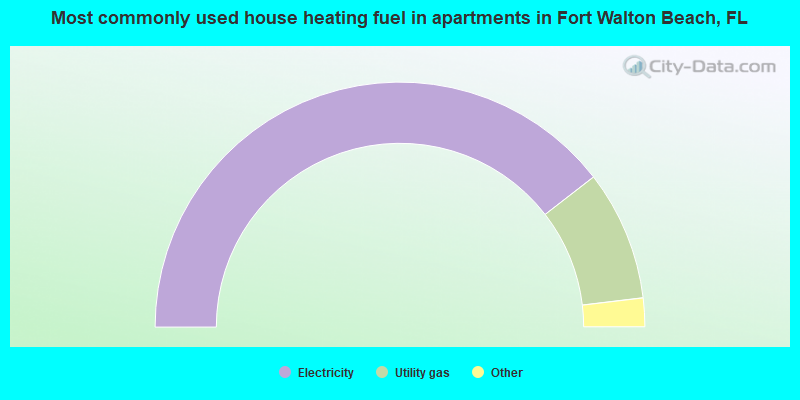
House heating fuel used in apartments - Utility gas (%)
House heating fuel used in apartments - Bottled, tank, or LP gas (%)
House heating fuel used in apartments - Electricity (%)
House heating fuel used in apartments - Fuel oil, kerosene, etc. (%)
House heating fuel used in apartments - Coal or coke (%)
House heating fuel used in apartments - Wood (%)
House heating fuel used in apartments - Solar energy (%)
House heating fuel used in apartments - Other fuel (%)
House heating fuel used in apartments - No fuel used (%)
Median year house/condo built: 1968Median year apartment built: 1979Household type by relationship:
Households: 21,359
Male householders: 4,769 (1,486 living alone ), Female householders: 4,256 (1,811 living alone )3,580 spouses (3,558 opposite-sex spouses ), 606 unmarried partners , (606 opposite-sex unmarried partners ), 5,826 children (5,328 natural , 195 adopted , 302 stepchildren ), 455 grandchildren , 108 brothers or sisters , 277 parents , 16 foster children , 215 other relatives , 844 non-relatives In group quarters: 402
Size of family households: 2,454 2-persons , 1,260 3-persons , 794 4-persons , 661 5-persons , 204 6-persons , 66 7-or-more-persons .
Size of nonfamily households: 3,081 1-person , 507 2-persons , 110 3-persons , 6 4-persons , 2 6-persons , 9 7-or-more-persons .
2,933 married couples with children. single-parent households (313 men , 1,110 women ).
85.5% of residents of Fort Walton Beach speak English at home. of residents speak Spanish at home (60% speak English very well , 27% speak English well , 11% speak English not well , 2% don't speak English at all ).of residents speak other Indo-European language at home (77% speak English very well , 13% speak English well , 10% speak English not well ).of residents speak Asian or Pacific Island language at home (33% speak English very well , 48% speak English well , 16% speak English not well , 2% don't speak English at all ).of residents speak other language at home (100% speak English very well ).
Foreign born population: 1,900 (8.9%)of them are naturalized citizens )
Median number of rooms in houses and condos:
Median number of rooms in apartments
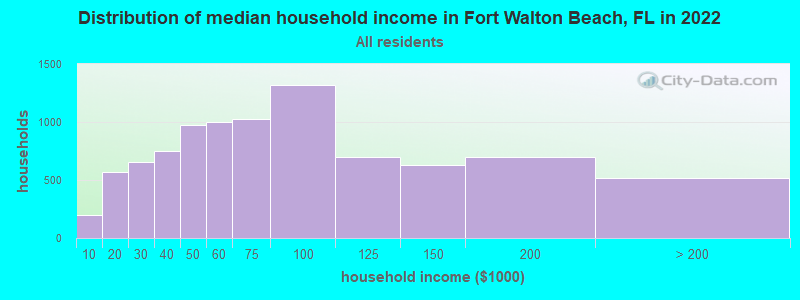
Fort Walton Beach, FL household income distribution 202 Less than $10,000569 $10,000 to $19,999656 $20,000 to $29,999746 $30,000 to $39,999978 $40,000 to $49,9991,001 $50,000 to $59,9991,028 $60,000 to $74,9991,321 $75,000 to $99,999700 $100,000 to $124,999629 $125,000 to $149,999702 $150,000 to $199,999515 $200,000 or more
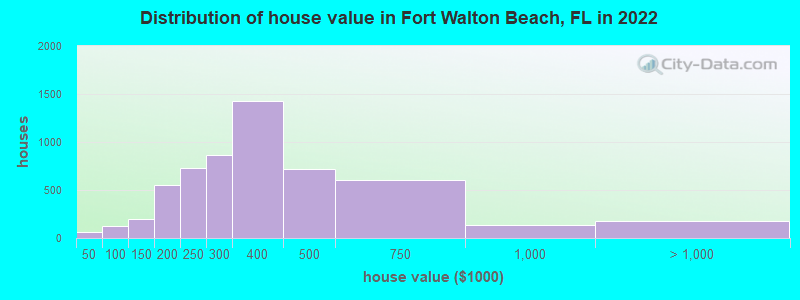
Home value of owner - occupied houses in 2022 in Fort Walton Beach, FL 24 Less than $10,0004 $10,000 to $14,99913 $15,000 to $19,9995 $20,000 to $24,99915 $25,000 to $29,9993 $40,000 to $49,9994 $50,000 to $59,99917 $70,000 to $79,99928 $80,000 to $89,99975 $90,000 to $99,999100 $100,000 to $124,99992 $125,000 to $149,999307 $150,000 to $174,999241 $175,000 to $199,999733 $200,000 to $249,999865 $250,000 to $299,9991,431 $300,000 to $399,999713 $400,000 to $499,999603 $500,000 to $749,999131 $750,000 to $999,999152 $1,000,000 to $1,499,9997 $1,500,000 to $1,999,99921 $2,000,000 or moreRent paid by renters in 2022 in Fort Walton Beach, FL 19 Less than $10019 $150 to $19949 $200 to $24923 $250 to $29921 $300 to $34959 $400 to $44983 $500 to $54925 $550 to $599169 $600 to $649110 $650 to $699186 $700 to $749127 $750 to $799181 $800 to $899464 $900 to $999771 $1,000 to $1,249395 $1,250 to $1,499305 $1,500 to $1,999134 $2,000 to $2,49961 $2,500 to $2,99944 $3,000 to $3,499125 No cash rent
Percentage of workers working in this county: 90.5%Number of people working at home: 810 (7.4% of all workers )
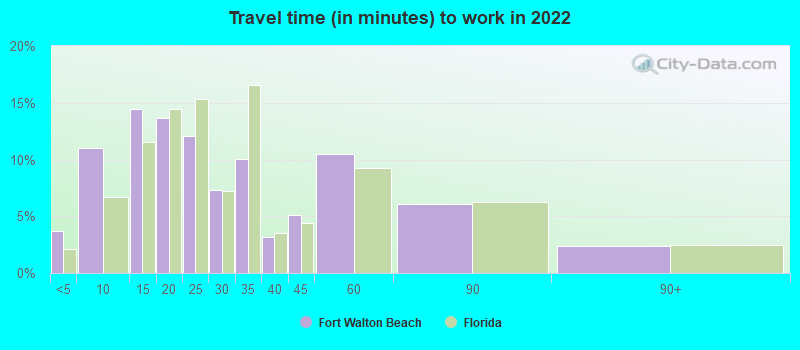
Travel time to work (commute)
Less than 5 minutes: 2795 to 9 minutes: 1,56810 to 14 minutes: 1,84915 to 19 minutes: 1,83420 to 24 minutes: 1,85025 to 29 minutes: 48230 to 34 minutes: 70135 to 39 minutes: 15540 to 44 minutes: 34845 to 59 minutes: 36960 to 89 minutes: 44290 or more minutes: 199
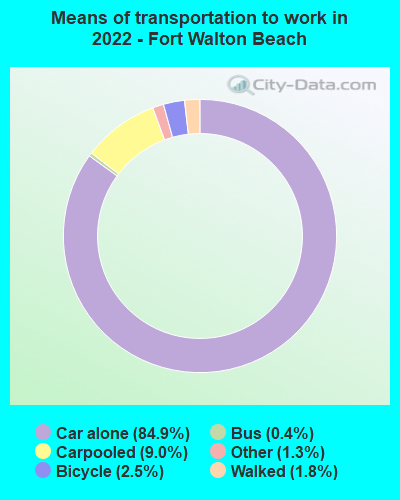
Means of transportation to work:
Drove a car alone: 13,195 (79.7%)Carpooled: 1,516 (9.2%)Bus : 34 (0.2%)Taxi: 333 (2.0%)Bicycle: 191 (1.2%)Walked: 264 (1.6%)Worked at home: 810 (4.9%)
Unemployment by race in 2022
Unemployment rate for White non-Hispanic residents 2.3% Males7.0% FemalesUnemployment rate for Black residents 1.9% FemalesUnemployment rate for Asian residents 5.7% FemalesUnemployment rate for other race residents 12.7% MalesUnemployment rate for two or more race residents 2.3% MalesUnemployment rate for Hispanic or Latino residents 8.0% Males
Year of entry for the foreign-born population in Fort Walton Beach, Florida
678 2010 or later 466 2000 to 2009 186 1990 to 1999 244 1980 to 1989 272 1970 to 1979 416 Before 1970
First ancestries reported:
English: 1,607 (13.9%)
American: 1,451 (12.5%)
German: 676 (5.8%)
Irish: 589 (5.1%)
Scottish: 460 (4.0%)
Italian: 316 (2.7%)
European: 267 (2.3%)
Polish: 209 (1.8%)
British: 163 (1.4%)
Russian: 142 (1.2%)
Greek: 141 (1.2%)
Portuguese: 121 (1.0%)
Scotch-Irish: 118 (1.0%)
French: 70 (0.6%)
Jamaican: 68 (0.6%)
French Canadian: 56 (0.5%)
Finnish: 54 (0.5%)
Welsh: 50 (0.4%)
Swedish: 45 (0.4%)
Turkish: 43 (0.4%)
Arab: 42 (0.4%)
Dutch: 35 (0.3%)
Northern European: 31 (0.3%)
Brazilian: 29 (0.3%)
Belgian: 27 (0.2%)
Canadian: 24 (0.2%)
Scandinavian: 24 (0.2%)
Liberian: 18 (0.2%)
Estonian: 15 (0.1%)
Croatian: 13 (0.1%)
Serbian: 10 (0.09%)
Danish: 8 (0.07%)
Norwegian: 7 (0.06%)
Romanian: 7 (0.06%)
Syrian: 5 (0.04%)
Australian: 4 (0.03%)
Bulgarian: 4 (0.03%)
African: 1 (0.01%) Most common places of birth for foreign-born residents (%): Thailand Fort Walton Beach:
16.5% (336)Florida:
0.3% (12,303)
Mexico Fort Walton Beach:
9.6% (195)Florida:
5.6% (257,152)
Philippines Fort Walton Beach:
7.1% (145)Florida:
1.8% (84,403)
Honduras Fort Walton Beach:
6.9% (141)Florida:
2.3% (107,160)
Colombia Fort Walton Beach:
4.7% (95)Florida:
6.5% (298,669)
Brazil Fort Walton Beach:
4.6% (93)Florida:
2.7% (122,906)
Russia Fort Walton Beach:
4.2% (86)Florida:
0.7% (31,076)
Vietnam Fort Walton Beach:
3.9% (79)Florida:
1.3% (60,604)
Jamaica Fort Walton Beach:
3.8% (77)Florida:
5.0% (227,319)
Ecuador Fort Walton Beach:
3.7% (75)Florida:
1.2% (54,585)
Venezuela Fort Walton Beach:
2.7% (55)Florida:
5.7% (262,042)
Guatemala Fort Walton Beach:
2.7% (55)Florida:
2.1% (97,632)
Germany Fort Walton Beach:
2.5% (52)Florida:
1.2% (54,272)
China, excluding Hong Kong and Taiwan Fort Walton Beach:
2.2% (45)Florida:
1.2% (56,071)
Argentina Fort Walton Beach:
2.0% (41)Florida:
1.3% (57,263)
Cuba Fort Walton Beach:
1.9% (38)Florida:
22.0% (1,006,576)
Korea Fort Walton Beach:
1.9% (38)Florida:
0.4% (19,445)
Czechoslovakia (includes Czech Republic and Slovakia) Fort Walton Beach:
1.5% (31)Florida:
0.2% (8,038)
Place of birth for U.S.-born residents:
This state: 7,237Other state: 11,263Northeast: 1,854Midwest: 2,861South: 4,996West: 1,526 85.8% of Fort Walton Beach residents lived in the same house 1 years ago.
Out of people who lived in different houses, 28.9% lived in this county.
Out of people who lived in different counties, 38.8% lived in Florida.
Fort Walton Beach:
85.8%State average:
86.3%
Education attainment for males 25 years and older:
No schooling: 42Nursery to 4th grade: 235th and 6th grade: 517th and 8th grade: 909th grade: 4210th grade: 4011th grade: 16012th grade, no diploma: 60High school graduate (or equivalency): 1,948Less than 1 year of college: 729Some college more than 1 year, no degree: 1,267Associate degree: 951Bachelor's degree: 1,227Master's degree: 568Professional school degree: 69Doctorate degree: 108
Education attainment for females 25 years and older:
No schooling: 103Nursery to 4th grade: 125th and 6th grade: 07th and 8th grade: 499th grade: 7710th grade: 4311th grade: 7612th grade, no diploma: 58High school graduate (or equivalency): 2,337Less than 1 year of college: 736Some college more than 1 year, no degree: 1,194Associate degree: 964Bachelor's degree: 1,455Master's degree: 578Professional school degree: 34Doctorate degree: 47
Housing units in structures:
One, detached: 6,639One, attached: 671Two: 373 or 4: 6085 to 9: 68310 to 19: 50720 to 49: 26350 or more: 754Mobile homes: 16Boats, RVs, vans, etc.: 37Housing units lacking complete kitchen facilities in 2022: 0.8%House/condo owner moved in on average 13 years ago
Renter moved in on average 4 years ago
Private vs. public school enrollment:
Students in private schools in grades 1 to 8 (elementary and middle school): 212 Students in private schools in grades 9 to 12 (high school): 121 Students in private undergraduate colleges: 125