Fort Myers, FL (Florida) Houses and Residents
| Fort Myers: | $405,000 |
| Florida: | $354,100 |
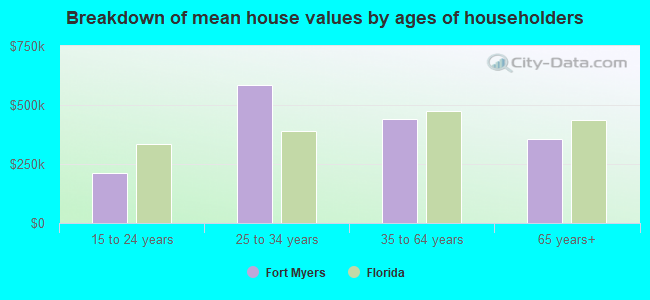
Mean price in 2022:
Detached houses: $443,797
Here: $443,797 State: $500,941 Townhouses or other attached units: $382,251
Here: $382,251 State: $370,869 In 2-unit structures: $315,633
Here: $315,633 State: $423,188 In 3-to-4-unit structures: $307,917
Here: $307,917 State: $309,944 In 5-or-more-unit structures: $302,237
Here: $302,237 State: $447,145 Mobile homes: $85,722
Here: $85,722 State: $113,202 Occupied boats, RVs, vans, etc.: $189,704
Here: $189,704 State: $73,933
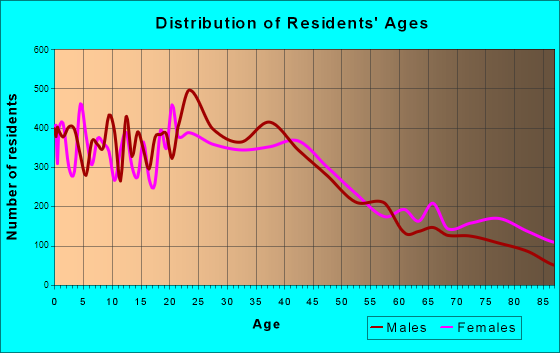
Total population: 70,918 (Urban population: 47,502, Rural population: 544 (all nonfarm))
Houses: 51,180 (40,790 occupied: 20,607 owner occupied, 20,183 renter occupied)
| % of renters here: | 49% |
| State: | 33% |
Housing density: 1,608 houses/condos per square mile
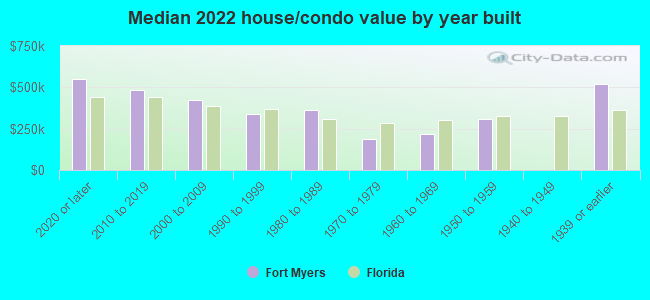
Median price asked for vacant for-sale houses and condos in 2022: $548,975.
Median contract rent in 2022: $1,364 (lower quartile is $967, upper quartile is $1,721)
Median rent asked for vacant for-rent units in 2022: $1,759
Median gross rent in Fort Myers, FL in 2022: $1,511
Housing units in Fort Myers with a mortgage: 10,368 (383 second mortgage, 0 home equity loan, 317 both second mortgage and home equity loan)
Houses without a mortgage: 100
Median household income for houses/condos with a mortgage: $100,577
Median household income for apartments without a mortgage: $82,838
Median monthly housing costs: $1,419
Compare current foreclosures in Fort Myers, FL:
| Photo | Address | Area | Beds / Baths | Price | Details |
|---|---|---|---|---|---|

|
#1
Van Buren St Apt C5
Fort Myers, FL 33916
|
968 sq. feet
|
1 baths 2 beds |
$155,000
|
show details |

|
#2
Morning Glory Ln
Fort Myers, FL 33913
|
2,512 sq. feet
|
2 baths 4 beds |
$510,000
|
show details |

|
#3
Dogwood Rd
Fort Myers, FL 33967
|
1,608 sq. feet
|
2 baths 3 beds |
show details | |

|
#4
Glenlivet Rd
Fort Myers, FL 33907
|
1,034 sq. feet
|
2 baths 3 beds |
show details | |

|
#5
River Ridge Blvd
Fort Myers, FL 33905
|
1,368 sq. feet
|
2 baths 3 beds |
show details | |

|
#6
Millstone Cir Unit 101
Fort Myers, FL 33908
|
1,348 sq. feet
|
2 baths 3 beds |
show details | |

|
#7
Mcgregor Blvd
Fort Myers, FL 33908
|
800 sq. feet
|
2 baths 2 beds |
show details | |

|
#8
Whitehead Creek Loop
Fort Myers, FL 33916
|
1,210 sq. feet
|
2 baths 3 beds |
show details | |

|
#9
Mooring Cir
Fort Myers, FL 33967
|
1,410 sq. feet
|
2 baths 3 beds |
show details | |

|
#10
Cantabria Dr
Fort Myers, FL 33905
|
1,303 sq. feet
|
3 baths 4 beds |
show details |
| Photo | Address | Area | Beds / Baths | Price | Details |
|---|---|---|---|---|---|

|
#11
Parkview Dr
Fort Myers, FL 33905
|
1,389 sq. feet
|
1 baths 3 beds |
show details | |

|
#12
Maytree Cir
Fort Myers, FL 33905
|
2,246 sq. feet
|
2 baths 4 beds |
show details | |

|
#13
Cypress Dr N
Fort Myers, FL 33967
|
1,336 sq. feet
|
2 baths 3 beds |
show details | |

|
#14
Tampa Rd
Fort Myers, FL 33967
|
1,160 sq. feet
|
2 baths 3 beds |
show details | |

|
#15
Island Inlet Ct
Fort Myers, FL 33908
|
1,393 sq. feet
|
2 baths 2 beds |
show details | |

|
#16
Belgrave St
Fort Myers, FL 33913
|
1,747 sq. feet
|
2 baths 4 beds |
show details | |

|
#17
Tilbor Cir
Fort Myers, FL 33916
|
960 sq. feet
|
2 baths 2 beds |
show details | |

|
#18
Pond Cypress St
Fort Myers, FL 33913
|
1,594 sq. feet
|
3 baths 5 beds |
show details | |

|
#19
Emerald Pines Cir
Fort Myers, FL 33966
|
2,244 sq. feet
|
2 baths 4 beds |
show details | |

|
#20
Old Harmony Dr Apt 202
Fort Myers, FL 33908
|
2,188 sq. feet
|
2 baths 3 beds |
show details |
| Photo | Address | Area | Beds / Baths | Price | Details |
|---|---|---|---|---|---|

|
#21
Highland Ave
Fort Myers, FL 33916
|
816 sq. feet
|
1 baths 2 beds |
show details | |

|
#22
Belleza Way Apt 203
Fort Myers, FL 33908
|
1,829 sq. feet
|
2 baths 3 beds |
show details | |

|
#23
Fairway Woods Dr Apt 206
Fort Myers, FL 33908
|
1,782 sq. feet
|
2 baths 2 beds |
show details | |

|
#24
Pine Valley Dr Apt 217
Fort Myers, FL 33907
|
956 sq. feet
|
2 baths 2 beds |
show details | |

|
#25
River Bluff Ct
Fort Myers, FL 33905
|
2,918 sq. feet
|
3 baths 3 beds |
show details | |

|
#26
S Pointe Blvd Apt 319
Fort Myers, FL 33919
|
812 sq. feet
|
1 baths 2 beds |
show details | |

|
#27
Maple Ave
Fort Myers, FL 33901
|
700 sq. feet
|
1 baths 2 beds |
show details | |

|
#28
Purslane Dr
Fort Myers, FL 33905
|
1,056 sq. feet
|
2 baths 2 beds |
show details | |

|
#29
Colonial Country Club Blvd Apt 1003
Fort Myers, FL 33913
|
1,235 sq. feet
|
2 baths 2 beds |
show details | |

|
#30
Brant Point Cir Apt 3301
Fort Myers, FL 33919
|
1,304 sq. feet
|
2 baths 2 beds |
show details |
| Photo | Address | Area | Beds / Baths | Price | Details |
|---|---|---|---|---|---|

|
#31
Oleander Ave
Fort Myers, FL 33916
|
1,207 sq. feet
|
2 baths 3 beds |
show details | |

|
#32
Angus Ln
Fort Myers, FL 33905
|
810 sq. feet
|
2 baths 3 beds |
show details | |

|
#33
Rosada Way
Fort Myers, FL 33901
|
1,798 sq. feet
|
2 baths 3 beds |
show details | |

|
#34
Burningtree Ave
Fort Myers, FL 33919
|
1,042 sq. feet
|
1 baths 2 beds |
show details | |

|
#35
Park Shore Cir Apt 4
Fort Myers, FL 33901
|
840 sq. feet
|
2 baths 3 beds |
show details | |

|
#36
Riverside Dr
Fort Myers, FL 33905
|
1,368 sq. feet
|
2 baths 2 beds |
show details | |

|
#37
Birchwood Ln Apt 5
Fort Myers, FL 33908
|
989 sq. feet
|
2 baths 2 beds |
show details | |

|
#38
Fairfield Way
Fort Myers, FL 33919
|
2,970 sq. feet
|
3 baths 4 beds |
show details | |

|
#39
Lincoln Blvd
Fort Myers, FL 33916
|
1,354 sq. feet
|
2 baths 4 beds |
show details | |

|
#40
Cedar Hollow Dr
Fort Myers, FL 33912
|
1,821 sq. feet
|
2 baths 3 beds |
show details |
| Photo | Address | Area | Beds / Baths | Price | Details |
|---|---|---|---|---|---|

|
#41
Dora St
Fort Myers, FL 33901
|
917 sq. feet
|
1 baths 2 beds |
show details | |

|
#42
Venetian Lagoon Dr
Fort Myers, FL 33913
|
2,334 sq. feet
|
3 baths 3 beds |
show details | |

|
#43
Abaco Lakes Dr Apt 204
Fort Myers, FL 33908
|
1,529 sq. feet
|
2 baths 2 beds |
show details | |

|
#44
Flamingo Rd
Fort Myers, FL 33967
|
1,040 sq. feet
|
1 baths 3 beds |
show details | |

|
#45
Heald Ln Apt 11b
Fort Myers, FL 33908
|
1,024 sq. feet
|
1 baths 2 beds |
show details | |

|
#46
Birch Rd
Fort Myers, FL 33967
|
1,542 sq. feet
|
2 baths 4 beds |
show details | |

|
#47
Bobcat Dr
Fort Myers, FL 33908
|
2,476 sq. feet
|
2 baths 3 beds |
show details | |

|
#48
Lake Cypress Loop
Fort Myers, FL 33913
|
1,941 sq. feet
|
2 baths 4 beds |
show details | |

|
#49
Bobcat Dr
Fort Myers, FL 33908
|
2,576 sq. feet
|
2 baths 3 beds |
show details | |

|
Check over 1 million property listings on Foreclosure.com!
|
browse all offers | |||


 | Best Apartments in Fort Myers?!! (21 replies) |
| Any good $550-$600 single bed & bath apartments in (Fort Myers) (5 replies) |
| fort myers condos (3 replies) |
| Seville Apartments - 7331 Pinnacle Pines Dr., Fort Myers, FL (18 replies) |
| PalmLee Park in Fort Myers? (2 replies) |
| Is the Fort Myers single-family housing market beginning to cool off? (16 replies) |
Median year apartment built: 1994
Household type by relationship:
Households: 95,935- Male householders: 19,824 (4,344 living alone), Female householders: 20,966 (8,246 living alone)
17,148 spouses (17,024 opposite-sex spouses), 3,599 unmarried partners, (3,522 opposite-sex unmarried partners), 22,133 children (21,728 natural, 95 adopted, 310 stepchildren), 873 grandchildren, 1,299 brothers or sisters, 1,857 parents, 0 foster children, 2,498 other relatives, 3,029 non-relatives
- In group quarters: 2,709
Size of family households: 15,248 2-persons, 4,550 3-persons, 3,050 4-persons, 937 5-persons, 412 6-persons, 380 7-or-more-persons.
Size of nonfamily households: 12,590 1-person, 3,331 2-persons, 169 3-persons, 123 4-persons.
7,712 married couples with children.
6,623 single-parent households (1,642 men, 4,981 women).
70.1% of residents of Fort Myers speak English at home.
21.2% of residents speak Spanish at home (45% speak English very well, 21% speak English well, 16% speak English not well, 17% don't speak English at all).
7.7% of residents speak other Indo-European language at home (56% speak English very well, 22% speak English well, 17% speak English not well, 5% don't speak English at all).
1.4% of residents speak Asian or Pacific Island language at home (45% speak English very well, 32% speak English well, 17% speak English not well, 6% don't speak English at all).
0.6% of residents speak other language at home (83% speak English very well, 17% speak English well).
Foreign born population: 23,073 (24.1%)
(34.6% of them are naturalized citizens)
| Here: | 5.5 |
| State: | 5.9 |
| Here: | 3.9 |
| State: | 4.2 |
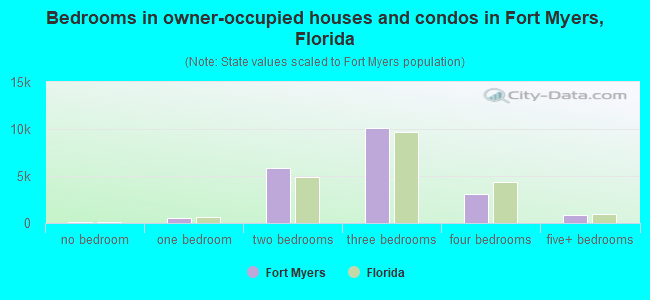
- Bedrooms in owner-occupied houses and condos in Fort Myers, Florida
- 101no bedroom
- 4981 bedroom
- 5,8962 bedrooms
- 10,1583 bedrooms
- 3,0504 bedrooms
- 9045+ bedrooms
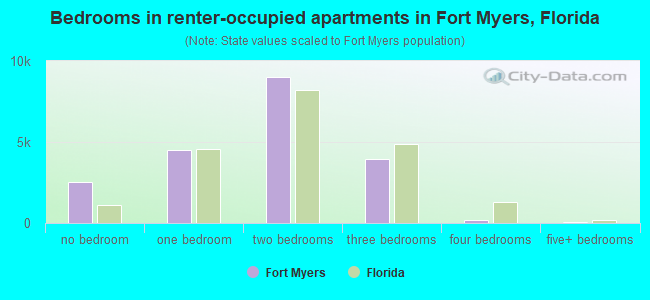
- Bedrooms in renter-occupied apartments in Fort Myers, Florida
- 2,516no bedroom
- 4,4761 bedroom
- 9,0092 bedrooms
- 3,9623 bedrooms
- 1704 bedrooms
- 505+ bedrooms
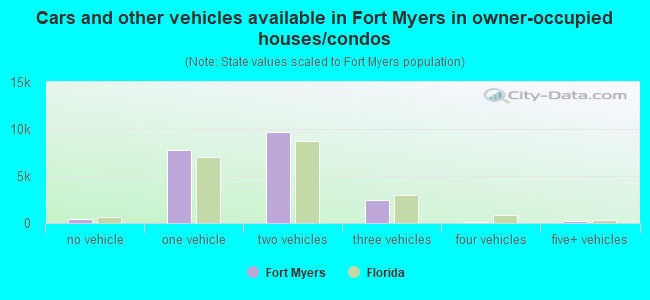
- Cars and other vehicles available in Fort Myers in owner-occupied houses/condos
- 394no vehicle
- 7,8061 vehicle
- 9,7052 vehicles
- 2,4133 vehicles
- 1224 vehicles
- 1675+ vehicles
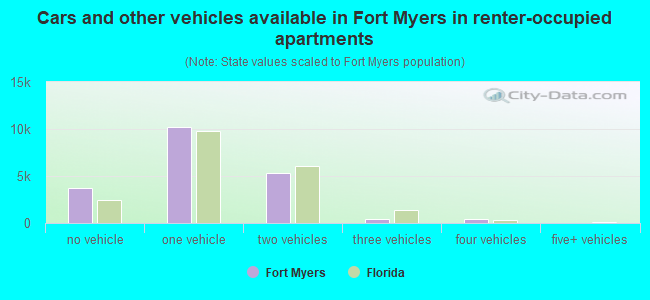
- Cars and other vehicles available in Fort Myers in renter-occupied apartments
- 3,732no vehicle
- 10,2551 vehicle
- 5,3202 vehicles
- 4763 vehicles
- 4004 vehicles
- 05+ vehicles
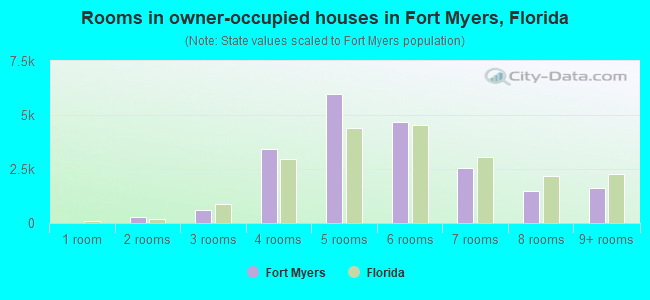
- Rooms in owner-occupied houses in Fort Myers, Florida
- 01 room
- 2832 rooms
- 5813 rooms
- 3,4244 rooms
- 5,9655 rooms
- 4,6726 rooms
- 2,5507 rooms
- 1,4938 rooms
- 1,6399+ rooms
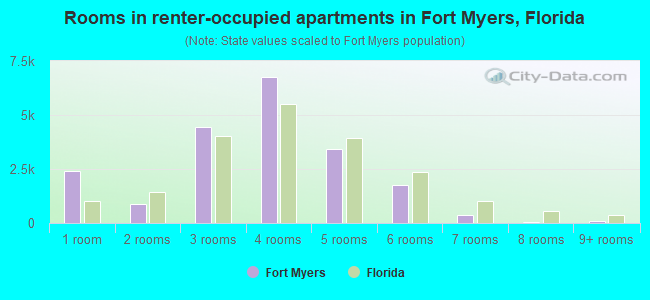
- Rooms in renter-occupied apartments in Fort Myers, Florida
- 2,4011 room
- 8712 rooms
- 4,4433 rooms
- 6,7584 rooms
- 3,4165 rooms
- 1,7636 rooms
- 3807 rooms
- 428 rooms
- 1099+ rooms
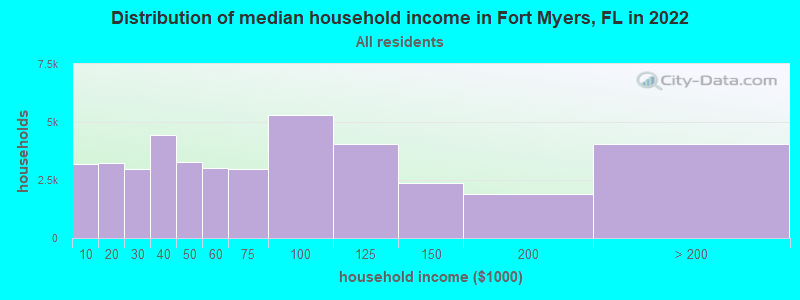
Fort Myers, FL household income distribution

- 3,206Less than $10,000
- 3,216$10,000 to $19,999
- 2,988$20,000 to $29,999
- 4,440$30,000 to $39,999
- 3,287$40,000 to $49,999
- 3,017$50,000 to $59,999
- 2,978$60,000 to $74,999
- 5,312$75,000 to $99,999
- 4,045$100,000 to $124,999
- 2,379$125,000 to $149,999
- 1,881$150,000 to $199,999
- 4,041$200,000 or more
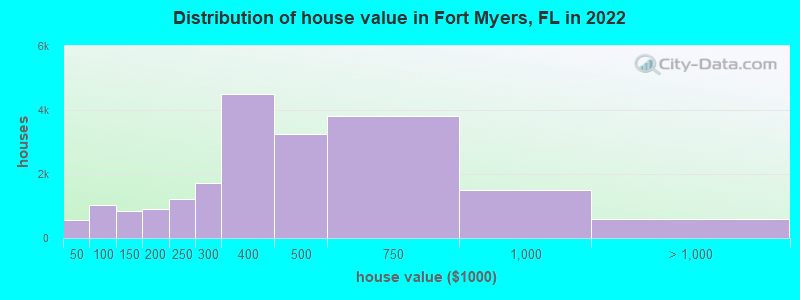
Home value of owner - occupied houses in 2022 in Fort Myers, FL
-
- 257Less than $10,000
- 134$10,000 to $14,999
- 29$15,000 to $19,999
- 39$20,000 to $24,999
- 6$25,000 to $29,999
- 6$30,000 to $34,999
- 4$35,000 to $39,999
- 75$40,000 to $49,999
- 207$50,000 to $59,999
- 184$60,000 to $69,999
- 216$70,000 to $79,999
- 227$80,000 to $89,999
- 114$90,000 to $99,999
- 457$100,000 to $124,999
- 372$125,000 to $149,999
- 571$150,000 to $174,999
- 321$175,000 to $199,999
- 1,205$200,000 to $249,999
- 1,709$250,000 to $299,999
- 4,505$300,000 to $399,999
- 3,253$400,000 to $499,999
- 3,805$500,000 to $749,999
- 1,499$750,000 to $999,999
- 360$1,000,000 to $1,499,999
- 72$1,500,000 to $1,999,999
- 149$2,000,000 or more
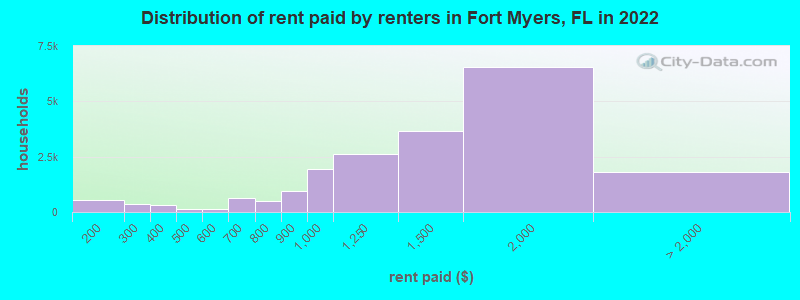
Rent paid by renters in 2022 in Fort Myers, FL
-
- 44Less than $100
- 524$150 to $199
- 267$200 to $249
- 84$250 to $299
- 315$350 to $399
- 40$400 to $449
- 108$450 to $499
- 122$550 to $599
- 576$600 to $649
- 66$650 to $699
- 296$700 to $749
- 218$750 to $799
- 937$800 to $899
- 1,945$900 to $999
- 2,609$1,000 to $1,249
- 3,649$1,250 to $1,499
- 6,562$1,500 to $1,999
- 770$2,000 to $2,499
- 119$2,500 to $2,999
- 216$3,000 to $3,499
- 151$3,500 or more
- 565No cash rent
Percentage of workers working in this county: 90.8%
Number of people working at home: 5,175 (12.8% of all workers)
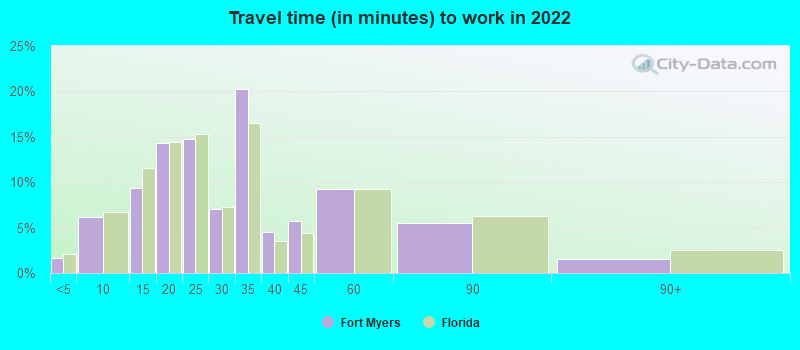
Travel time to work (commute)
- Less than 5 minutes: 621
- 5 to 9 minutes: 3,312
- 10 to 14 minutes: 4,117
- 15 to 19 minutes: 4,663
- 20 to 24 minutes: 6,770
- 25 to 29 minutes: 3,836
- 30 to 34 minutes: 4,767
- 35 to 39 minutes: 1,084
- 40 to 44 minutes: 2,366
- 45 to 59 minutes: 2,548
- 60 to 89 minutes: 1,511
- 90 or more minutes: 426
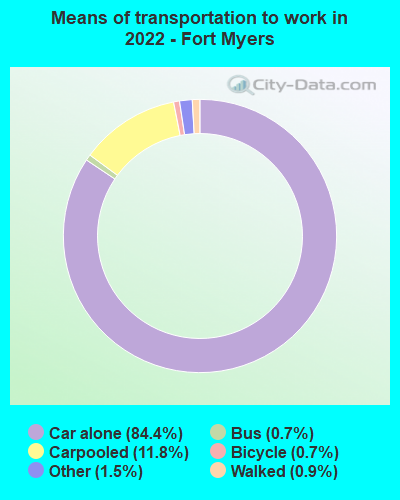
Means of transportation to work:
- Drove a car alone: 62,585 (75.6%)
- Carpooled: 10,708 (12.9%)
- Bus: 655 (0.8%)
- Long-distance train or commuter rail: 12 (0.0%)
- Taxi: 770 (0.9%)
- Bicycle: 311 (0.4%)
- Walked: 731 (0.9%)
- Worked at home: 5,175 (6.3%)
- Unemployment by race in 2022
- Unemployment rate for White non-Hispanic residents
- 0.8%Males
- 4.0%Females
- Unemployment rate for Black residents
- 4.9%Males
- 11.0%Females
- Unemployment rate for American Indian and Alaska Native residents
- 4.9%Males
- Unemployment rate for Asian residents
- 1.4%Males
- Unemployment rate for other race residents
- 0.2%Females
- Unemployment rate for two or more race residents
- 0.2%Males
- 5.9%Females
- Unemployment rate for Hispanic or Latino residents
- 3.0%Males
- 4.5%Females
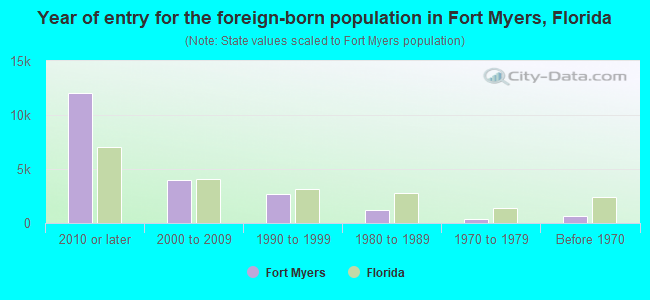
- Year of entry for the foreign-born population in Fort Myers, Florida
- 12,0322010 or later
- 3,9752000 to 2009
- 2,7121990 to 1999
- 1,2281980 to 1989
- 3631970 to 1979
- 637Before 1970
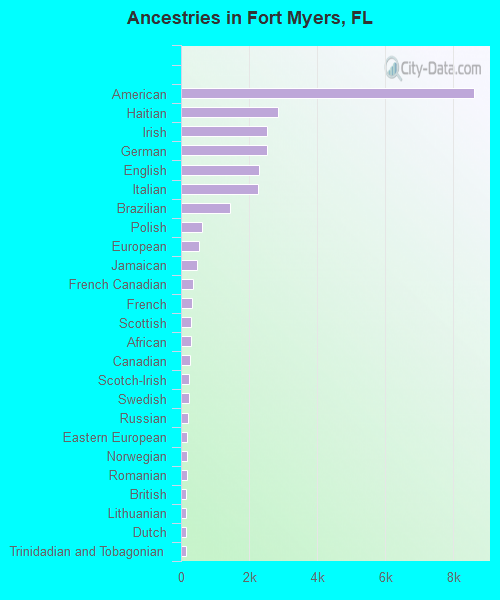
First ancestries reported:
- American: 8,616 (15.7%)
- Haitian: 2,850 (5.2%)
- Irish: 2,534 (4.6%)
- German: 2,521 (4.6%)
- English: 2,304 (4.2%)
- Italian: 2,265 (4.1%)
- Brazilian: 1,451 (2.6%)
- Polish: 606 (1.1%)
- European: 535 (1.0%)
- Jamaican: 481 (0.9%)
- French Canadian: 348 (0.6%)
- French: 319 (0.6%)
- Scottish: 305 (0.6%)
- African: 299 (0.5%)
- Canadian: 251 (0.5%)
- Scotch-Irish: 240 (0.4%)
- Swedish: 229 (0.4%)
- Russian: 199 (0.4%)
- Eastern European: 184 (0.3%)
- Norwegian: 184 (0.3%)
- Romanian: 171 (0.3%)
- British: 161 (0.3%)
- Lithuanian: 160 (0.3%)
- Dutch: 145 (0.3%)
- Trinidadian and Tobagonian: 144 (0.3%)
- Portuguese: 138 (0.3%)
- Lebanese: 128 (0.2%)
- Hungarian: 90 (0.2%)
- Austrian: 89 (0.2%)
- Yugoslavian: 88 (0.2%)
- South African: 87 (0.2%)
- Northern European: 86 (0.2%)
- Greek: 75 (0.1%)
- Danish: 73 (0.1%)
- Swiss: 65 (0.1%)
- Israeli: 61 (0.1%)
- Czech: 60 (0.1%)
- Scandinavian: 59 (0.1%)
- Bahamian: 51 (0.09%)
- British West Indian: 45 (0.08%)
- Slovak: 40 (0.07%)
- Zimbabwean: 37 (0.07%)
- Albanian: 34 (0.06%)
- Ukrainian: 34 (0.06%)
- Egyptian: 31 (0.06%)
- Moroccan: 29 (0.05%)
- Nigerian: 28 (0.05%)
- Kenyan: 27 (0.05%)
- Guyanese: 22 (0.04%)
- Welsh: 13 (0.02%)
- Slavic: 12 (0.02%)
- Czechoslovakian: 11 (0.02%)
- Finnish: 9 (0.02%)
- Maltese: 9 (0.02%)
- Serbian: 9 (0.02%)
- Slovene: 9 (0.02%)
- Iranian: 9 (0.02%)
- Palestinian: 7 (0.01%)
- Pennsylvania German: 6 (0.01%)
- Belizean: 5 (0.01%)
- Croatian: 4 (0.01%)
- Celtic: 4 (0.01%)
- West Indian: 4 (0.01%)
Most common places of birth for foreign-born residents (%):
| Fort Myers: | 15.1% (2,879) |
| Florida: | 7.5% (342,375) |
| Fort Myers: | 15.0% (2,856) |
| Florida: | 2.1% (97,632) |
| Fort Myers: | 10.5% (1,997) |
| Florida: | 22.0% (1,006,576) |
| Fort Myers: | 10.1% (1,911) |
| Florida: | 5.6% (257,152) |
| Fort Myers: | 8.0% (1,524) |
| Florida: | 2.7% (122,906) |
| Fort Myers: | 4.2% (799) |
| Florida: | 2.4% (109,132) |
| Fort Myers: | 3.6% (691) |
| Florida: | 2.3% (107,160) |
| Fort Myers: | 3.4% (647) |
| Florida: | 3.0% (137,727) |
| Fort Myers: | 3.1% (594) |
| Florida: | 5.0% (227,319) |
| Fort Myers: | 2.4% (450) |
| Florida: | 6.5% (298,669) |
| Fort Myers: | 2.1% (395) |
| Florida: | 5.7% (262,042) |
| Fort Myers: | 1.7% (317) |
| Florida: | 1.2% (54,272) |
| Fort Myers: | 1.5% (294) |
| Florida: | 2.3% (105,066) |
Place of birth for U.S.-born residents:
- This state: 25,777
- Other state: 43,856
- Northeast: 17,355
- Midwest: 15,046
- South: 10,010
- West: 1,445
83.7% of Fort Myers residents lived in the same house 1 years ago.
Out of people who lived in different houses, 30.0% lived in this county.
Out of people who lived in different counties, 29.8% lived in Florida.
| Fort Myers: | 83.7% |
| State average: | 86.3% |
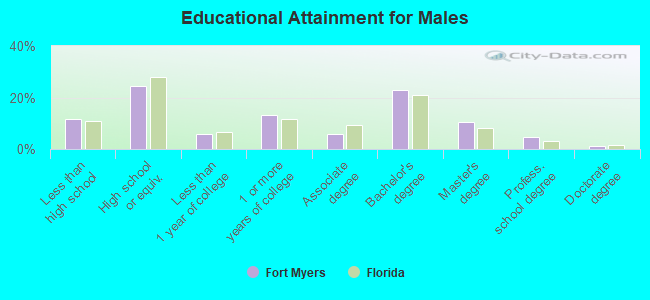
Education attainment for males 25 years and older:
- No schooling: 264
- Nursery to 4th grade: 124
- 5th and 6th grade: 795
- 7th and 8th grade: 49
- 9th grade: 462
- 10th grade: 802
- 11th grade: 777
- 12th grade, no diploma: 506
- High school graduate (or equivalency): 7,876
- Less than 1 year of college: 1,858
- Some college more than 1 year, no degree: 4,271
- Associate degree: 1,914
- Bachelor's degree: 7,449
- Master's degree: 3,352
- Professional school degree: 1,492
- Doctorate degree: 357
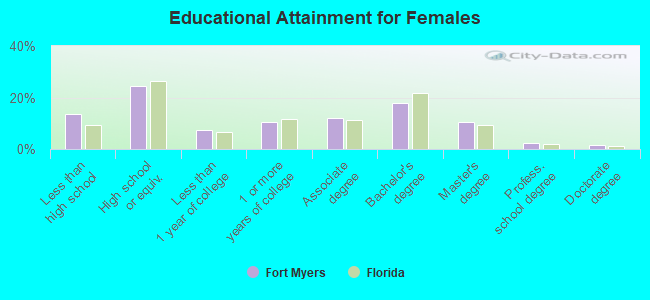
Education attainment for females 25 years and older:
- No schooling: 353
- Nursery to 4th grade: 312
- 5th and 6th grade: 305
- 7th and 8th grade: 549
- 9th grade: 996
- 10th grade: 603
- 11th grade: 1,562
- 12th grade, no diploma: 586
- High school graduate (or equivalency): 9,517
- Less than 1 year of college: 2,823
- Some college more than 1 year, no degree: 4,030
- Associate degree: 4,714
- Bachelor's degree: 6,986
- Master's degree: 4,103
- Professional school degree: 931
- Doctorate degree: 681
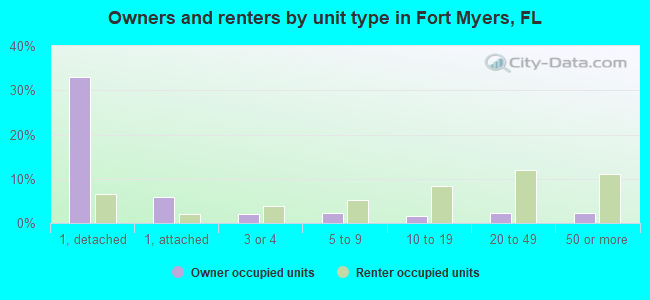
Housing units in structures:
- One, detached: 18,618
- One, attached: 7,281
- Two: 1,863
- 3 or 4: 3,157
- 5 to 9: 2,449
- 10 to 19: 4,769
- 20 to 49: 6,654
- 50 or more: 5,765
- Mobile homes: 624
Median worth of mobile homes: $171,300
Housing units lacking complete kitchen facilities in 2022: 2.3%
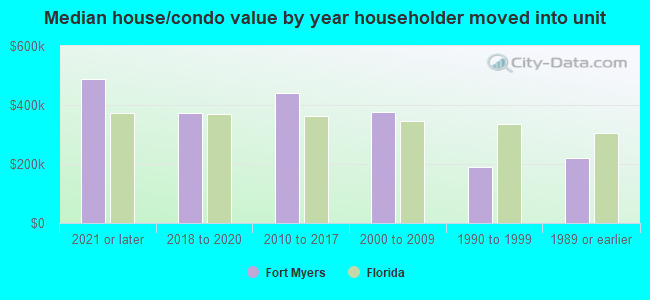
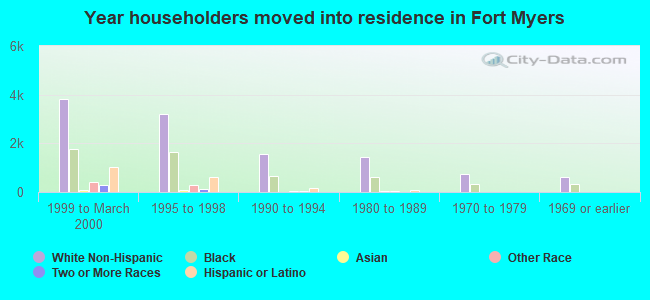
House/condo owner moved in on average 4 years ago
Renter moved in on average 2 years ago
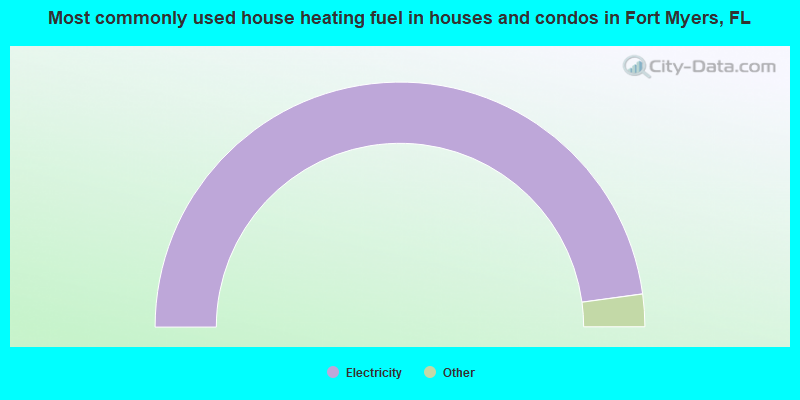
- 95.7%Electricity
- 1.8%No fuel used
- 1.7%Utility gas
- 0.6%Bottled, tank, or LP gas
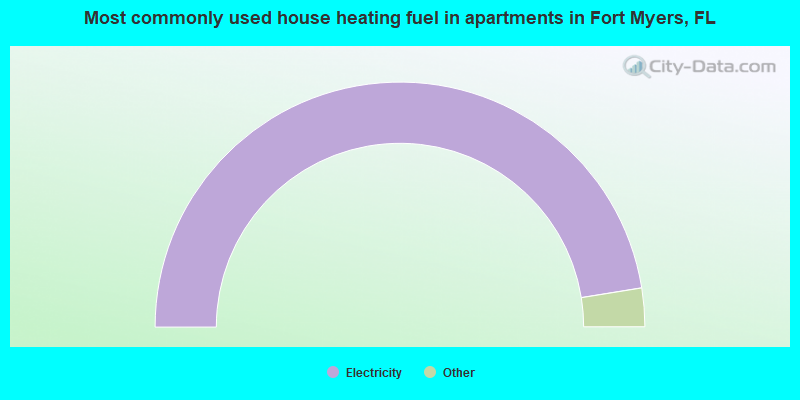
- 94.9%Electricity
- 2.2%No fuel used
- 2.2%Utility gas
- 0.4%Bottled, tank, or LP gas
- 0.2%Fuel oil, kerosene, etc.
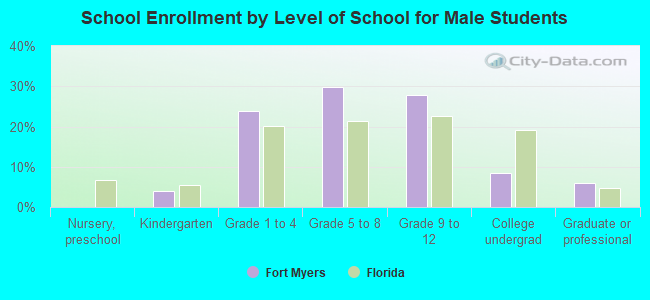
Private vs. public school enrollment:
| Here: | 16.9% |
| Florida: | 15.8% |
| Here: | 0.1% |
| Florida: | 12.9% |
| Here: | 26.3% |
| Florida: | 23.6% |