Fort Morgan, CO (Colorado) Houses and Residents
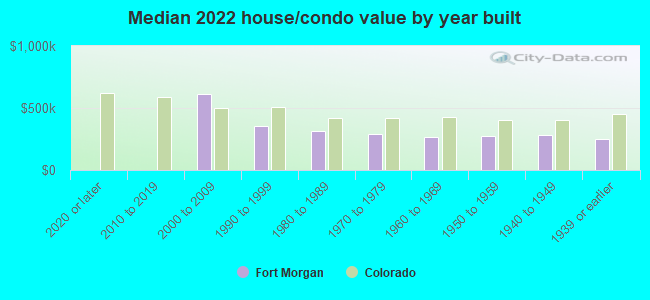
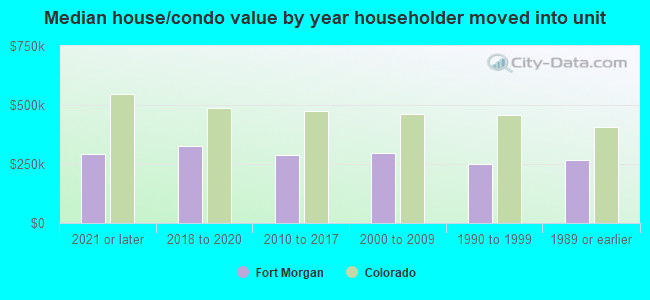
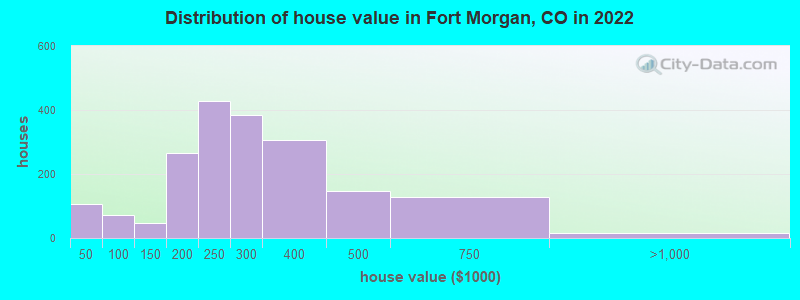
Estimated median house or condo value in 2022: $286,126 (it was $91,000 in 2000 )
Fort Morgan:
$286,126Colorado:
$531,100
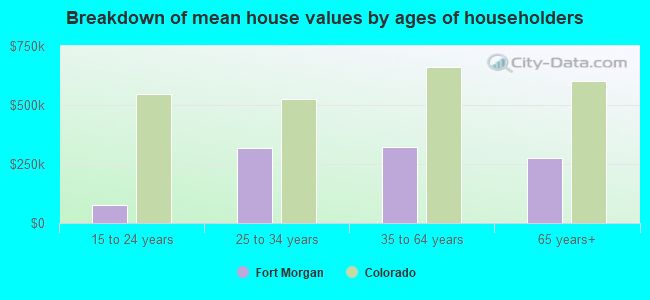
Lower value quartile - upper value quartile: $227,264 - $338,575Mean price in 2022: Detached houses: $252,219 Here:
$252,219State:
$676,667
Townhouses or other attached units: $294,776 Here:
$294,776State:
$526,340
In 2-unit structures: $317,820 Here:
$317,820State:
$431,509
Mobile homes: $24,068 Here:
$24,068State:
$115,510
Total population: 11,329 (Urban population: 11,051 (all inside urban clusters), Rural population: 0)
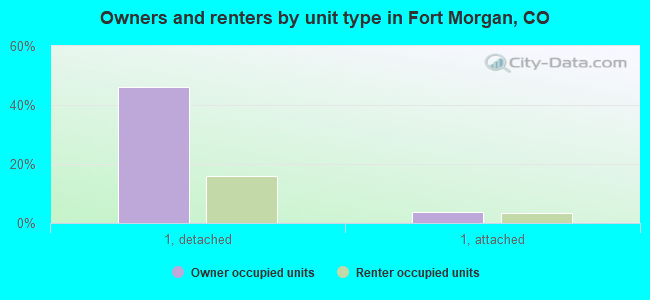
Houses: 4,671 (4,477 occupied: 2,483 owner occupied, 2,040 renter occupied )
% of renters here:
45%State:
34%
Housing density: 1,047 houses/condos per square mile
Median price asked for vacant for-sale houses and condos in 2022 in this county: $2,797,097.
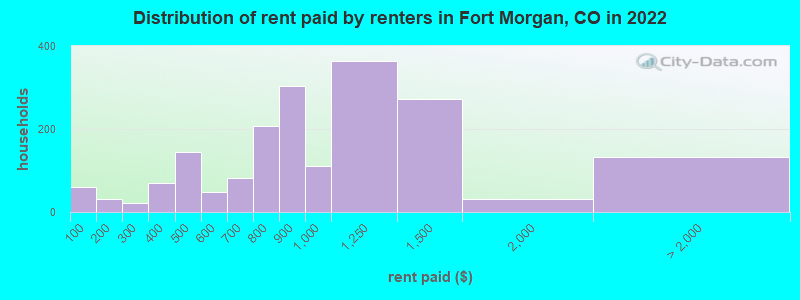
Median contract rent in 2022: $904 (lower quartile is $686, upper quartile is $1,175)
Median rent asked for vacant for-rent units in 2022: $1,219
Median gross rent in Fort Morgan, CO in 2022: $1,078
Housing units in Fort Morgan with a mortgage: 1,514 (188 second mortgage, 0 home equity loan, 129 both second mortgage and home equity loan )Houses without a mortgage: 0
Median household income for houses/condos with a mortgage: $81,372
Median household income for apartments without a mortgage: $69,739
Median monthly housing costs: $1,097
Data:
Median house or condo value ($)
Median house or condo value ($ change since 2000)
Median house or condo value ($) - White
Median house or condo value ($) - Black or African American
Median house or condo value ($) - Asian
Median house or condo value ($) - Hispanic or Latino
Median house or condo value ($) - American Indian and Alaska Native
Median house or condo value ($) - Multirace
Median house or condo value ($) - Other Race
Median price asked for mobile homes ($)
Household density (households per square mile)
Mean house or condo value by units in structure - 1, detached ($)
Mean house or condo value by units in structure - 1, attached ($)
Mean house or condo value by units in structure - 2 ($)
Mean house or condo value by units in structure by units in structure - 3 or 4 ($)
Mean house or condo value by units in structure - 5 or more ($)
Mean house or condo value by units in structure - Boat, RV, van, etc. ($)
Mean house or condo value by units in structure - Mobile home ($)
Median contract rent ($)
Median contract rent - Lower quartile ($)
Median contract rent - Upper quartile ($)
Median gross rent ($)
Urban houses (%)
Rural houses (%)
Houses occupied (%)
Houses occupied (% change since 2000)
Houses owner occupied (%)
Houses owner occupied (% change since 2000)
Houses renter occupied (%)
Houses renter occupied (% change since 2000)
Vacant housing units - For rent (%)
Vacant housing units - For rent (% change since 2000)
Vacant housing units - For sale only (%)
Vacant housing units - For sale only (% change since 2000)
Vacant housing units - Rented or sold, not occupied (%)
Vacant housing units - Rented or sold, not occupied (% change since 2000)
Vacant housing units - For seasonal, recreational, or occasional use (%)
Vacant housing units - For seasonal, recreational, or occasional use (% change since 2000)
Vacant housing units - For migrant workers (%)
Vacant housing units - For migrant workers (% change since 2000)
Vacant housing units - Other vacant (%)
Vacant housing units - Other vacant (% change since 2000)
Median monthly housing costs ($)
Median household income for houses/condos with a mortgage ($)
Median household income for houses/condos without a mortgage ($)
Median household income ($)
Median household income ($) - White
Median household income ($) - Black or African American
Median household income ($) - Asian
Median household income ($) - Hispanic or Latino
Median household income ($) - American Indian and Alaska Native
Median household income ($) - Multirace
Median household income ($) - Other Race
Mortgage status - with mortgage (%)
Mortgage status - with second mortgage (%)
Mortgage status - with home equity loan (%)
Mortgage status - with both second mortgage and home equity loan (%)
Mortgage status - without a mortgage (%)
Median year house/condo built
Median year apartment built
Household type by relationship - Male householder living alone (%)
Household type by relationship - Male householder not living alone (%)
Household type by relationship - Female householder living alone (%)
Household type by relationship - Female householder not living alone (%)
Household type by relationship - Opposite-Sex spouse (%)
Household type by relationship - Same-Sex spouse (%)
Household type by relationship - Opposite-Sex unmarried partner (%)
Household type by relationship - Same-Sex unmarried partner (%)
Household type by relationship - In group quarters (%)
Size of family households - 2-person household (%)
Size of family households - 3-person household (%)
Size of family households - 4-person household (%)
Size of family households - 5-person household (%)
Size of family households - 6-person household (%)
Size of family households - 7-or-more-person household (%)
Size of nonfamily households - 1-person household (%)
Size of nonfamily households - 2-person household (%)
Size of nonfamily households - 3-person household (%)
Size of nonfamily households - 4-person household (%)
Size of nonfamily households - 5-person household (%)
Size of nonfamily households - 6-person household (%)
Size of nonfamily households - 7-or-moreperson household (%)
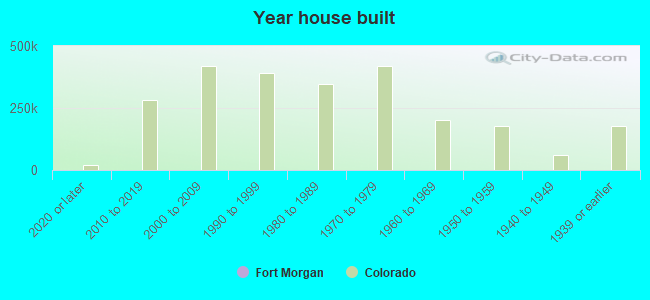
Year house built - Built 2010 or later (%)
Year house built - Built 2000 to 2009 (%)
Year house built - Built 1990 to 1999 (%)
Year house built - Built 1980 to 1989 (%)
Year house built - Built 1970 to 1979 (%)
Year house built - Built 1960 to 1969 (%)
Year house built - Built 1950 to 1959 (%)
Year house built - Built 1940 to 1949 (%)
Year house built - Built 1939 or earlier (%)
Median number of rooms in houses and condos
Median number of rooms in apartments
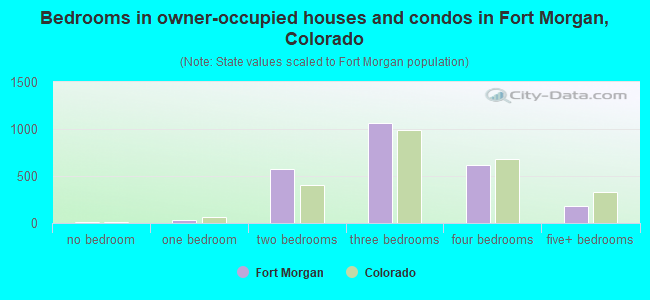
Median number of bedrooms in owner occupied houses
Mean number of bedrooms in owner occupied houses
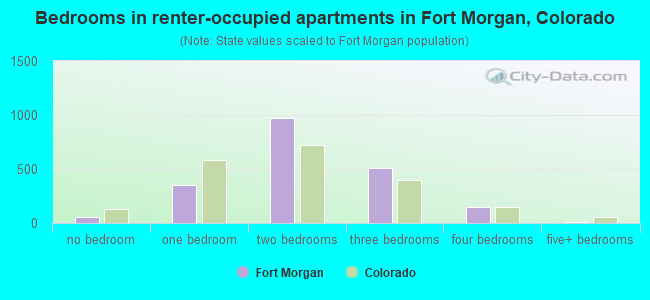
Median number of bedrooms in renter occupied houses
Mean number of bedrooms in renter occupied houses
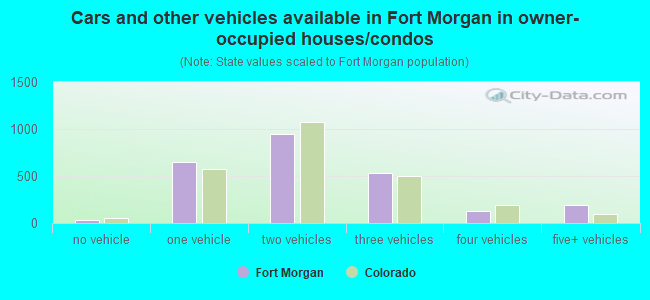
Median number of vehichles in owner occupied houses
Mean number of vehichles in owner occupied houses
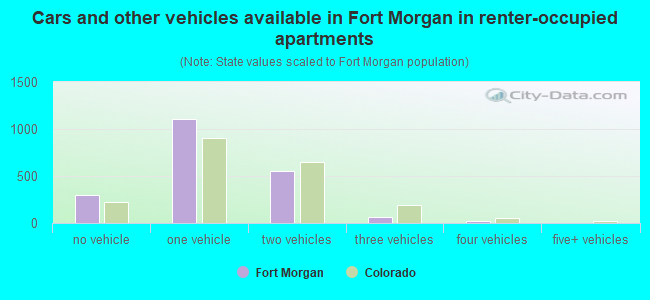
Median number of vehichles in renter occupied houses
Mean number of vehichles in renter occupied houses
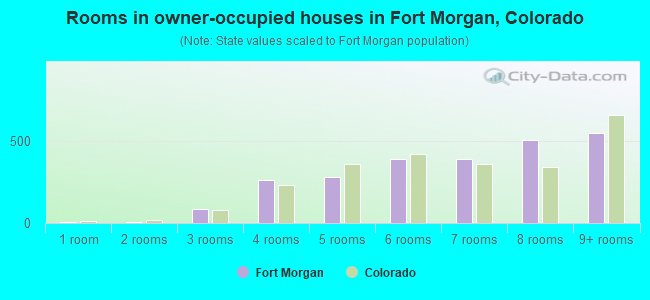
Rooms in owner-occupied houses - 1 room (%)
Rooms in owner-occupied houses - 2 rooms (%)
Rooms in owner-occupied houses - 3 rooms (%)
Rooms in owner-occupied houses - 4 rooms (%)
Rooms in owner-occupied houses - 5 rooms (%)
Rooms in owner-occupied houses - 6 rooms (%)
Rooms in owner-occupied houses - 7 rooms (%)
Rooms in owner-occupied houses - 8 rooms (%)
Rooms in owner-occupied houses - 9+ rooms (%)
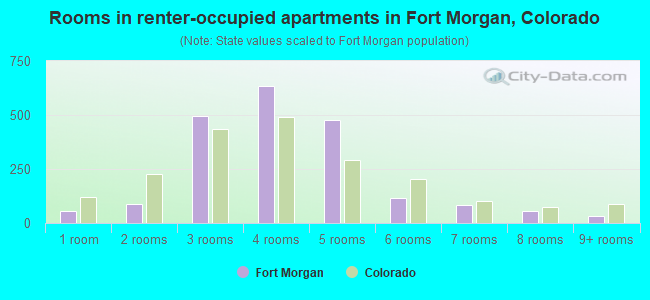
Rooms in renter-occupied houses - 1 room (%)
Rooms in renter-occupied houses - 2 rooms (%)
Rooms in renter-occupied houses - 3 rooms (%)
Rooms in renter-occupied houses - 4 rooms (%)
Rooms in renter-occupied houses - 5 rooms (%)
Rooms in renter-occupied houses - 6 rooms (%)
Rooms in renter-occupied houses - 7 rooms (%)
Rooms in renter-occupied houses - 8 rooms (%)
Rooms in renter-occupied houses - 9+ rooms (%)
Bedrooms in owner-occupied houses - no bedrooms (%)
Bedrooms in owner-occupied houses - 1 bedroom (%)
Bedrooms in owner-occupied houses - 2 bedrooms (%)
Bedrooms in owner-occupied houses - 3 bedrooms (%)
Bedrooms in owner-occupied houses - 4 bedrooms (%)
Bedrooms in owner-occupied houses - 5+ bedrooms (%)
Bedrooms in renter-occupied houses - no bedrooms (%)
Bedrooms in renter-occupied houses - 1 bedroom (%)
Bedrooms in renter-occupied houses - 2 bedrooms (%)
Bedrooms in renter-occupied houses - 3 bedrooms (%)
Bedrooms in renter-occupied houses - 4 bedrooms (%)
Bedrooms in renter-occupied houses - 5+ bedrooms (%)
Vehicles available in owner-occupied houses - no vehicle available (%)
Vehicles available in owner-occupied houses - 1 vehicle available(%)
Vehicles available in owner-occupied houses - 2 Vehicles available (%)
Vehicles available in owner-occupied houses - 3 Vehicles available (%)
Vehicles available in owner-occupied houses - 4 Vehicles available (%)
Vehicles available in owner-occupied houses - 5+ Vehicles available (%)
Vehicles available in renter-occupied houses - no vehicle available (%)
Vehicles available in renter-occupied houses - 1 vehicle available (%)
Vehicles available in renter-occupied houses - 2 Vehicles available (%)
Vehicles available in renter-occupied houses - 3 Vehicles available (%)
Vehicles available in renter-occupied houses - 4 Vehicles available (%)
Vehicles available in renter-occupied houses - 5+ Vehicles available (%)
Housing units in structures - 1, detached (%)
Housing units in structures - 1, attached (%)
Housing units in structures - 2 (%)
Housing units in structures - 3 or 4 (%)
Housing units in structures - 5 to 9 (%)
Housing units in structures - 10 to 19 (%)
Housing units in structures - 20 to 49 (%)
Housing units in structures - 50 or more (%)
Housing units in structures - Mobile home (%)
Housing units in structures - Boat, RV, van, etc. (%)
Housing units in structures - Owners - 1, detached (%)
Housing units in structures - Owners - 1, attached (%)
Housing units in structures - Owners - 2 (%)
Housing units in structures - Owners - 3 or 4 (%)
Housing units in structures - Owners - 5 to 9 (%)
Housing units in structures - Owners - 10 to 19 (%)
Housing units in structures - Owners - 20 to 49 (%)
Housing units in structures - Owners - 50 or more (%)
Housing units in structures - Owners - Mobile home (%)
Housing units in structures - Owners - Boat, RV, van, etc. (%)
Housing units in structures - Renters - 1, detached (%)
Housing units in structures - Renters - 1, attached (%)
Housing units in structures - Renters - 2 (%)
Housing units in structures - Renters - 3 or 4 (%)
Housing units in structures - Renters - 5 to 9 (%)
Housing units in structures - Renters - 10 to 19 (%)
Housing units in structures - Renters - 20 to 49 (%)
Housing units in structures - Renters - 50 or more (%)
Housing units in structures - Renters - Mobile home (%)
Housing units in structures - Renters - Boat, RV, van, etc. (%)
House/condo owner moved in on average (years ago)
Renter moved in on average (years ago)
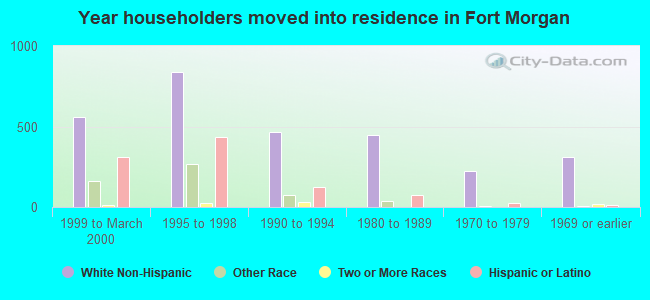
Year householder moved into unit - Moved in 1999 to March 2000 (%)
Year householder moved into unit - Moved in 1999 to March 2000 (%) - White
Year householder moved into unit - Moved in 1999 to March 2000 (%) - Black or African American
Year householder moved into unit - Moved in 1999 to March 2000 (%) - Asian
Year householder moved into unit - Moved in 1999 to March 2000 (%) - Hispanic or Latino
Year householder moved into unit - Moved in 1999 to March 2000 (%) - American Indian and Alaska Native
Year householder moved into unit - Moved in 1999 to March 2000 (%) - Multirace
Year householder moved into unit - Moved in 1999 to March 2000 (%) - Other Race
Year householder moved into unit - Moved in 1995 to 1998 (%)
Year householder moved into unit - Moved in 1995 to 1998 (%) - White
Year householder moved into unit - Moved in 1995 to 1998 (%) - Black or African American
Year householder moved into unit - Moved in 1995 to 1998 (%) - Asian
Year householder moved into unit - Moved in 1995 to 1998 (%) - Hispanic or Latino
Year householder moved into unit - Moved in 1995 to 1998 (%) - American Indian and Alaska Native
Year householder moved into unit - Moved in 1995 to 1998 (%) - Multirace
Year householder moved into unit - Moved in 1995 to 1998 (%) - Other Race
Year householder moved into unit - Moved in 1990 to 1994 (%)
Year householder moved into unit - Moved in 1990 to 1994 (%) - White
Year householder moved into unit - Moved in 1990 to 1994 (%) - Black or African American
Year householder moved into unit - Moved in 1990 to 1994 (%) - Asian
Year householder moved into unit - Moved in 1990 to 1994 (%) - Hispanic or Latino
Year householder moved into unit - Moved in 1990 to 1994 (%) - American Indian and Alaska Native
Year householder moved into unit - Moved in 1990 to 1994 (%) - Multirace
Year householder moved into unit - Moved in 1990 to 1994 (%) - Other Race
Year householder moved into unit - Moved in 1980 to 1989 (%)
Year householder moved into unit - Moved in 1980 to 1989 (%) - White
Year householder moved into unit - Moved in 1980 to 1989 (%) - Black or African American
Year householder moved into unit - Moved in 1980 to 1989 (%) - Asian
Year householder moved into unit - Moved in 1980 to 1989 (%) - Hispanic or Latino
Year householder moved into unit - Moved in 1980 to 1989 (%) - American Indian and Alaska Native
Year householder moved into unit - Moved in 1980 to 1989 (%) - Multirace
Year householder moved into unit - Moved in 1980 to 1989 (%) - Other Race
Year householder moved into unit - Moved in 1970 to 1979 (%)
Year householder moved into unit - Moved in 1970 to 1979 (%) - White
Year householder moved into unit - Moved in 1970 to 1979 (%) - Black or African American
Year householder moved into unit - Moved in 1970 to 1979 (%) - Asian
Year householder moved into unit - Moved in 1970 to 1979 (%) - Hispanic or Latino
Year householder moved into unit - Moved in 1970 to 1979 (%) - American Indian and Alaska Native
Year householder moved into unit - Moved in 1970 to 1979 (%) - Multirace
Year householder moved into unit - Moved in 1970 to 1979 (%) - Other Race
Year householder moved into unit - Moved in 1969 or earlier (%)
Year householder moved into unit - Moved in 1969 or earlier (%) - White
Year householder moved into unit - Moved in 1969 or earlier (%) - Black or African American
Year householder moved into unit - Moved in 1969 or earlier (%) - Asian
Year householder moved into unit - Moved in 1969 or earlier (%) - Hispanic or Latino
Year householder moved into unit - Moved in 1969 or earlier (%) - American Indian and Alaska Native
Year householder moved into unit - Moved in 1969 or earlier (%) - Multirace
Year householder moved into unit - Moved in 1969 or earlier (%) - Other Race
Housing units lacking complete plumbing facilities (%)
Housing units lacking complete kitchen facilities (%)
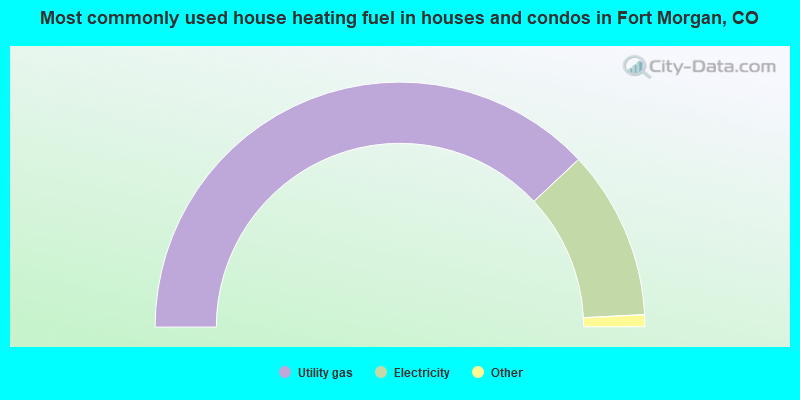
House heating fuel used in houses and condos - Utility gas (%)
House heating fuel used in houses and condos - Bottled, tank, or LP gas (%)
House heating fuel used in houses and condos - Electricity (%)
House heating fuel used in houses and condos - Fuel oil, kerosene, etc. (%)
House heating fuel used in houses and condos - Coal or coke (%)
House heating fuel used in houses and condos - Wood (%)
House heating fuel used in houses and condos - Solar energy (%)
House heating fuel used in houses and condos - Other fuel (%)
House heating fuel used in houses and condos - No fuel used (%)
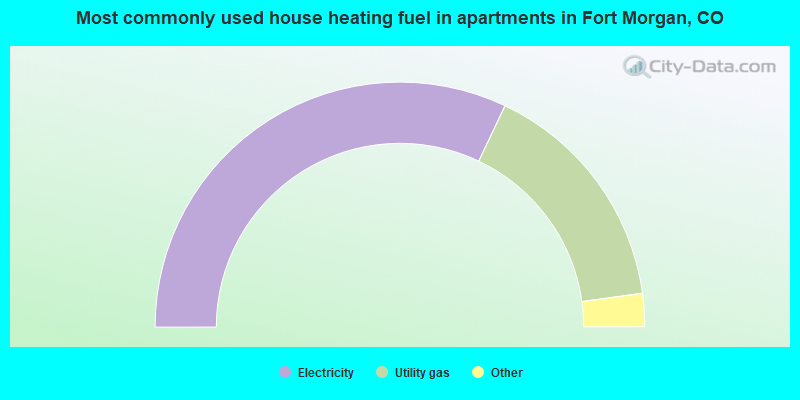
House heating fuel used in apartments - Utility gas (%)
House heating fuel used in apartments - Bottled, tank, or LP gas (%)
House heating fuel used in apartments - Electricity (%)
House heating fuel used in apartments - Fuel oil, kerosene, etc. (%)
House heating fuel used in apartments - Coal or coke (%)
House heating fuel used in apartments - Wood (%)
House heating fuel used in apartments - Solar energy (%)
House heating fuel used in apartments - Other fuel (%)
House heating fuel used in apartments - No fuel used (%)
Median year house/condo built: 1960Median year apartment built: 1975Household type by relationship:
Households: 11,638
Male householders: 1,982 (486 living alone ), Female householders: 2,391 (926 living alone )2,033 spouses (2,016 opposite-sex spouses ), 196 unmarried partners , (188 opposite-sex unmarried partners ), 3,554 children (3,481 natural , 45 adopted , 27 stepchildren ), 285 grandchildren , 42 brothers or sisters , 166 parents , 0 foster children , 499 other relatives , 252 non-relatives In group quarters: 233
Size of family households: 953 2-persons , 523 3-persons , 770 4-persons , 327 5-persons , 86 6-persons , 108 7-or-more-persons .
Size of nonfamily households: 1,485 1-person , 166 2-persons , 31 3-persons , 33 5-persons .
1,513 married couples with children. single-parent households (297 men , 796 women ).
70.2% of residents of Fort Morgan speak English at home. of residents speak Spanish at home (53% speak English very well , 24% speak English well , 14% speak English not well , 9% don't speak English at all ).of residents speak other Indo-European language at home (100% speak English very well ).of residents speak Asian or Pacific Island language at home (100% speak English very well ).of residents speak other language at home (33% speak English very well , 14% speak English well , 23% speak English not well , 31% don't speak English at all ).
Foreign born population: 2,292 (19.7%)of them are naturalized citizens )
Median number of rooms in houses and condos:
Median number of rooms in apartments
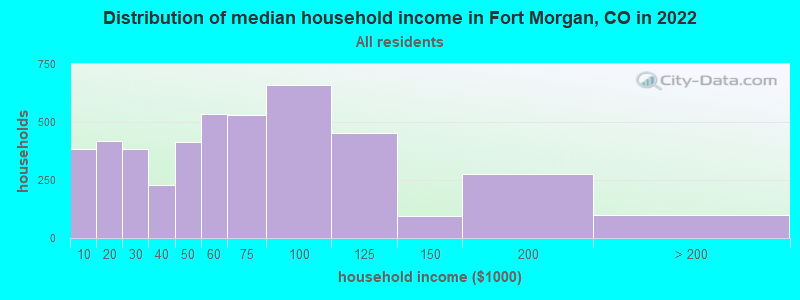
Fort Morgan, CO household income distribution 385 Less than $10,000416 $10,000 to $19,999384 $20,000 to $29,999227 $30,000 to $39,999412 $40,000 to $49,999534 $50,000 to $59,999529 $60,000 to $74,999661 $75,000 to $99,999453 $100,000 to $124,99996 $125,000 to $149,999278 $150,000 to $199,99997 $200,000 or more
Home value of owner - occupied houses in 2022 in Fort Morgan, CO 41 Less than $10,00060 $15,000 to $19,9994 $20,000 to $24,99911 $50,000 to $59,99931 $70,000 to $79,99927 $90,000 to $99,99910 $100,000 to $124,99936 $125,000 to $149,999162 $150,000 to $174,999102 $175,000 to $199,999427 $200,000 to $249,999385 $250,000 to $299,999305 $300,000 to $399,999146 $400,000 to $499,999127 $500,000 to $749,99916 $750,000 to $999,999Rent paid by renters in 2022 in Fort Morgan, CO 61 Less than $1009 $100 to $14922 $150 to $19921 $250 to $29970 $350 to $39944 $400 to $449100 $450 to $49932 $500 to $54917 $550 to $59933 $600 to $64947 $650 to $69992 $700 to $749113 $750 to $799303 $800 to $899111 $900 to $999364 $1,000 to $1,249272 $1,250 to $1,49930 $1,500 to $1,9999 $2,000 to $2,49911 $3,500 or more110 No cash rent
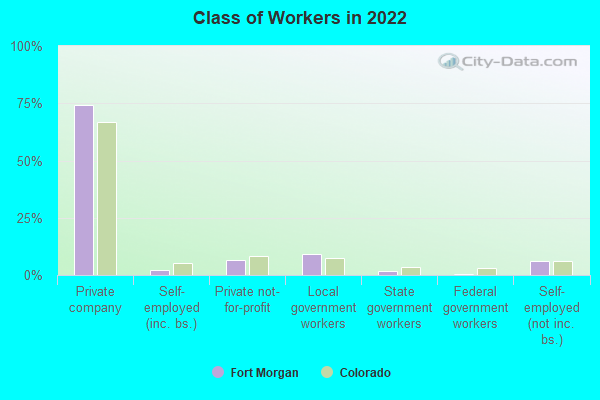
Percentage of workers working in this county: 92.5%Number of people working at home: 282 (5.2% of all workers )
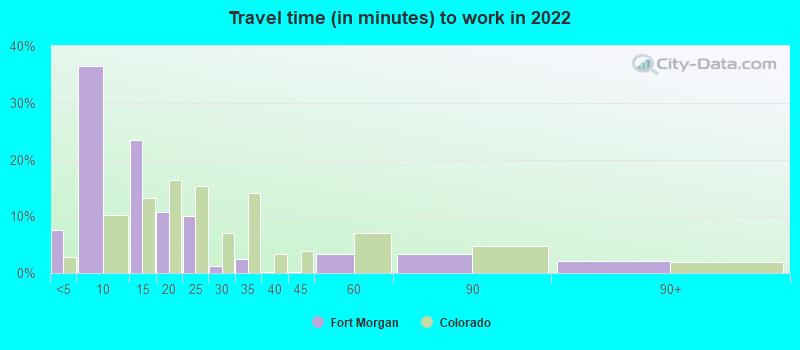
Travel time to work (commute)
Less than 5 minutes: 3555 to 9 minutes: 1,89710 to 14 minutes: 92315 to 19 minutes: 65520 to 24 minutes: 41825 to 29 minutes: 4930 to 34 minutes: 10635 to 39 minutes: 040 to 44 minutes: 045 to 59 minutes: 18960 to 89 minutes: 14590 or more minutes: 180
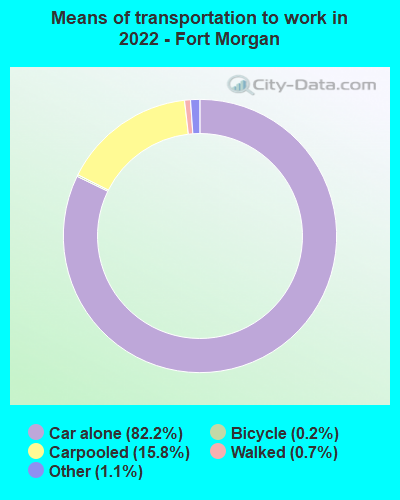
Means of transportation to work:
Drove a car alone: 5,027 (74.9%)Carpooled: 1,006 (15.0%)Taxi: 75 (1.1%)Bicycle: 13 (0.2%)Walked: 42 (0.6%)Worked at home: 282 (4.2%)
Unemployment by race in 2022
Unemployment rate for White non-Hispanic residents 5.3% Males0.7% FemalesUnemployment rate for Black residents 10.9% FemalesUnemployment rate for American Indian and Alaska Native residents 72.8% FemalesUnemployment rate for other race residents 10.2% MalesUnemployment rate for two or more race residents 3.9% MalesUnemployment rate for Hispanic or Latino residents 5.8% Males1.1% Females
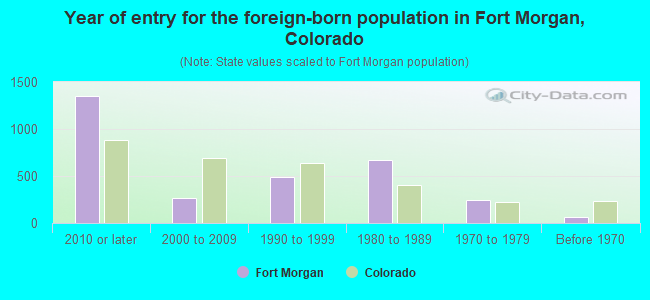
Year of entry for the foreign-born population in Fort Morgan, Colorado
1,351 2010 or later 263 2000 to 2009 492 1990 to 1999 670 1980 to 1989 240 1970 to 1979 67 Before 1970
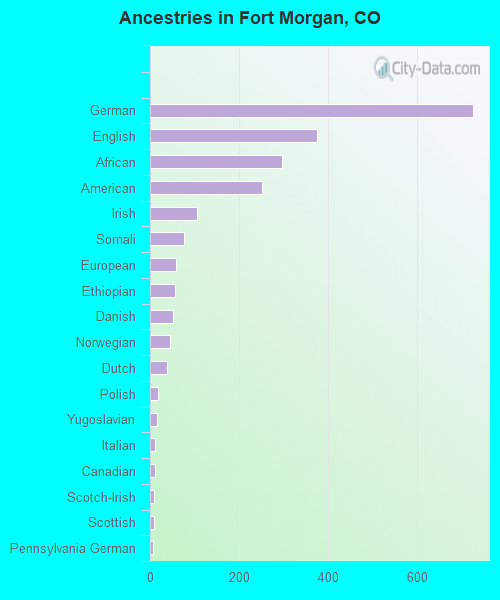
First ancestries reported:
German: 725 (10.4%)
English: 375 (5.4%)
African: 297 (4.3%)
American: 251 (3.6%)
Irish: 105 (1.5%)
Somali: 77 (1.1%)
European: 58 (0.8%)
Ethiopian: 57 (0.8%)
Danish: 51 (0.7%)
Norwegian: 45 (0.6%)
Dutch: 38 (0.5%)
Polish: 17 (0.2%)
Yugoslavian: 15 (0.2%)
Italian: 12 (0.2%)
Canadian: 11 (0.2%)
Scotch-Irish: 9 (0.1%)
Scottish: 8 (0.1%)
Pennsylvania German: 7 (0.1%)
Northern European: 5 (0.07%)
Welsh: 5 (0.07%)
Iranian: 4 (0.06%) Most common places of birth for foreign-born residents (%): Guatemala Fort Morgan:
36.1% (827)Colorado:
1.4% (7,898)
Mexico Fort Morgan:
34.0% (780)Colorado:
38.3% (209,491)
Kenya Fort Morgan:
4.3% (98)Colorado:
0.4% (2,427)
Somalia Fort Morgan:
3.2% (74)Colorado:
0.2% (1,243)
Ethiopia Fort Morgan:
2.7% (63)Colorado:
1.9% (10,372)
El Salvador Fort Morgan:
2.4% (56)Colorado:
2.2% (12,150)
Other Southern Africa Fort Morgan:
2.2% (51)Colorado:
0.0% (127)
Ecuador Fort Morgan:
1.7% (40)Colorado:
0.3% (1,778)
Eritrea Fort Morgan:
1.7% (38)Colorado:
0.4% (2,447)
Place of birth for U.S.-born residents:
This state: 5,970Other state: 3,322Northeast: 143Midwest: 1,122South: 974West: 1,076 79.7% of Fort Morgan residents lived in the same house 1 years ago.
Out of people who lived in different houses, 36.1% lived in this county.
Out of people who lived in different counties, 49.8% lived in Colorado.
Fort Morgan:
79.7%State average:
83.6%
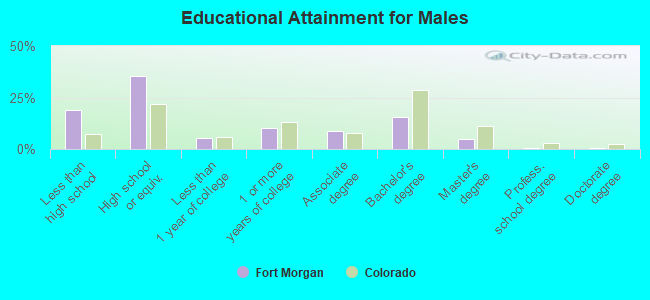
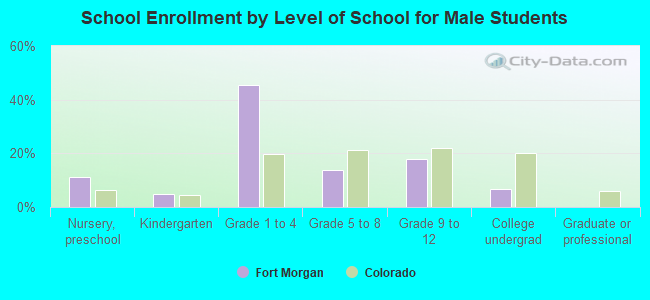
Education attainment for males 25 years and older:
No schooling: 168Nursery to 4th grade: 1095th and 6th grade: 327th and 8th grade: 1359th grade: 1810th grade: 8011th grade: 1312th grade, no diploma: 105High school graduate (or equivalency): 1,256Less than 1 year of college: 186Some college more than 1 year, no degree: 363Associate degree: 305Bachelor's degree: 544Master's degree: 168Professional school degree: 18Doctorate degree: 22
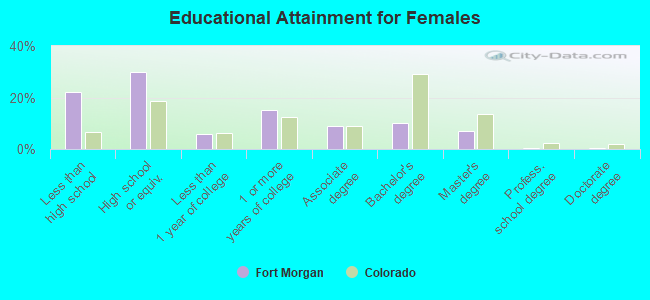
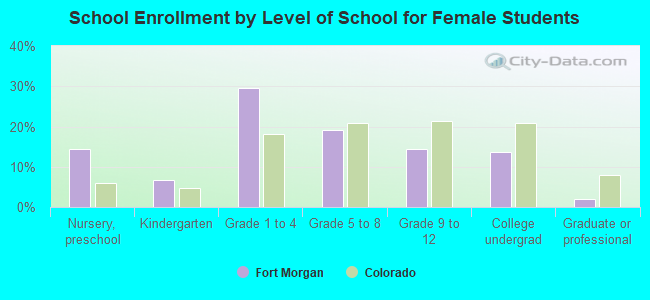
Education attainment for females 25 years and older:
No schooling: 397Nursery to 4th grade: 235th and 6th grade: 577th and 8th grade: 89th grade: 22910th grade: 4411th grade: 1912th grade, no diploma: 33High school graduate (or equivalency): 1,100Less than 1 year of college: 219Some college more than 1 year, no degree: 560Associate degree: 327Bachelor's degree: 372Master's degree: 258Professional school degree: 16Doctorate degree: 14
Housing units in structures:
One, detached: 2,829One, attached: 218Two: 2703 or 4: 1795 to 9: 22510 to 19: 35320 to 49: 6350 or more: 62Mobile homes: 469Housing units lacking complete plumbing facilities in 2022: 0.8%Housing units lacking complete kitchen facilities in 2022: 2.0%House/condo owner moved in on average 11 years ago
Renter moved in on average 5 years ago
Private vs. public school enrollment:
Students in private schools in grades 1 to 8 (elementary and middle school): 128 Students in private schools in grades 9 to 12 (high school): 26 Students in private undergraduate colleges: 0