Forestville, CA (California) Houses and Residents
| Forestville: | $706,312 |
| California: | $715,900 |
Mean price in 2022:
Detached houses: $1,080,256
Here: $1,080,256 State: $988,808 In 2-unit structures: $494,822
Here: $494,822 State: $1,138,100 Mobile homes: $227,263
Here: $227,263 State: $184,506
Total population: 3,293 (Urban population: 1,931 (all inside urban clusters), Rural population: 576 (all nonfarm))
Houses: 1,589 (1,492 occupied: 1,062 owner occupied, 447 renter occupied)
| % of renters here: | 30% |
| State: | 44% |
Housing density: 388 houses/condos per square mile
Median price asked for vacant for-sale houses and condos in 2022 in this county: $439,673.
Median contract rent in 2022: $1,611 (lower quartile is $1,164, upper quartile is $1,937)
Median gross rent in Forestville, CA in 2022: $1,608
Housing units in Forestville with a mortgage: 789 (135 second mortgage, 0 home equity loan, 141 both second mortgage and home equity loan)
Houses without a mortgage: 0
Median household income for houses/condos with a mortgage: $142,466
Median household income for apartments without a mortgage: $50,640
Median monthly housing costs: $2,065
Compare current foreclosures near Forestville, CA:
| Photo | Address | Area | Beds / Baths | Price | Details |
|---|---|---|---|---|---|

|
#1
Farrell Dr
Forestville, CA 95436
|
1,004 sq. feet
|
2 baths 2 beds |
show details | |

|
#2
Sunset Ave
Forestville, CA 95436
|
610 sq. feet
|
1 baths 2 beds |
show details | |

|
#3
Grape Ave
Forestville, CA 95436
|
1,178 sq. feet
|
1 baths 3 beds |
show details | |

|
#4
Canyon Rd
Forestville, CA 95436
|
720 sq. feet
|
1 baths 2 beds |
show details | |

|
#5
Hwy 116
Forestville, CA 95436
|
- sq. feet
|
- baths - beds |
show details | |

|
#6
Mcconnell Ave
Santa Rosa, CA 95404
|
1,216 sq. feet
|
2 baths 4 beds |
show details | |

|
#7
Halwood Ct
Santa Rosa, CA 95407
|
952 sq. feet
|
2 baths 3 beds |
show details | |

|
#8
Orchard St
Santa Rosa, CA 95404
|
884 sq. feet
|
1 baths 2 beds |
show details | |

|
#9
Hearn Ave
Santa Rosa, CA 95407
|
1,794 sq. feet
|
2 baths 4 beds |
show details | |

|
#10
Hexem Ave
Santa Rosa, CA 95404
|
1,246 sq. feet
|
2 baths 3 beds |
show details |
| Photo | Address | Area | Beds / Baths | Price | Details |
|---|---|---|---|---|---|

|
#11
Corby Ave
Santa Rosa, CA 95407
|
836 sq. feet
|
1 baths 2 beds |
show details | |

|
#12
Parkview Dr
Healdsburg, CA 95448
|
1,582 sq. feet
|
2 baths 3 beds |
show details | |

|
#13
Peach Ct
Santa Rosa, CA 95407
|
1,200 sq. feet
|
3 baths 3 beds |
show details | |

|
#14
Myrtlewood Dr
Santa Rosa, CA 95407
|
1,056 sq. feet
|
2 baths 3 beds |
show details | |

|
#15
Poplar St
Santa Rosa, CA 95407
|
945 sq. feet
|
1 baths 2 beds |
show details | |

|
#16
Corby Ave
Santa Rosa, CA 95407
|
1,136 sq. feet
|
3 baths 2 beds |
show details | |

|
#17
Rosewood Dr
Santa Rosa, CA 95407
|
1,071 sq. feet
|
2 baths 3 beds |
show details | |

|
#18
3rd St
Santa Rosa, CA 95404
|
2,325 sq. feet
|
1 baths 4 beds |
show details | |

|
#19
Fairway Knoll Ln
Santa Rosa, CA 95403
|
2,291 sq. feet
|
3 baths 3 beds |
show details | |

|
#20
Rosevine Ln
Santa Rosa, CA 95407
|
2,035 sq. feet
|
3 baths 3 beds |
show details |
| Photo | Address | Area | Beds / Baths | Price | Details |
|---|---|---|---|---|---|

|
#21
Stony Point Rd
Santa Rosa, CA 95407
|
1,198 sq. feet
|
1 baths 2 beds |
show details | |

|
#22
Simpson Pl
Santa Rosa, CA 95401
|
1,052 sq. feet
|
2 baths 3 beds |
show details | |

|
#23
S Wright Rd
Santa Rosa, CA 95407
|
1,166 sq. feet
|
1 baths 3 beds |
show details | |

|
#24
Ezra Ave
Santa Rosa, CA 95401
|
1,262 sq. feet
|
2 baths 3 beds |
show details | |

|
#25
Shelley Dr
Santa Rosa, CA 95401
|
1,370 sq. feet
|
2 baths 4 beds |
show details | |

|
#26
Aussie Ave
Santa Rosa, CA 95407
|
2,052 sq. feet
|
3 baths 4 beds |
show details | |

|
#27
Westgate Cir
Santa Rosa, CA 95401
|
960 sq. feet
|
2 baths 2 beds |
show details | |

|
#28
Malibu Cir
Santa Rosa, CA 95401
|
1,300 sq. feet
|
3 baths 3 beds |
show details | |

|
#29
Simpson Pl
Santa Rosa, CA 95401
|
1,052 sq. feet
|
2 baths 3 beds |
show details | |

|
#30
Park Meadow Dr
Santa Rosa, CA 95407
|
2,376 sq. feet
|
3 baths 3 beds |
show details |
| Photo | Address | Area | Beds / Baths | Price | Details |
|---|---|---|---|---|---|

|
#31
Marilyn Ct
Santa Rosa, CA 95407
|
1,108 sq. feet
|
2 baths 3 beds |
show details | |

|
#32
Edith Ct
Santa Rosa, CA 95401
|
1,144 sq. feet
|
2 baths 3 beds |
show details | |

|
#33
Trombetta St
Santa Rosa, CA 95407
|
1,616 sq. feet
|
2 baths 3 beds |
show details | |

|
#34
Cazadero Hwy
Cazadero, CA 95421
|
672 sq. feet
|
1 baths 2 beds |
show details | |

|
#35
Carrillo St
Santa Rosa, CA 95401
|
872 sq. feet
|
1 baths 2 beds |
show details | |

|
#36
King Ridge Rd
Cazadero, CA 95421
|
690 sq. feet
|
1 baths 2 beds |
show details | |

|
#37
King Ridge Rd
Cazadero, CA 95421
|
1,068 sq. feet
|
1 baths 2 beds |
show details | |

|
#38
Sunrise Pl
Santa Rosa, CA 95409
|
1,813 sq. feet
|
2 baths 3 beds |
show details | |

|
#39
Gio Dr
Santa Rosa, CA 95407
|
2,105 sq. feet
|
2 baths 4 beds |
show details | |

|
#40
Meadowbrook Ct
Cotati, CA 94931
|
1,733 sq. feet
|
2 baths 2 beds |
show details |
| Photo | Address | Area | Beds / Baths | Price | Details |
|---|---|---|---|---|---|

|
#41
Warrington Rd
Santa Rosa, CA 95404
|
3,755 sq. feet
|
4 baths 2 beds |
show details | |

|
#42
Country Club Dr
Rohnert Park, CA 94928
|
1,277 sq. feet
|
2 baths 2 beds |
show details | |

|
#43
Desoto Dr
Santa Rosa, CA 95409
|
3,376 sq. feet
|
3 baths 4 beds |
show details | |

|
#44
Locust Ave
Cotati, CA 94931
|
1,056 sq. feet
|
1 baths 3 beds |
show details | |

|
#45
Revard Ct
Cotati, CA 94931
|
1,611 sq. feet
|
3 baths 3 beds |
show details | |

|
#46
San Ramon Way
Santa Rosa, CA 95409
|
1,810 sq. feet
|
2 baths 3 beds |
show details | |

|
#47
Los Alamos Ct
Santa Rosa, CA 95409
|
2,350 sq. feet
|
3 baths 5 beds |
show details | |

|
#48
Yulupa Ave
Santa Rosa, CA 95405
|
1,145 sq. feet
|
2 baths 2 beds |
show details | |

|
#49
Bonnie Ave
Rohnert Park, CA 94928
|
1,756 sq. feet
|
2 baths 4 beds |
show details | |

|
Check over 1 million property listings on Foreclosure.com!
|
browse all offers | |||

Latest news about housing in Forestville, CA collected exclusively by city-data.com from local newspapers, TV, and radio stations


Median year apartment built: 1976
Household type by relationship:
Households: 3,588- Male householders: 780 (293 living alone), Female householders: 672 (225 living alone)
676 spouses (671 opposite-sex spouses), 64 unmarried partners, (64 opposite-sex unmarried partners), 813 children (715 natural, 22 adopted, 75 stepchildren), 99 grandchildren, 40 brothers or sisters, 48 parents, 10 foster children, 35 other relatives, 294 non-relatives
- In group quarters: 51
Size of family households: 405 2-persons, 111 3-persons, 135 4-persons, 93 5-persons, 9 6-persons, 41 7-or-more-persons.
Size of nonfamily households: 571 1-person, 98 2-persons, 52 3-persons.
453 married couples with children.
35 single-parent households (24 men, 11 women).
90.4% of residents of Forestville speak English at home.
5.9% of residents speak Spanish at home (33% speak English very well, 53% speak English well, 5% speak English not well, 8% don't speak English at all).
2.2% of residents speak other Indo-European language at home (55% speak English very well, 45% speak English well).
0.5% of residents speak Asian or Pacific Island language at home (75% speak English well, 25% speak English not well).
0.7% of residents speak other language at home (100% speak English very well).
Foreign born population: 307 (8.6%)
(69.7% of them are naturalized citizens)
| Here: | 5.3 |
| State: | 6.0 |
| Here: | 4.0 |
| State: | 3.9 |

- Bedrooms in owner-occupied houses and condos in Forestville, California
- 0no bedroom
- 81 bedroom
- 4112 bedrooms
- 4643 bedrooms
- 1804 bedrooms
- 05+ bedrooms

- Bedrooms in renter-occupied apartments in Forestville, California
- 25no bedroom
- 1731 bedroom
- 1572 bedrooms
- 923 bedrooms
- 04 bedrooms
- 05+ bedrooms

- Cars and other vehicles available in Forestville in owner-occupied houses/condos
- 8no vehicle
- 2541 vehicle
- 4262 vehicles
- 2273 vehicles
- 1024 vehicles
- 465+ vehicles

- Cars and other vehicles available in Forestville in renter-occupied apartments
- 8no vehicle
- 2011 vehicle
- 932 vehicles
- 803 vehicles
- 534 vehicles
- 115+ vehicles

- Rooms in owner-occupied houses in Forestville, California
- 01 room
- 02 rooms
- 833 rooms
- 2264 rooms
- 2335 rooms
- 2226 rooms
- 1577 rooms
- 528 rooms
- 899+ rooms

- Rooms in renter-occupied apartments in Forestville, California
- 251 room
- 1382 rooms
- 143 rooms
- 834 rooms
- 1435 rooms
- 226 rooms
- 137 rooms
- 08 rooms
- 109+ rooms


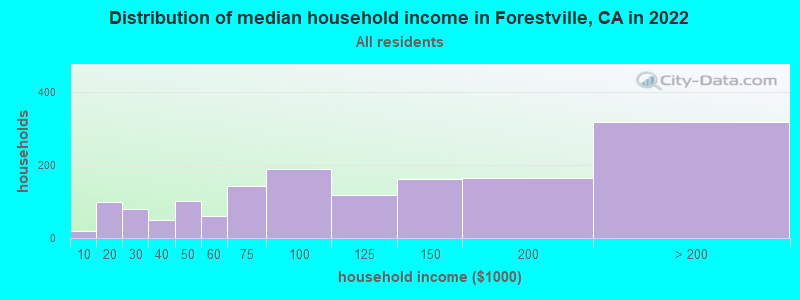
Forestville, CA household income distribution

- 20Less than $10,000
- 99$10,000 to $19,999
- 79$20,000 to $29,999
- 48$30,000 to $39,999
- 101$40,000 to $49,999
- 61$50,000 to $59,999
- 142$60,000 to $74,999
- 189$75,000 to $99,999
- 117$100,000 to $124,999
- 162$125,000 to $149,999
- 165$150,000 to $199,999
- 317$200,000 or more
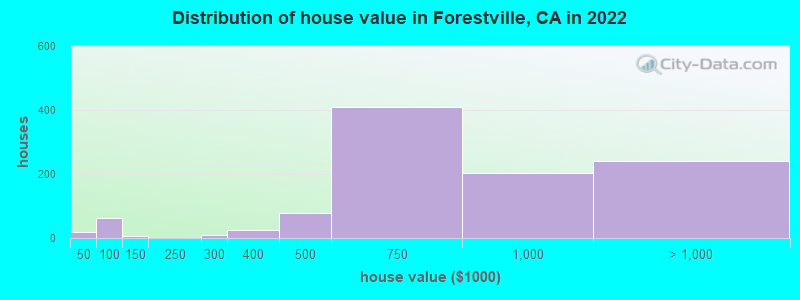
Home value of owner - occupied houses in 2022 in Forestville, CA
-
- 18Less than $10,000
- 51$60,000 to $69,999
- 10$70,000 to $79,999
- 6$125,000 to $149,999
- 7$250,000 to $299,999
- 25$300,000 to $399,999
- 79$400,000 to $499,999
- 409$500,000 to $749,999
- 202$750,000 to $999,999
- 178$1,000,000 to $1,499,999
- 39$1,500,000 to $1,999,999
- 22$2,000,000 or more
Rent paid by renters in 2022 in Forestville, CA
-
- 7$250 to $299
- 17$550 to $599
- 27$700 to $749
- 22$750 to $799
- 51$1,000 to $1,249
- 32$1,250 to $1,499
- 204$1,500 to $1,999
- 37$2,000 to $2,499
- 10$2,500 to $2,999
- 32$3,000 to $3,499
- 21No cash rent

Percentage of workers working in this county: 96.5%
Number of people working at home: 296 (16.0% of all workers)
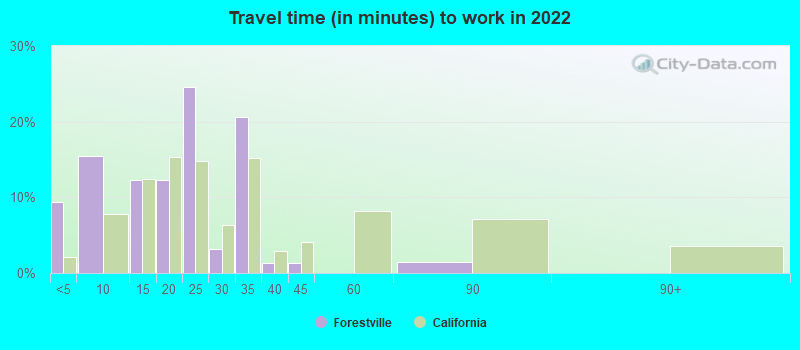
Travel time to work (commute)
- Less than 5 minutes: 71
- 5 to 9 minutes: 81
- 10 to 14 minutes: 98
- 15 to 19 minutes: 252
- 20 to 24 minutes: 326
- 25 to 29 minutes: 289
- 30 to 34 minutes: 239
- 35 to 39 minutes: 16
- 40 to 44 minutes: 43
- 45 to 59 minutes: 109
- 60 to 89 minutes: 17
- 90 or more minutes: 14
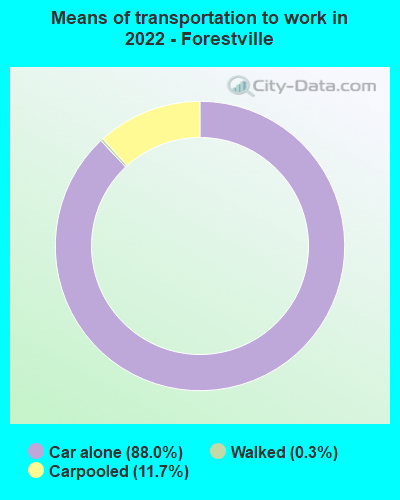
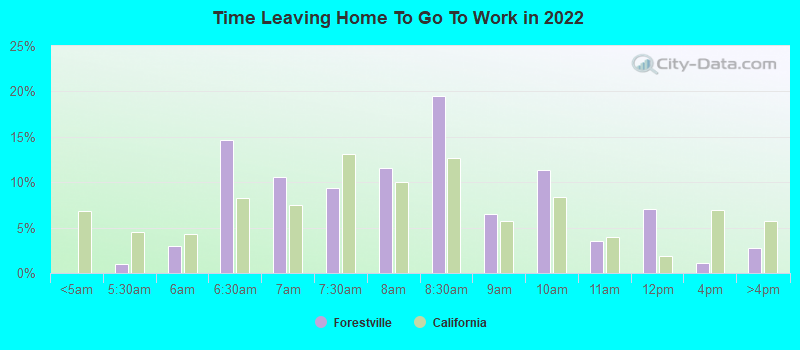
Means of transportation to work:
- Drove a car alone: 772 (67.4%)
- Carpooled: 85 (7.4%)
- Walked: 3 (0.3%)
- Worked at home: 296 (25.9%)
- Unemployment by race in 2022
- Unemployment rate for White non-Hispanic residents
- 5.5%Males
- 1.7%Females
- Unemployment rate for Asian residents
- 12.6%Females
- Unemployment rate for two or more race residents
- 1.9%Females
- Unemployment rate for Hispanic or Latino residents
- 2.9%Females

- Year of entry for the foreign-born population in Forestville, California
- 442010 or later
- 342000 to 2009
- 801990 to 1999
- 291980 to 1989
- 181970 to 1979
- 80Before 1970

First ancestries reported:
- English: 212 (16.7%)
- Irish: 144 (11.4%)
- Italian: 92 (7.3%)
- German: 76 (6.0%)
- European: 75 (5.9%)
- British: 51 (4.0%)
- Kenyan: 41 (3.2%)
- Swedish: 40 (3.2%)
- Scottish: 32 (2.5%)
- French: 29 (2.3%)
- Scotch-Irish: 24 (1.9%)
- American: 19 (1.5%)
- Czech: 10 (0.8%)
- Eastern European: 10 (0.8%)
- Canadian: 8 (0.6%)
- Slavic: 8 (0.6%)
- Norwegian: 5 (0.4%)
Most common places of birth for foreign-born residents (%):
| Forestville: | 27.3% (84) |
| California: | 37.2% (3,881,193) |
| Forestville: | 14.3% (44) |
| California: | 0.6% (57,953) |
| Forestville: | 10.7% (33) |
| California: | 0.1% (12,503) |
| Forestville: | 9.4% (29) |
| California: | 0.2% (20,614) |
| Forestville: | 8.8% (27) |
| California: | 1.2% (127,477) |
| Forestville: | 6.5% (20) |
| California: | 0.6% (60,582) |
| Forestville: | 5.2% (16) |
| California: | 0.0% (1,988) |
| Forestville: | 4.2% (13) |
| California: | 0.1% (15,357) |
| Forestville: | 3.6% (11) |
| California: | 6.6% (684,672) |
| Forestville: | 3.6% (11) |
| California: | 0.0% (343) |
| Forestville: | 3.2% (10) |
| California: | 0.3% (31,439) |
Place of birth for U.S.-born residents:
- This state: 2,228
- Other state: 1,016
- Northeast: 231
- Midwest: 295
- South: 345
- West: 151
93.2% of Forestville residents lived in the same house 1 years ago.
Out of people who lived in different houses, 39.7% lived in this county.
Out of people who lived in different counties, 100.0% lived in California.
| Forestville: | 93.2% |
| State average: | 88.9% |
Education attainment for males 25 years and older:
- No schooling: 0
- Nursery to 4th grade: 10
- 5th and 6th grade: 0
- 7th and 8th grade: 14
- 9th grade: 0
- 10th grade: 0
- 11th grade: 5
- 12th grade, no diploma: 60
- High school graduate (or equivalency): 233
- Less than 1 year of college: 63
- Some college more than 1 year, no degree: 301
- Associate degree: 83
- Bachelor's degree: 390
- Master's degree: 114
- Professional school degree: 28
- Doctorate degree: 65

Education attainment for females 25 years and older:
- No schooling: 10
- Nursery to 4th grade: 26
- 5th and 6th grade: 0
- 7th and 8th grade: 0
- 9th grade: 0
- 10th grade: 0
- 11th grade: 16
- 12th grade, no diploma: 21
- High school graduate (or equivalency): 197
- Less than 1 year of college: 98
- Some college more than 1 year, no degree: 282
- Associate degree: 195
- Bachelor's degree: 313
- Master's degree: 240
- Professional school degree: 98
- Doctorate degree: 25


Housing units in structures:
- One, detached: 1,477
- One, attached: 23
- Two: 34
- Mobile homes: 42
- Boats, RVs, vans, etc.: 11
Housing units lacking complete kitchen facilities in 2022: 0.6%
House/condo owner moved in on average 20 years ago
Renter moved in on average 6 years ago

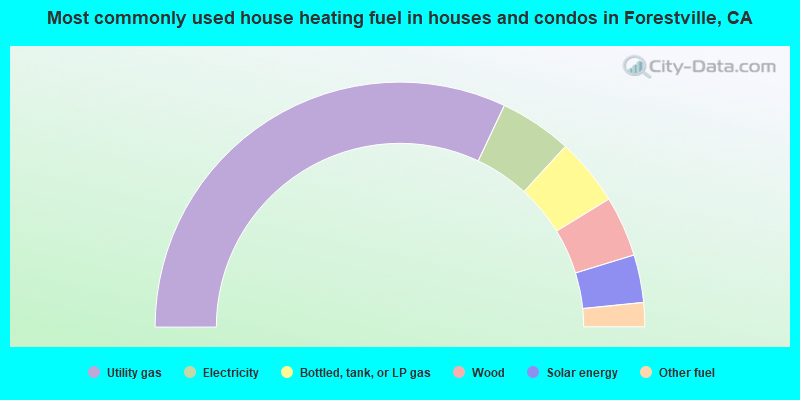
- 64.1%Utility gas
- 9.6%Electricity
- 8.9%Bottled, tank, or LP gas
- 8.0%Wood
- 6.3%Solar energy
- 3.2%Other fuel
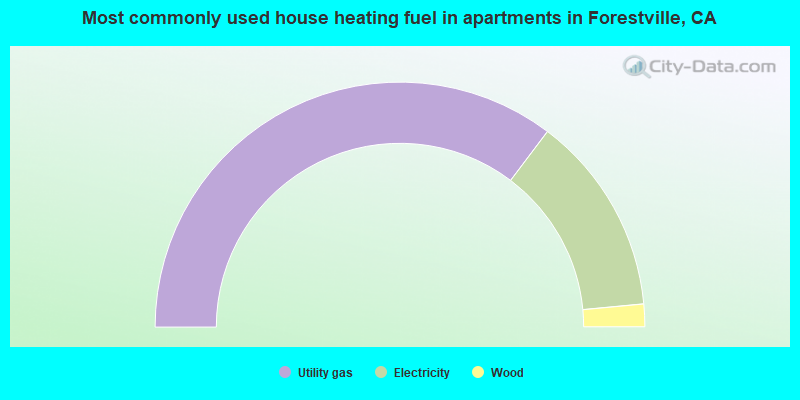
- 70.6%Utility gas
- 26.4%Electricity
- 3.0%Wood
Private vs. public school enrollment:
| Here: | 0.0% |
| California: | 10.5% |
| Here: | 14.9% |
| California: | 8.5% |
| Here: | 0.0% |
| California: | 15.9% |


