Forest Park, IL (Illinois) Houses and Residents
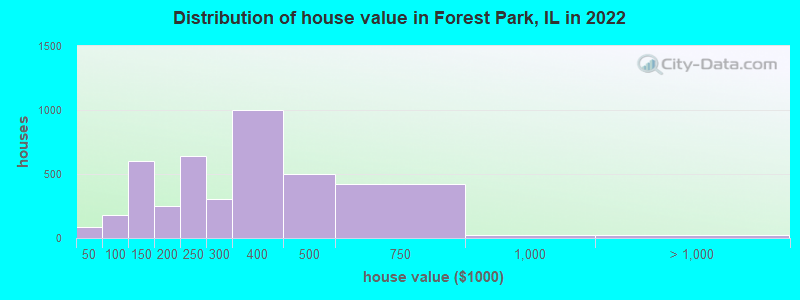
Estimated median house or condo value in 2022: $274,616 (it was $131,900 in 2000 )
Forest Park:
$274,616Illinois:
$251,600
Lower value quartile - upper value quartile: $163,942 - $393,886Mean price in 2022: Detached houses: $391,740 Here:
$391,740State:
$310,164
Townhouses or other attached units: $336,575 Here:
$336,575State:
$286,230
In 2-unit structures: $346,630 Here:
$346,630State:
$299,638
In 3-to-4-unit structures: $1,092,276 Here:
$1,092,276State:
$330,907
In 5-or-more-unit structures: $165,486 Here:
$165,486State:
$318,887
Total population: 14,196 (All urban)
Houses: 8,128 (7,359 occupied: 4,130 owner occupied, 3,354 renter occupied )
% of renters here:
45%State:
33%
Housing density: 3,358 houses/condos per square mile
Median price asked for vacant for-sale houses and condos in 2022: $807,380.
Median contract rent in 2022: $1,170 (lower quartile is $947, upper quartile is $1,584)
Median rent asked for vacant for-rent units in 2022: $1,083
Median gross rent in Forest Park, IL in 2022: $1,265
Housing units in Forest Park with a mortgage: 2,681 (282 second mortgage, 0 home equity loan, 171 both second mortgage and home equity loan )Houses without a mortgage: 44
Median household income for houses/condos with a mortgage: $107,664
Median household income for apartments without a mortgage: $72,725
Median monthly housing costs: $1,340
Data:
Median house or condo value ($)
Median house or condo value ($ change since 2000)
Median house or condo value ($) - White
Median house or condo value ($) - Black or African American
Median house or condo value ($) - Asian
Median house or condo value ($) - Hispanic or Latino
Median house or condo value ($) - American Indian and Alaska Native
Median house or condo value ($) - Multirace
Median house or condo value ($) - Other Race
Median price asked for mobile homes ($)
Household density (households per square mile)
Mean house or condo value by units in structure - 1, detached ($)
Mean house or condo value by units in structure - 1, attached ($)
Mean house or condo value by units in structure - 2 ($)
Mean house or condo value by units in structure by units in structure - 3 or 4 ($)
Mean house or condo value by units in structure - 5 or more ($)
Mean house or condo value by units in structure - Boat, RV, van, etc. ($)
Mean house or condo value by units in structure - Mobile home ($)
Median contract rent ($)
Median contract rent - Lower quartile ($)
Median contract rent - Upper quartile ($)
Median gross rent ($)
Urban houses (%)
Rural houses (%)
Houses occupied (%)
Houses occupied (% change since 2000)
Houses owner occupied (%)
Houses owner occupied (% change since 2000)
Houses renter occupied (%)
Houses renter occupied (% change since 2000)
Vacant housing units - For rent (%)
Vacant housing units - For rent (% change since 2000)
Vacant housing units - For sale only (%)
Vacant housing units - For sale only (% change since 2000)
Vacant housing units - Rented or sold, not occupied (%)
Vacant housing units - Rented or sold, not occupied (% change since 2000)
Vacant housing units - For seasonal, recreational, or occasional use (%)
Vacant housing units - For seasonal, recreational, or occasional use (% change since 2000)
Vacant housing units - For migrant workers (%)
Vacant housing units - For migrant workers (% change since 2000)
Vacant housing units - Other vacant (%)
Vacant housing units - Other vacant (% change since 2000)
Median monthly housing costs ($)
Median household income for houses/condos with a mortgage ($)
Median household income for houses/condos without a mortgage ($)
Median household income ($)
Median household income ($) - White
Median household income ($) - Black or African American
Median household income ($) - Asian
Median household income ($) - Hispanic or Latino
Median household income ($) - American Indian and Alaska Native
Median household income ($) - Multirace
Median household income ($) - Other Race
Mortgage status - with mortgage (%)
Mortgage status - with second mortgage (%)
Mortgage status - with home equity loan (%)
Mortgage status - with both second mortgage and home equity loan (%)
Mortgage status - without a mortgage (%)
Median year house/condo built
Median year apartment built
Household type by relationship - Male householder living alone (%)
Household type by relationship - Male householder not living alone (%)
Household type by relationship - Female householder living alone (%)
Household type by relationship - Female householder not living alone (%)
Household type by relationship - Opposite-Sex spouse (%)
Household type by relationship - Same-Sex spouse (%)
Household type by relationship - Opposite-Sex unmarried partner (%)
Household type by relationship - Same-Sex unmarried partner (%)
Household type by relationship - In group quarters (%)
Size of family households - 2-person household (%)
Size of family households - 3-person household (%)
Size of family households - 4-person household (%)
Size of family households - 5-person household (%)
Size of family households - 6-person household (%)
Size of family households - 7-or-more-person household (%)
Size of nonfamily households - 1-person household (%)
Size of nonfamily households - 2-person household (%)
Size of nonfamily households - 3-person household (%)
Size of nonfamily households - 4-person household (%)
Size of nonfamily households - 5-person household (%)
Size of nonfamily households - 6-person household (%)
Size of nonfamily households - 7-or-moreperson household (%)
Year house built - Built 2010 or later (%)
Year house built - Built 2000 to 2009 (%)
Year house built - Built 1990 to 1999 (%)
Year house built - Built 1980 to 1989 (%)
Year house built - Built 1970 to 1979 (%)
Year house built - Built 1960 to 1969 (%)
Year house built - Built 1950 to 1959 (%)
Year house built - Built 1940 to 1949 (%)
Year house built - Built 1939 or earlier (%)
Median number of rooms in houses and condos
Median number of rooms in apartments
Median number of bedrooms in owner occupied houses
Mean number of bedrooms in owner occupied houses
Median number of bedrooms in renter occupied houses
Mean number of bedrooms in renter occupied houses
Median number of vehichles in owner occupied houses
Mean number of vehichles in owner occupied houses
Median number of vehichles in renter occupied houses
Mean number of vehichles in renter occupied houses
Rooms in owner-occupied houses - 1 room (%)
Rooms in owner-occupied houses - 2 rooms (%)
Rooms in owner-occupied houses - 3 rooms (%)
Rooms in owner-occupied houses - 4 rooms (%)
Rooms in owner-occupied houses - 5 rooms (%)
Rooms in owner-occupied houses - 6 rooms (%)
Rooms in owner-occupied houses - 7 rooms (%)
Rooms in owner-occupied houses - 8 rooms (%)
Rooms in owner-occupied houses - 9+ rooms (%)
Rooms in renter-occupied houses - 1 room (%)
Rooms in renter-occupied houses - 2 rooms (%)
Rooms in renter-occupied houses - 3 rooms (%)
Rooms in renter-occupied houses - 4 rooms (%)
Rooms in renter-occupied houses - 5 rooms (%)
Rooms in renter-occupied houses - 6 rooms (%)
Rooms in renter-occupied houses - 7 rooms (%)
Rooms in renter-occupied houses - 8 rooms (%)
Rooms in renter-occupied houses - 9+ rooms (%)
Bedrooms in owner-occupied houses - no bedrooms (%)
Bedrooms in owner-occupied houses - 1 bedroom (%)
Bedrooms in owner-occupied houses - 2 bedrooms (%)
Bedrooms in owner-occupied houses - 3 bedrooms (%)
Bedrooms in owner-occupied houses - 4 bedrooms (%)
Bedrooms in owner-occupied houses - 5+ bedrooms (%)
Bedrooms in renter-occupied houses - no bedrooms (%)
Bedrooms in renter-occupied houses - 1 bedroom (%)
Bedrooms in renter-occupied houses - 2 bedrooms (%)
Bedrooms in renter-occupied houses - 3 bedrooms (%)
Bedrooms in renter-occupied houses - 4 bedrooms (%)
Bedrooms in renter-occupied houses - 5+ bedrooms (%)
Vehicles available in owner-occupied houses - no vehicle available (%)
Vehicles available in owner-occupied houses - 1 vehicle available(%)
Vehicles available in owner-occupied houses - 2 Vehicles available (%)
Vehicles available in owner-occupied houses - 3 Vehicles available (%)
Vehicles available in owner-occupied houses - 4 Vehicles available (%)
Vehicles available in owner-occupied houses - 5+ Vehicles available (%)
Vehicles available in renter-occupied houses - no vehicle available (%)
Vehicles available in renter-occupied houses - 1 vehicle available (%)
Vehicles available in renter-occupied houses - 2 Vehicles available (%)
Vehicles available in renter-occupied houses - 3 Vehicles available (%)
Vehicles available in renter-occupied houses - 4 Vehicles available (%)
Vehicles available in renter-occupied houses - 5+ Vehicles available (%)
Housing units in structures - 1, detached (%)
Housing units in structures - 1, attached (%)
Housing units in structures - 2 (%)
Housing units in structures - 3 or 4 (%)
Housing units in structures - 5 to 9 (%)
Housing units in structures - 10 to 19 (%)
Housing units in structures - 20 to 49 (%)
Housing units in structures - 50 or more (%)
Housing units in structures - Mobile home (%)
Housing units in structures - Boat, RV, van, etc. (%)
Housing units in structures - Owners - 1, detached (%)
Housing units in structures - Owners - 1, attached (%)
Housing units in structures - Owners - 2 (%)
Housing units in structures - Owners - 3 or 4 (%)
Housing units in structures - Owners - 5 to 9 (%)
Housing units in structures - Owners - 10 to 19 (%)
Housing units in structures - Owners - 20 to 49 (%)
Housing units in structures - Owners - 50 or more (%)
Housing units in structures - Owners - Mobile home (%)
Housing units in structures - Owners - Boat, RV, van, etc. (%)
Housing units in structures - Renters - 1, detached (%)
Housing units in structures - Renters - 1, attached (%)
Housing units in structures - Renters - 2 (%)
Housing units in structures - Renters - 3 or 4 (%)
Housing units in structures - Renters - 5 to 9 (%)
Housing units in structures - Renters - 10 to 19 (%)
Housing units in structures - Renters - 20 to 49 (%)
Housing units in structures - Renters - 50 or more (%)
Housing units in structures - Renters - Mobile home (%)
Housing units in structures - Renters - Boat, RV, van, etc. (%)
House/condo owner moved in on average (years ago)
Renter moved in on average (years ago)
Year householder moved into unit - Moved in 1999 to March 2000 (%)
Year householder moved into unit - Moved in 1999 to March 2000 (%) - White
Year householder moved into unit - Moved in 1999 to March 2000 (%) - Black or African American
Year householder moved into unit - Moved in 1999 to March 2000 (%) - Asian
Year householder moved into unit - Moved in 1999 to March 2000 (%) - Hispanic or Latino
Year householder moved into unit - Moved in 1999 to March 2000 (%) - American Indian and Alaska Native
Year householder moved into unit - Moved in 1999 to March 2000 (%) - Multirace
Year householder moved into unit - Moved in 1999 to March 2000 (%) - Other Race
Year householder moved into unit - Moved in 1995 to 1998 (%)
Year householder moved into unit - Moved in 1995 to 1998 (%) - White
Year householder moved into unit - Moved in 1995 to 1998 (%) - Black or African American
Year householder moved into unit - Moved in 1995 to 1998 (%) - Asian
Year householder moved into unit - Moved in 1995 to 1998 (%) - Hispanic or Latino
Year householder moved into unit - Moved in 1995 to 1998 (%) - American Indian and Alaska Native
Year householder moved into unit - Moved in 1995 to 1998 (%) - Multirace
Year householder moved into unit - Moved in 1995 to 1998 (%) - Other Race
Year householder moved into unit - Moved in 1990 to 1994 (%)
Year householder moved into unit - Moved in 1990 to 1994 (%) - White
Year householder moved into unit - Moved in 1990 to 1994 (%) - Black or African American
Year householder moved into unit - Moved in 1990 to 1994 (%) - Asian
Year householder moved into unit - Moved in 1990 to 1994 (%) - Hispanic or Latino
Year householder moved into unit - Moved in 1990 to 1994 (%) - American Indian and Alaska Native
Year householder moved into unit - Moved in 1990 to 1994 (%) - Multirace
Year householder moved into unit - Moved in 1990 to 1994 (%) - Other Race
Year householder moved into unit - Moved in 1980 to 1989 (%)
Year householder moved into unit - Moved in 1980 to 1989 (%) - White
Year householder moved into unit - Moved in 1980 to 1989 (%) - Black or African American
Year householder moved into unit - Moved in 1980 to 1989 (%) - Asian
Year householder moved into unit - Moved in 1980 to 1989 (%) - Hispanic or Latino
Year householder moved into unit - Moved in 1980 to 1989 (%) - American Indian and Alaska Native
Year householder moved into unit - Moved in 1980 to 1989 (%) - Multirace
Year householder moved into unit - Moved in 1980 to 1989 (%) - Other Race
Year householder moved into unit - Moved in 1970 to 1979 (%)
Year householder moved into unit - Moved in 1970 to 1979 (%) - White
Year householder moved into unit - Moved in 1970 to 1979 (%) - Black or African American
Year householder moved into unit - Moved in 1970 to 1979 (%) - Asian
Year householder moved into unit - Moved in 1970 to 1979 (%) - Hispanic or Latino
Year householder moved into unit - Moved in 1970 to 1979 (%) - American Indian and Alaska Native
Year householder moved into unit - Moved in 1970 to 1979 (%) - Multirace
Year householder moved into unit - Moved in 1970 to 1979 (%) - Other Race
Year householder moved into unit - Moved in 1969 or earlier (%)
Year householder moved into unit - Moved in 1969 or earlier (%) - White
Year householder moved into unit - Moved in 1969 or earlier (%) - Black or African American
Year householder moved into unit - Moved in 1969 or earlier (%) - Asian
Year householder moved into unit - Moved in 1969 or earlier (%) - Hispanic or Latino
Year householder moved into unit - Moved in 1969 or earlier (%) - American Indian and Alaska Native
Year householder moved into unit - Moved in 1969 or earlier (%) - Multirace
Year householder moved into unit - Moved in 1969 or earlier (%) - Other Race
Housing units lacking complete plumbing facilities (%)
Housing units lacking complete kitchen facilities (%)
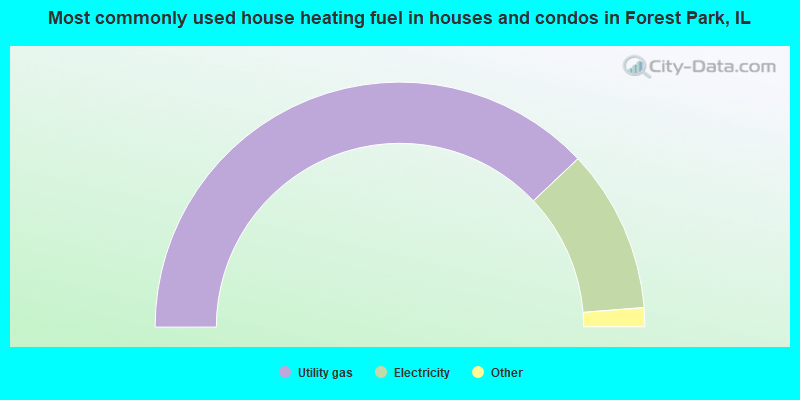
House heating fuel used in houses and condos - Utility gas (%)
House heating fuel used in houses and condos - Bottled, tank, or LP gas (%)
House heating fuel used in houses and condos - Electricity (%)
House heating fuel used in houses and condos - Fuel oil, kerosene, etc. (%)
House heating fuel used in houses and condos - Coal or coke (%)
House heating fuel used in houses and condos - Wood (%)
House heating fuel used in houses and condos - Solar energy (%)
House heating fuel used in houses and condos - Other fuel (%)
House heating fuel used in houses and condos - No fuel used (%)
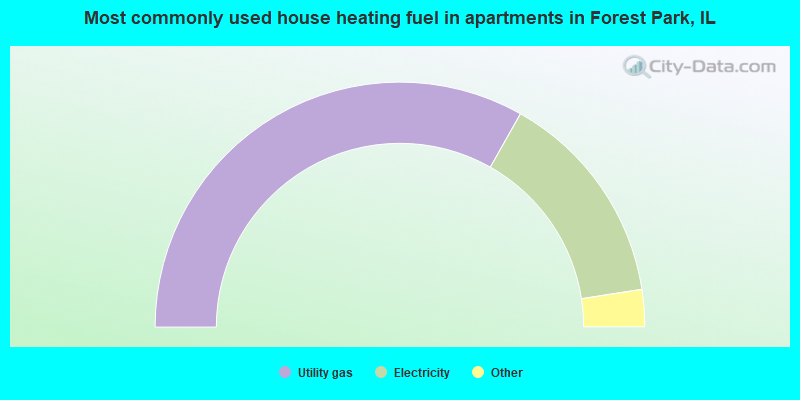
House heating fuel used in apartments - Utility gas (%)
House heating fuel used in apartments - Bottled, tank, or LP gas (%)
House heating fuel used in apartments - Electricity (%)
House heating fuel used in apartments - Fuel oil, kerosene, etc. (%)
House heating fuel used in apartments - Coal or coke (%)
House heating fuel used in apartments - Wood (%)
House heating fuel used in apartments - Solar energy (%)
House heating fuel used in apartments - Other fuel (%)
House heating fuel used in apartments - No fuel used (%)
Median year house/condo built: 1943Median year apartment built: 1962Household type by relationship:
Households: 13,850
Male householders: 3,276 (1,440 living alone ), Female householders: 3,888 (1,950 living alone )1,909 spouses (1,874 opposite-sex spouses ), 545 unmarried partners , (476 opposite-sex unmarried partners ), 2,955 children (2,750 natural , 96 adopted , 108 stepchildren ), 101 grandchildren , 86 brothers or sisters , 189 parents , 0 foster children , 83 other relatives , 548 non-relatives In group quarters: 264
Size of family households: 1,788 2-persons , 1,063 3-persons , 297 4-persons , 134 5-persons , 6 6-persons .
Size of nonfamily households: 3,642 1-person , 444 2-persons , 157 3-persons , 20 7-or-more-persons .
890 married couples with children. single-parent households (179 men , 798 women ).
85.8% of residents of Forest Park speak English at home. of residents speak Spanish at home (82% speak English very well , 9% speak English well , 9% speak English not well ).of residents speak other Indo-European language at home (82% speak English very well , 17% speak English well , 1% speak English not well ).of residents speak Asian or Pacific Island language at home (69% speak English very well , 23% speak English well , 8% speak English not well ).of residents speak other language at home (100% speak English very well ).
Foreign born population: 1,252 (9.0%)of them are naturalized citizens )
Median number of rooms in houses and condos:
Median number of rooms in apartments
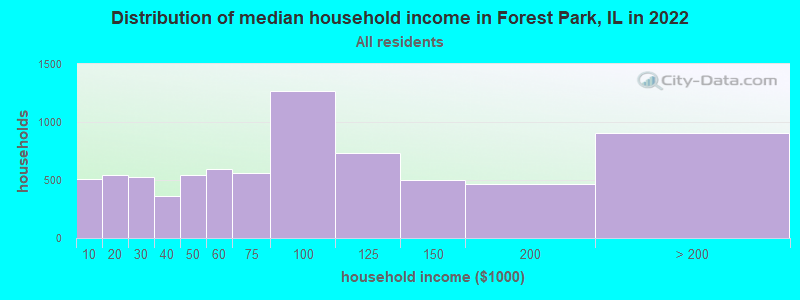
Forest Park, IL household income distribution 510 Less than $10,000542 $10,000 to $19,999529 $20,000 to $29,999360 $30,000 to $39,999539 $40,000 to $49,999594 $50,000 to $59,999559 $60,000 to $74,9991,271 $75,000 to $99,999737 $100,000 to $124,999496 $125,000 to $149,999469 $150,000 to $199,999901 $200,000 or more
Home value of owner - occupied houses in 2022 in Forest Park, IL 57 Less than $10,00031 $25,000 to $29,99911 $50,000 to $59,99934 $60,000 to $69,9997 $70,000 to $79,999105 $80,000 to $89,99917 $90,000 to $99,999206 $100,000 to $124,999393 $125,000 to $149,999105 $150,000 to $174,999142 $175,000 to $199,999640 $200,000 to $249,999306 $250,000 to $299,9991,003 $300,000 to $399,999499 $400,000 to $499,999424 $500,000 to $749,99925 $750,000 to $999,99923 $2,000,000 or moreRent paid by renters in 2022 in Forest Park, IL 27 $150 to $19946 $250 to $29911 $450 to $4997 $500 to $54914 $550 to $59928 $600 to $64984 $650 to $69912 $700 to $749156 $750 to $799221 $800 to $899412 $900 to $999881 $1,000 to $1,249439 $1,250 to $1,499676 $1,500 to $1,999156 $2,000 to $2,49925 $2,500 to $2,9998 $3,000 to $3,499114 $3,500 or more63 No cash rent
Percentage of workers working in this county: 88.1%Number of people working at home: 1,921 (23.9% of all workers )
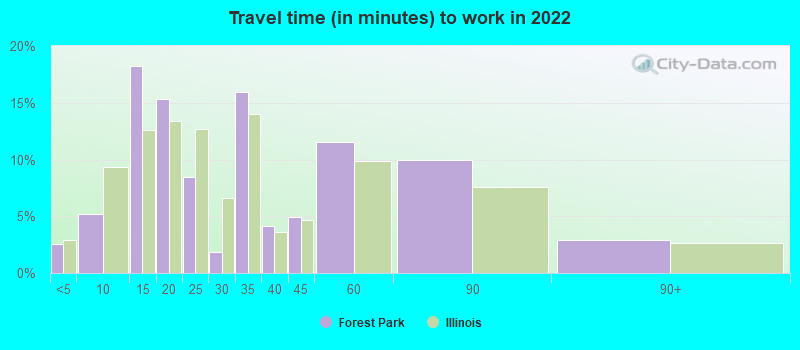
Travel time to work (commute)
Less than 5 minutes: 2655 to 9 minutes: 37410 to 14 minutes: 59015 to 19 minutes: 36220 to 24 minutes: 78125 to 29 minutes: 43830 to 34 minutes: 1,03835 to 39 minutes: 52240 to 44 minutes: 56045 to 59 minutes: 88660 to 89 minutes: 38490 or more minutes: 37
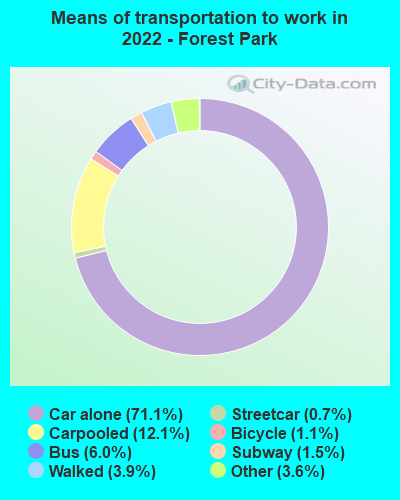
Means of transportation to work:
Drove a car alone: 4,904 (57.4%)Carpooled: 898 (10.5%)Bus : 382 (4.5%)Subway or elevated rail : 37 (0.4%)Long-distance train or commuter rail : 72 (0.8%)Taxi: 248 (2.9%)Bicycle: 81 (0.9%)Walked: 280 (3.3%)Worked at home: 1,921 (22.5%)
Unemployment by race in 2022
Unemployment rate for White non-Hispanic residents 3.1% Males2.5% FemalesUnemployment rate for Black residents 7.2% Males10.5% FemalesUnemployment rate for Asian residents 1.5% FemalesUnemployment rate for two or more race residents 7.2% Females
Year of entry for the foreign-born population in Forest Park, Illinois
308 2010 or later 384 2000 to 2009 212 1990 to 1999 454 1980 to 1989 304 1970 to 1979 393 Before 1970
First ancestries reported:
Irish: 395 (5.7%)
Polish: 379 (5.4%)
German: 356 (5.1%)
Italian: 300 (4.3%)
European: 202 (2.9%)
American: 177 (2.5%)
Dutch: 128 (1.8%)
English: 121 (1.7%)
Scottish: 74 (1.1%)
Ukrainian: 71 (1.0%)
Northern European: 67 (1.0%)
African: 66 (0.9%)
Greek: 64 (0.9%)
Finnish: 58 (0.8%)
Iranian: 53 (0.8%)
Jamaican: 53 (0.8%)
Canadian: 53 (0.8%)
Swedish: 43 (0.6%)
Sudanese: 40 (0.6%)
Czech: 34 (0.5%)
Scotch-Irish: 26 (0.4%)
Syrian: 19 (0.3%)
Czechoslovakian: 17 (0.2%)
Swiss: 15 (0.2%)
Romanian: 14 (0.2%)
Hungarian: 14 (0.2%)
Danish: 11 (0.2%)
Lebanese: 9 (0.1%)
Lithuanian: 8 (0.1%)
British: 6 (0.09%)
Haitian: 6 (0.09%)
Egyptian: 5 (0.07%)
Eastern European: 5 (0.07%)
Russian: 4 (0.06%) Most common places of birth for foreign-born residents (%): India Forest Park:
24.8% (310)Illinois:
9.2% (166,409)
Philippines Forest Park:
10.5% (131)Illinois:
5.2% (93,003)
Poland Forest Park:
7.5% (94)Illinois:
6.9% (124,474)
Ukraine Forest Park:
5.8% (72)Illinois:
1.6% (29,316)
Greece Forest Park:
4.9% (61)Illinois:
0.6% (10,720)
Guatemala Forest Park:
3.4% (43)Illinois:
1.3% (22,793)
China, excluding Hong Kong and Taiwan Forest Park:
3.3% (41)Illinois:
4.1% (74,364)
Peru Forest Park:
3.3% (41)Illinois:
0.5% (8,161)
Sudan Forest Park:
3.1% (39)Illinois:
0.1% (1,047)
Netherlands Forest Park:
2.9% (36)Illinois:
0.1% (2,017)
Canada Forest Park:
2.9% (36)Illinois:
1.1% (19,306)
Mexico Forest Park:
2.6% (33)Illinois:
34.7% (626,958)
Other Middle Africa Forest Park:
2.2% (28)Illinois:
0.0% (418)
Germany Forest Park:
2.0% (25)Illinois:
1.0% (18,753)
Ecuador Forest Park:
1.9% (24)Illinois:
0.9% (16,844)
Jamaica Forest Park:
1.8% (23)Illinois:
0.5% (8,168)
Iran Forest Park:
1.5% (19)Illinois:
0.4% (6,922)
Vietnam Forest Park:
1.5% (19)Illinois:
1.2% (22,269)
Place of birth for U.S.-born residents:
This state: 9,006Other state: 3,506Northeast: 313Midwest: 1,720South: 1,173West: 306 87.2% of Forest Park residents lived in the same house 1 years ago.
Out of people who lived in different houses, 39.0% lived in this county.
Out of people who lived in different counties, 19.2% lived in Illinois.
Forest Park:
87.2%State average:
88.3%
Education attainment for males 25 years and older:
No schooling: 24Nursery to 4th grade: 55th and 6th grade: 307th and 8th grade: 109th grade: 4210th grade: 7311th grade: 012th grade, no diploma: 60High school graduate (or equivalency): 943Less than 1 year of college: 371Some college more than 1 year, no degree: 645Associate degree: 450Bachelor's degree: 1,304Master's degree: 847Professional school degree: 216Doctorate degree: 153
Education attainment for females 25 years and older:
No schooling: 28Nursery to 4th grade: 05th and 6th grade: 57th and 8th grade: 59th grade: 010th grade: 3911th grade: 3212th grade, no diploma: 1High school graduate (or equivalency): 1,030Less than 1 year of college: 218Some college more than 1 year, no degree: 711Associate degree: 409Bachelor's degree: 1,851Master's degree: 1,116Professional school degree: 369Doctorate degree: 126
Housing units in structures:
One, detached: 2,387One, attached: 504Two: 1,1823 or 4: 6615 to 9: 55610 to 19: 60520 to 49: 1,27650 or more: 910Mobile homes: 12Boats, RVs, vans, etc.: 32Housing units lacking complete plumbing facilities in 2022: 0.3%Housing units lacking complete kitchen facilities in 2022: 2.2%House/condo owner moved in on average 13 years ago
Renter moved in on average 5 years ago
Private vs. public school enrollment:
Students in private schools in grades 1 to 8 (elementary and middle school): 141 Students in private schools in grades 9 to 12 (high school): 138 Students in private undergraduate colleges: 172