Forest City, NC (North Carolina) Houses and Residents
| Forest City: | $163,176 |
| North Carolina: | $280,600 |
Mean price in 2022:
Detached houses: $164,133
Here: $164,133 State: $375,326 Townhouses or other attached units: $223,948
Here: $223,948 State: $317,935 Mobile homes: $116,707
Here: $116,707 State: $124,933
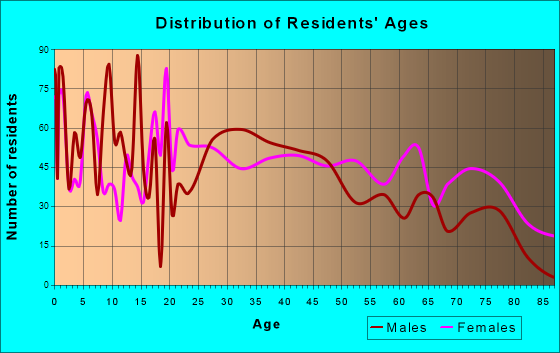
Total population: 7,324 (All urban)
Houses: 3,339 (2,777 occupied: 1,260 owner occupied, 1,557 renter occupied)
| % of renters here: | 55% |
| State: | 33% |
Housing density: 406 houses/condos per square mile
Median price asked for vacant for-sale houses and condos in 2022: $1,023,112.
Median contract rent in 2022: $516 (lower quartile is $381, upper quartile is $700)
Median rent asked for vacant for-rent units in 2022: $3,171
Median gross rent in Forest City, NC in 2022: $742
Housing units in Forest City with a mortgage: 582 (26 second mortgage, 0 home equity loan, 28 both second mortgage and home equity loan)
Houses without a mortgage: 97
Median household income for houses/condos with a mortgage: $65,026
Median household income for apartments without a mortgage: $43,007
Median monthly housing costs: $719
Compare current foreclosures near Forest City, NC:
| Photo | Address | Area | Beds / Baths | Price | Details |
|---|---|---|---|---|---|

|
#1
Holland St
Forest City, NC 28043
|
1,000 sq. feet
|
1 baths 3 beds |
show details | |

|
#2
Forest Lake Rd
Forest City, NC 28043
|
1,340 sq. feet
|
2 baths 3 beds |
show details | |

|
#3
Westview St
Forest City, NC 28043
|
1,302 sq. feet
|
1 baths 2 beds |
show details | |

|
#4
Flack Rd
Forest City, NC 28043
|
1,463 sq. feet
|
1 baths 3 beds |
show details | |

|
#5
Wilson Dr
Forest City, NC 28043
|
686 sq. feet
|
1 baths 2 beds |
show details | |

|
#6
Whitesides Rd
Forest City, NC 28043
|
1,662 sq. feet
|
2 baths 3 beds |
show details | |

|
#7
Bodie Ave
Forest City, NC 28043
|
1,492 sq. feet
|
1 baths 3 beds |
show details | |

|
#8
Thompson St
Forest City, NC 28043
|
632 sq. feet
|
2 baths 4 beds |
show details | |

|
#9
Twelve Oaks Dr
Forest City, NC 28043
|
1,056 sq. feet
|
1 baths 2 beds |
show details | |

|
#10
Marshall St
Forest City, NC 28043
|
1,080 sq. feet
|
2 baths 3 beds |
show details |
| Photo | Address | Area | Beds / Baths | Price | Details |
|---|---|---|---|---|---|

|
#11
Low Bridge Rd
Forest City, NC 28043
|
924 sq. feet
|
1 baths 3 beds |
show details | |

|
#12
Fox Run Rd
Forest City, NC 28043
|
512 sq. feet
|
1 baths 2 beds |
show details | |

|
#13
Willow Run Dr
Forest City, NC 28043
|
1,292 sq. feet
|
1 baths 3 beds |
show details | |

|
#14
Frazier Drive
Forest City, NC 28043
|
- sq. feet
|
- baths - beds |
show details | |

|
#15
Frazier Dr
Forest City, NC 28043
|
- sq. feet
|
- baths - beds |
show details | |

|
#16
Hudlow Rd
Forest City, NC 28043
|
- sq. feet
|
- baths - beds |
show details | |

|
#17
Mayflower St
Forest City, NC 28043
|
- sq. feet
|
- baths - beds |
show details | |

|
#18
Washington St
Forest City, NC 28043
|
- sq. feet
|
- baths - beds |
show details | |

|
#19
Greene Rd
Forest City, NC 28043
|
- sq. feet
|
- baths - beds |
show details | |

|
#20
Proctor School Road
Forest City, NC 28043
|
- sq. feet
|
- baths - beds |
show details |
| Photo | Address | Area | Beds / Baths | Price | Details |
|---|---|---|---|---|---|

|
#21
Oakland Rd
Forest City, NC 28043
|
- sq. feet
|
- baths - beds |
show details | |

|
#22
Cobra Dr
Forest City, NC 28043
|
- sq. feet
|
- baths - beds |
show details | |

|
#23
Andy Dr
Forest City, NC 28043
|
- sq. feet
|
- baths - beds |
show details | |

|
#24
Old Caroleen Rd
Forest City, NC 28043
|
- sq. feet
|
- baths - beds |
show details | |

|
#25
Clay St
Forest City, NC 28043
|
- sq. feet
|
- baths - beds |
show details | |

|
#26
Bostic Sunshine Hwy
Bostic, NC 28018
|
2,044 sq. feet
|
2 baths 4 beds |
$99,900
|
show details |

|
#27
Elms Dr
Forest City, NC 28043
|
- sq. feet
|
- baths - beds |
show details | |

|
#28
Cove Rd
Rutherfordton, NC 28139
|
- sq. feet
|
2 baths 4 beds |
show details | |

|
#29
Fletcher Rd
Lawndale, NC 28090
|
1,460 sq. feet
|
1 baths 2 beds |
show details | |

|
#30
Ridings Rd
Campobello, SC 29322
|
2,518 sq. feet
|
2 baths 3 beds |
show details |
| Photo | Address | Area | Beds / Baths | Price | Details |
|---|---|---|---|---|---|

|
#31
Webb Rd
Shelby, NC 28152
|
1,363 sq. feet
|
2 baths 3 beds |
show details | |

|
#32
Gardner Rd
Gaffney, SC 29341
|
- sq. feet
|
2 baths 3 beds |
show details | |

|
#33
S Mitchell St
Rutherfordton, NC 28139
|
1,336 sq. feet
|
2 baths 3 beds |
show details | |

|
#34
Hicks Rd
Rutherfordton, NC 28139
|
1,028 sq. feet
|
1 baths 3 beds |
show details | |

|
#35
Hines Rd
Mooresboro, NC 28114
|
780 sq. feet
|
1 baths 2 beds |
show details | |

|
#36
Nc 120 Hwy
Mooresboro, NC 28114
|
1,680 sq. feet
|
2 baths 3 beds |
show details | |

|
#37
Webb Rd
Ellenboro, NC 28040
|
1,652 sq. feet
|
1 baths 3 beds |
show details | |

|
#38
Luckadoo Hill Ext
Mooresboro, NC 28114
|
1,272 sq. feet
|
1 baths 3 beds |
show details | |

|
#39
Freemantown Rd
Rutherfordton, NC 28139
|
832 sq. feet
|
2 baths 2 beds |
show details | |

|
#40
Double Branch Rd
Cowpens, SC 29330
|
1,800 sq. feet
|
2 baths 3 beds |
show details |
| Photo | Address | Area | Beds / Baths | Price | Details |
|---|---|---|---|---|---|

|
#41
Birchwood Ct
Gaffney, SC 29341
|
- sq. feet
|
- baths - beds |
$29,900
|
show details |

|
#42
Miller St
Spindale, NC 28160
|
1,108 sq. feet
|
1 baths 2 beds |
show details | |

|
#43
Mccrow Rd
Mooresboro, NC 28114
|
1,064 sq. feet
|
1 baths 3 beds |
show details | |

|
#44
Harris Henrietta Rd
Mooresboro, NC 28114
|
1,162 sq. feet
|
1 baths 3 beds |
show details | |

|
#45
Rock Rd
Rutherfordton, NC 28139
|
1,288 sq. feet
|
1 baths 3 beds |
show details | |

|
#46
Fairfield Rd
Chesnee, SC 29323
|
1,162 sq. feet
|
1 baths 2 beds |
show details | |

|
#47
Arrowood Branch Rd
Chesnee, SC 29323
|
1,776 sq. feet
|
2 baths 3 beds |
show details | |

|
#48
Us 221n Hwy
Rutherfordton, NC 28139
|
2,144 sq. feet
|
1 baths 3 beds |
show details | |

|
#49
Big Island Rd
Rutherfordton, NC 28139
|
960 sq. feet
|
2 baths 3 beds |
show details | |

|
Check over 1 million property listings on Foreclosure.com!
|
browse all offers | |||


Median year apartment built: 1970
Household type by relationship:
Households: 7,517- Male householders: 902 (378 living alone), Female householders: 1,847 (629 living alone)
651 spouses (621 opposite-sex spouses), 146 unmarried partners, (146 opposite-sex unmarried partners), 2,442 children (2,311 natural, 8 adopted, 122 stepchildren), 708 grandchildren, 106 brothers or sisters, 163 parents, 0 foster children, 128 other relatives, 290 non-relatives
- In group quarters: 130
Size of family households: 621 2-persons, 401 3-persons, 249 4-persons, 102 5-persons, 78 6-persons, 183 7-or-more-persons.
Size of nonfamily households: 1,025 1-person, 167 2-persons.
644 married couples with children.
951 single-parent households (307 men, 644 women).
92.4% of residents of Forest City speak English at home.
4.6% of residents speak Spanish at home (80% speak English very well, 17% speak English not well, 3% don't speak English at all).
1.8% of residents speak Asian or Pacific Island language at home (47% speak English very well, 53% speak English not well).
0.6% of residents speak other language at home (100% speak English very well).
Foreign born population: 258 (3.4%)
(53.1% of them are naturalized citizens)
| Here: | 6.5 |
| State: | 6.4 |
| Here: | 4.4 |
| State: | 4.4 |

- Bedrooms in owner-occupied houses and condos in Forest City, North Carolina
- 0no bedroom
- 171 bedroom
- 2352 bedrooms
- 7343 bedrooms
- 2444 bedrooms
- 315+ bedrooms

- Bedrooms in renter-occupied apartments in Forest City, North Carolina
- 136no bedroom
- 1981 bedroom
- 8062 bedrooms
- 3773 bedrooms
- 404 bedrooms
- 05+ bedrooms

- Cars and other vehicles available in Forest City in owner-occupied houses/condos
- 43no vehicle
- 5141 vehicle
- 3232 vehicles
- 1693 vehicles
- 1874 vehicles
- 255+ vehicles

- Cars and other vehicles available in Forest City in renter-occupied apartments
- 230no vehicle
- 9241 vehicle
- 2952 vehicles
- 1083 vehicles
- 04 vehicles
- 05+ vehicles

- Rooms in owner-occupied houses in Forest City, North Carolina
- 01 room
- 02 rooms
- 03 rooms
- 1404 rooms
- 2385 rooms
- 2416 rooms
- 2847 rooms
- 2158 rooms
- 1439+ rooms

- Rooms in renter-occupied apartments in Forest City, North Carolina
- 1361 room
- 492 rooms
- 1123 rooms
- 5144 rooms
- 4435 rooms
- 1706 rooms
- 637 rooms
- 708 rooms
- 09+ rooms


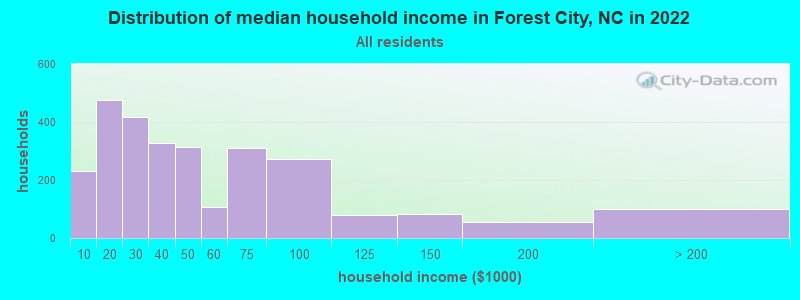
Forest City, NC household income distribution

- 232Less than $10,000
- 476$10,000 to $19,999
- 418$20,000 to $29,999
- 326$30,000 to $39,999
- 313$40,000 to $49,999
- 107$50,000 to $59,999
- 311$60,000 to $74,999
- 274$75,000 to $99,999
- 79$100,000 to $124,999
- 83$125,000 to $149,999
- 56$150,000 to $199,999
- 101$200,000 or more
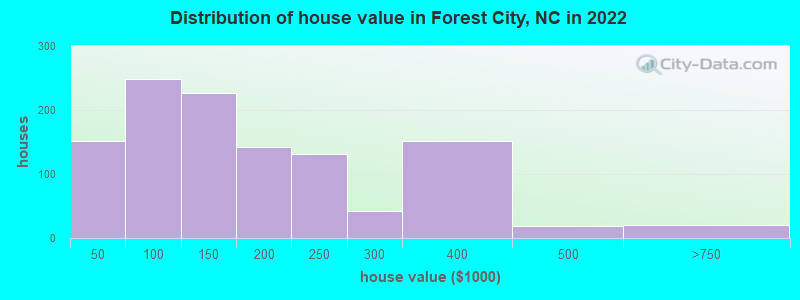
Home value of owner - occupied houses in 2022 in Forest City, NC
-
- 7Less than $10,000
- 4$10,000 to $14,999
- 7$15,000 to $19,999
- 12$25,000 to $29,999
- 84$35,000 to $39,999
- 36$40,000 to $49,999
- 27$50,000 to $59,999
- 54$60,000 to $69,999
- 72$70,000 to $79,999
- 16$80,000 to $89,999
- 42$90,000 to $99,999
- 88$100,000 to $124,999
- 139$125,000 to $149,999
- 110$150,000 to $174,999
- 31$175,000 to $199,999
- 130$200,000 to $249,999
- 41$250,000 to $299,999
- 151$300,000 to $399,999
- 19$400,000 to $499,999
- 21$500,000 to $749,999
Rent paid by renters in 2022 in Forest City, NC
-
- 82Less than $100
- 67$100 to $149
- 37$200 to $249
- 21$250 to $299
- 95$300 to $349
- 102$350 to $399
- 121$400 to $449
- 185$450 to $499
- 61$500 to $549
- 69$550 to $599
- 148$600 to $649
- 158$650 to $699
- 25$700 to $749
- 37$750 to $799
- 34$800 to $899
- 4$1,000 to $1,249
- 19$1,250 to $1,499
- 33$2,000 to $2,499
- 71$3,500 or more
- 60No cash rent


Percentage of workers working in this county: 73.5%
Number of people working at home: 134 (5.1% of all workers)
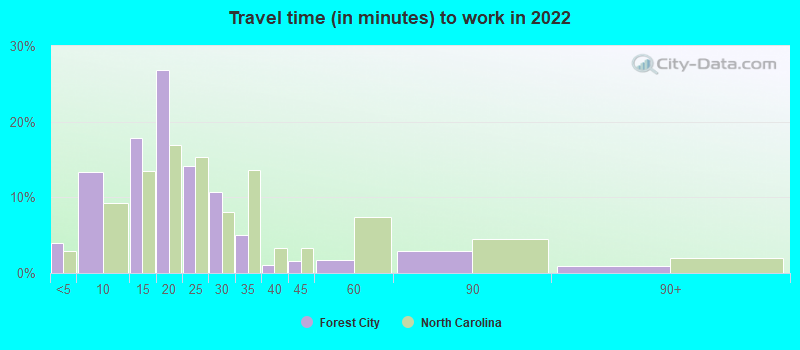
Travel time to work (commute)
- Less than 5 minutes: 144
- 5 to 9 minutes: 570
- 10 to 14 minutes: 281
- 15 to 19 minutes: 492
- 20 to 24 minutes: 217
- 25 to 29 minutes: 35
- 30 to 34 minutes: 99
- 35 to 39 minutes: 39
- 40 to 44 minutes: 48
- 45 to 59 minutes: 237
- 60 to 89 minutes: 81
- 90 or more minutes: 158
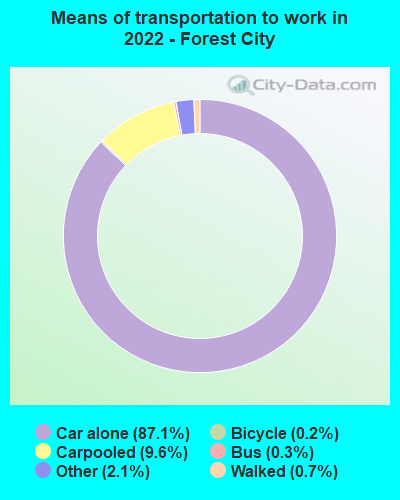
Means of transportation to work:
- Drove a car alone: 5,136 (81.1%)
- Carpooled: 593 (9.4%)
- Bus: 10 (0.2%)
- Taxi: 130 (2.1%)
- Bicycle: 9 (0.1%)
- Walked: 44 (0.7%)
- Worked at home: 134 (2.1%)

- Unemployment by race in 2022
- Unemployment rate for White non-Hispanic residents
- 2.4%Males
- 9.0%Females
- Unemployment rate for Black residents
- 5.2%Females
- Unemployment rate for other race residents
- 81.5%Males
- Unemployment rate for two or more race residents
- 13.3%Males
- 7.8%Females
- Unemployment rate for Hispanic or Latino residents
- 46.5%Males

- Year of entry for the foreign-born population in Forest City, North Carolina
- 1352010 or later
- 872000 to 2009
- 91990 to 1999
- 251980 to 1989
- 211970 to 1979
- 24Before 1970

First ancestries reported:
- American: 559 (13.3%)
- German: 356 (8.4%)
- Irish: 213 (5.1%)
- English: 162 (3.8%)
- Scotch-Irish: 69 (1.6%)
- Scottish: 54 (1.3%)
- African: 43 (1.0%)
- Italian: 37 (0.9%)
- French: 19 (0.5%)
- Estonian: 13 (0.3%)
- Welsh: 12 (0.3%)
- Trinidadian and Tobagonian: 10 (0.2%)
- Eastern European: 8 (0.2%)
- British: 4 (0.09%)
Most common places of birth for foreign-born residents (%):
| Forest City: | 51.9% (134) |
| North Carolina: | 2.9% (24,965) |
| Forest City: | 39.5% (102) |
| North Carolina: | 2.1% (18,275) |
| Forest City: | 7.8% (20) |
| North Carolina: | 24.7% (214,776) |
| Forest City: | 5.8% (15) |
| North Carolina: | 0.2% (1,928) |
| Forest City: | 4.3% (11) |
| North Carolina: | 0.4% (3,587) |
Place of birth for U.S.-born residents:
- This state: 5,389
- Other state: 1,730
- Northeast: 365
- Midwest: 127
- South: 945
- West: 292
86.3% of Forest City residents lived in the same house 1 years ago.
Out of people who lived in different houses, 31.3% lived in this county.
Out of people who lived in different counties, 36.2% lived in North Carolina.
| Forest City: | 86.3% |
| State average: | 87.3% |
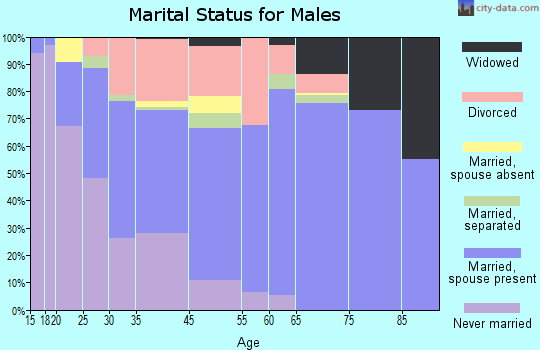
Education attainment for males 25 years and older:
- No schooling: 35
- Nursery to 4th grade: 6
- 5th and 6th grade: 10
- 7th and 8th grade: 47
- 9th grade: 63
- 10th grade: 56
- 11th grade: 15
- 12th grade, no diploma: 8
- High school graduate (or equivalency): 646
- Less than 1 year of college: 162
- Some college more than 1 year, no degree: 287
- Associate degree: 94
- Bachelor's degree: 224
- Master's degree: 0
- Professional school degree: 17
- Doctorate degree: 38

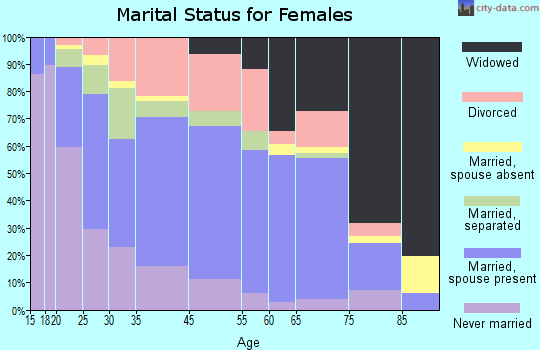
Education attainment for females 25 years and older:
- No schooling: 35
- Nursery to 4th grade: 45
- 5th and 6th grade: 11
- 7th and 8th grade: 11
- 9th grade: 27
- 10th grade: 14
- 11th grade: 30
- 12th grade, no diploma: 126
- High school graduate (or equivalency): 746
- Less than 1 year of college: 553
- Some college more than 1 year, no degree: 474
- Associate degree: 272
- Bachelor's degree: 347
- Master's degree: 214
- Professional school degree: 0
- Doctorate degree: 15

Housing units in structures:
- One, detached: 2,292
- One, attached: 49
- Two: 44
- 3 or 4: 325
- 5 to 9: 358
- 10 to 19: 33
- 20 to 49: 107
- 50 or more: 27
- Mobile homes: 101
House/condo owner moved in on average 19 years ago
Renter moved in on average 2 years ago

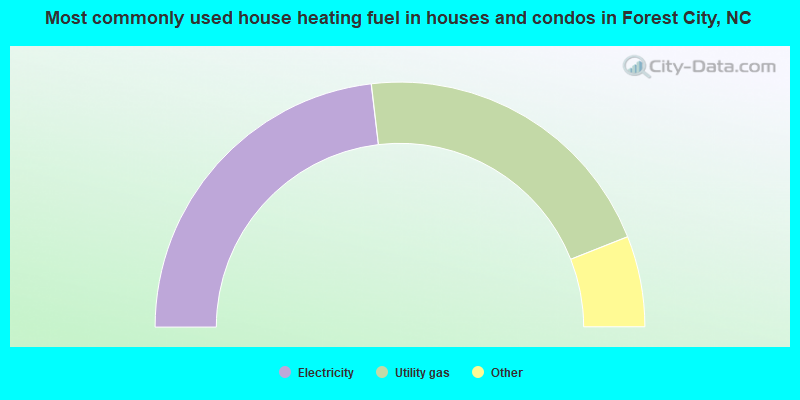
- 46.3%Electricity
- 41.8%Utility gas
- 3.8%Bottled, tank, or LP gas
- 2.9%No fuel used
- 2.7%Fuel oil, kerosene, etc.
- 1.7%Wood
- 0.7%Other fuel
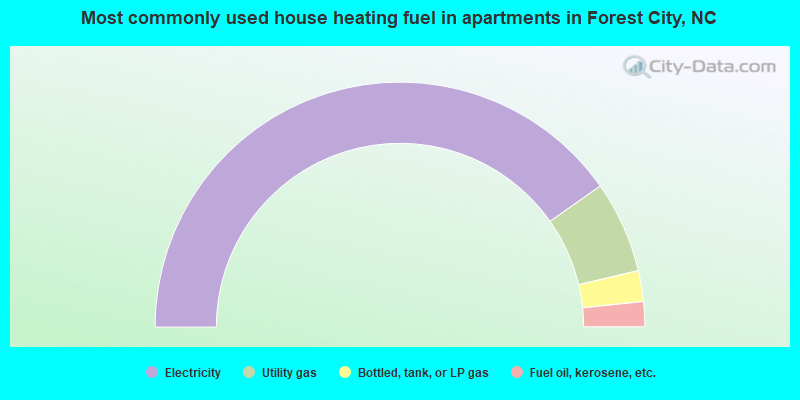
- 80.5%Electricity
- 12.1%Utility gas
- 4.1%Bottled, tank, or LP gas
- 3.3%Fuel oil, kerosene, etc.
Private vs. public school enrollment:
| Here: | 1.9% |
| North Carolina: | 13.8% |
| Here: | 8.2% |
| North Carolina: | 11.9% |
| Here: | 7.2% |
| North Carolina: | 19.3% |


