Flat Rock, IL (Illinois) Houses and Residents
| Flat Rock: | $59,243 |
| Illinois: | $251,600 |
Mean price in 2022:
Detached houses: $72,172
Here: $72,172 State: $310,164 Mobile homes: $55,847
Here: $55,847 State: $78,855
Total population: 325 (Urban population: 0, Rural population: 415 (8 farm, 407 nonfarm))
Houses: 198 (179 occupied: 158 owner occupied, 23 renter occupied)
| % of renters here: | 13% |
| State: | 33% |
Housing density: 231 houses/condos per square mile
Median price asked for vacant for-sale houses and condos in 2022 in this county: $140,039.
Median contract rent in 2022: $527
Median rent asked for vacant for-rent units in 2022: $631
Median gross rent in Flat Rock, IL in 2022: $860
Housing units in Flat Rock with a mortgage: 50 (7 second mortgage, 0 home equity loan, 8 both second mortgage and home equity loan)
Houses without a mortgage: 0
Median household income for houses/condos with a mortgage: $66,588
Median household income for apartments without a mortgage: $45,139
Median monthly housing costs: $447
Compare current foreclosures near Flat Rock, IL:
| Photo | Address | Area | Beds / Baths | Price | Details |
|---|---|---|---|---|---|

|
#1
Gollyville Rd
Flat Rock, IL 62427
|
- sq. feet
|
- baths - beds |
show details | |

|
#2
N Plum St
Flat Rock, IL 62427
|
- sq. feet
|
- baths - beds |
show details | |

|
#3
E Lamotte St
Palestine, IL 62451
|
1,072 sq. feet
|
1 baths 3 beds |
$107,000
|
show details |

|
#4
Lexington Ave
Lawrenceville, IL 62439
|
777 sq. feet
|
1 baths 2 beds |
$29,900
|
show details |

|
#5
N Plum St
Flat Rock, IL 62427
|
- sq. feet
|
- baths - beds |
show details | |

|
#6
N Clay St
Robinson, IL 62454
|
- sq. feet
|
1 baths 3 beds |
$43,700
|
show details |

|
#7
E Illinois St
Oblong, IL 62449
|
1,849 sq. feet
|
1 baths 4 beds |
show details | |

|
#8
State Route 250
Lawrenceville, IL 62439
|
1,073 sq. feet
|
2 baths 3 beds |
show details | |

|
#9
E Eaton St
Carlisle, IN 47838
|
1,536 sq. feet
|
1 baths 4 beds |
show details | |

|
#10
Church St
Bridgeport, IL 62417
|
3,142 sq. feet
|
2 baths 4 beds |
show details |
| Photo | Address | Area | Beds / Baths | Price | Details |
|---|---|---|---|---|---|

|
#11
Church St
Oaktown, IN 47561
|
1,476 sq. feet
|
1 baths 3 beds |
show details | |

|
#12
Maple Ave
Oaktown, IN 47561
|
1,474 sq. feet
|
1 baths 3 beds |
show details | |

|
#13
N Turman St
Carlisle, IN 47838
|
2,004 sq. feet
|
1 baths 3 beds |
show details | |

|
#14
S Alexander St
Carlisle, IN 47838
|
2,276 sq. feet
|
1 baths 2 beds |
show details | |

|
#15
E Harrison St
Carlisle, IN 47838
|
1,831 sq. feet
|
1 baths 4 beds |
show details | |

|
#16
N West St
Sullivan, IN 47882
|
1,864 sq. feet
|
1 baths 3 beds |
show details | |

|
#17
N Alexander St
Carlisle, IN 47838
|
1,728 sq. feet
|
2 baths - beds |
show details | |

|
#18
Oakwood Rd
Carlisle, IN 47838
|
1,293 sq. feet
|
3 baths 3 beds |
show details | |

|
#19
W Jefferson Ave
Vincennes, IN 47591
|
1,427 sq. feet
|
1 baths 3 beds |
show details | |

|
#20
S 5th St
Merom, IN 47861
|
1,226 sq. feet
|
1 baths 3 beds |
show details |
| Photo | Address | Area | Beds / Baths | Price | Details |
|---|---|---|---|---|---|

|
#21
N State St
Oaktown, IN 47561
|
868 sq. feet
|
1 baths 3 beds |
show details | |

|
#22
S Merom Station Rd
Merom, IN 47861
|
1,764 sq. feet
|
2 baths - beds |
show details | |

|
#23
Benjamin Ln
Vincennes, IN 47591
|
- sq. feet
|
- baths - beds |
show details | |

|
#24
Emily Ln
Bridgeport, IL 62417
|
- sq. feet
|
- baths - beds |
show details | |

|
#25
E Plum St
Robinson, IL 62454
|
- sq. feet
|
- baths - beds |
show details | |

|
#26
N Turman St
Carlisle, IN 47838
|
- sq. feet
|
- baths - beds |
show details | |

|
#27
1/2 N Main St
Bridgeport, IL 62417
|
- sq. feet
|
- baths - beds |
show details | |

|
#28
N Thunderhill Dr
Vincennes, IN 47591
|
- sq. feet
|
- baths - beds |
show details | |

|
#29
State Highway 1
Robinson, IL 62454
|
- sq. feet
|
- baths - beds |
show details | |

|
#30
E State St
Bridgeport, IL 62417
|
- sq. feet
|
- baths - beds |
show details |
| Photo | Address | Area | Beds / Baths | Price | Details |
|---|---|---|---|---|---|

|
#31
Kings Hill Rd
Sumner, IL 62466
|
- sq. feet
|
- baths - beds |
show details | |

|
#32
E Cedar St
Sumner, IL 62466
|
- sq. feet
|
- baths - beds |
show details | |

|
#33
N Park St
Oaktown, IN 47561
|
- sq. feet
|
- baths - beds |
show details | |

|
#34
15th St
Lawrenceville, IL 62439
|
- sq. feet
|
- baths - beds |
show details | |

|
#35
Peachtree Rd
Lawrenceville, IL 62439
|
- sq. feet
|
- baths - beds |
show details | |

|
#36
E Mefford St
Robinson, IL 62454
|
- sq. feet
|
- baths - beds |
show details | |

|
#37
N Frontage Ln
Bridgeport, IL 62417
|
- sq. feet
|
- baths - beds |
show details | |

|
#38
E 900th Ave
Robinson, IL 62454
|
- sq. feet
|
- baths - beds |
show details | |

|
#39
11th St
Lawrenceville, IL 62439
|
- sq. feet
|
- baths - beds |
show details | |

|
#40
Billett Ln
Lawrenceville, IL 62439
|
- sq. feet
|
- baths - beds |
show details |
| Photo | Address | Area | Beds / Baths | Price | Details |
|---|---|---|---|---|---|

|
#41
12th St Apt 115
Lawrenceville, IL 62439
|
- sq. feet
|
- baths - beds |
show details | |

|
#42
James Courtney Blvd, Apt 20
Lawrenceville, IL 62439
|
- sq. feet
|
- baths - beds |
show details | |

|
#43
James Courtney Blvd, Apt 12
Lawrenceville, IL 62439
|
- sq. feet
|
- baths - beds |
show details | |

|
#44
Collins Ln
Lawrenceville, IL 62439
|
- sq. feet
|
- baths - beds |
show details | |

|
#45
S Prairie St Apt E1
Robinson, IL 62454
|
- sq. feet
|
- baths - beds |
show details | |

|
#46
E South Ave
Sumner, IL 62466
|
- sq. feet
|
- baths - beds |
show details | |

|
#47
S May St
Sumner, IL 62466
|
- sq. feet
|
- baths - beds |
show details | |

|
#48
S Willow Dr
Robinson, IL 62454
|
- sq. feet
|
- baths - beds |
show details | |

|
#49
N Steele St
Palestine, IL 62451
|
- sq. feet
|
- baths - beds |
show details | |

|
Check over 1 million property listings on Foreclosure.com!
|
browse all offers | |||


Median year apartment built: 1941
Household type by relationship:
Households: 448- Male householders: 112 (41 living alone), Female householders: 64 (18 living alone)
117 spouses (117 opposite-sex spouses), 9 unmarried partners, (9 opposite-sex unmarried partners), 130 children (130 natural, 0 adopted, 0 stepchildren), 3 grandchildren, 0 brothers or sisters, 0 parents, 1 foster children, 2 other relatives, 5 non-relatives
Size of family households: 46 2-persons, 29 3-persons, 24 4-persons, 12 5-persons.
Size of nonfamily households: 63 1-person, 2 2-persons, 4 3-persons.
101 married couples with children.
12 single-parent households (9 men, 3 women).
99.3% of residents of Flat Rock speak English at home.
| Here: | 5.9 |
| State: | 6.4 |
| Here: | 5.2 |
| State: | 4.1 |

- Bedrooms in owner-occupied houses and condos in Flat Rock, Illinois
- 16no bedroom
- 61 bedroom
- 622 bedrooms
- 583 bedrooms
- 134 bedrooms
- 35+ bedrooms

- Bedrooms in renter-occupied apartments in Flat Rock, Illinois
- 0no bedroom
- 01 bedroom
- 62 bedrooms
- 123 bedrooms
- 54 bedrooms
- 05+ bedrooms

- Cars and other vehicles available in Flat Rock in owner-occupied houses/condos
- 7no vehicle
- 421 vehicle
- 632 vehicles
- 353 vehicles
- 84 vehicles
- 45+ vehicles

- Cars and other vehicles available in Flat Rock in renter-occupied apartments
- 5no vehicle
- 11 vehicle
- 52 vehicles
- 03 vehicles
- 124 vehicles
- 05+ vehicles

- Rooms in owner-occupied houses in Flat Rock, Illinois
- 01 room
- 162 rooms
- 03 rooms
- 154 rooms
- 335 rooms
- 416 rooms
- 127 rooms
- 238 rooms
- 189+ rooms

- Rooms in renter-occupied apartments in Flat Rock, Illinois
- 01 room
- 02 rooms
- 03 rooms
- 14 rooms
- 135 rooms
- 06 rooms
- 57 rooms
- 08 rooms
- 49+ rooms


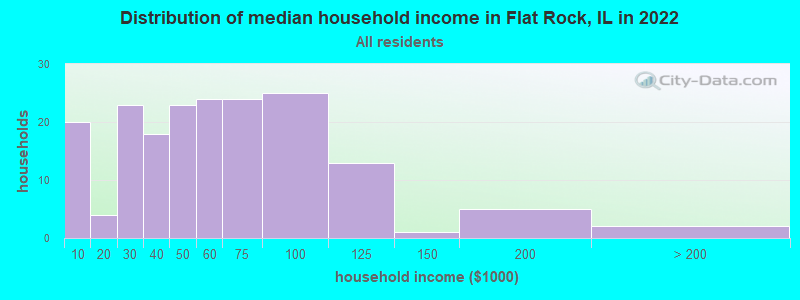
Flat Rock, IL household income distribution

- 20Less than $10,000
- 4$10,000 to $19,999
- 23$20,000 to $29,999
- 18$30,000 to $39,999
- 23$40,000 to $49,999
- 24$50,000 to $59,999
- 24$60,000 to $74,999
- 25$75,000 to $99,999
- 13$100,000 to $124,999
- 1$125,000 to $149,999
- 5$150,000 to $199,999
- 2$200,000 or more
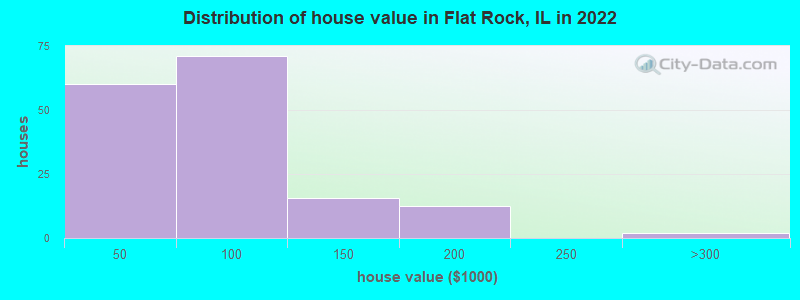
Home value of owner - occupied houses in 2022 in Flat Rock, IL
-
- 2Less than $10,000
- 22$10,000 to $14,999
- 4$15,000 to $19,999
- 8$20,000 to $24,999
- 7$25,000 to $29,999
- 5$30,000 to $34,999
- 7$40,000 to $49,999
- 26$50,000 to $59,999
- 7$60,000 to $69,999
- 2$70,000 to $79,999
- 26$80,000 to $89,999
- 0$90,000 to $99,999
- 4$100,000 to $124,999
- 10$125,000 to $149,999
- 12$150,000 to $174,999
- 2$250,000 to $299,999
Rent paid by renters in 2022 in Flat Rock, IL
-
- 4$200 to $249
- 3$500 to $549
- 3$550 to $599
- 11No cash rent


Percentage of workers working in this county: 64.1%
Number of people working at home: 15 (7.8% of all workers)
Travel time to work (commute)
- Less than 5 minutes: 12
- 5 to 9 minutes: 0
- 10 to 14 minutes: 19
- 15 to 19 minutes: 41
- 20 to 24 minutes: 28
- 25 to 29 minutes: 3
- 30 to 34 minutes: 27
- 35 to 39 minutes: 2
- 40 to 44 minutes: 14
- 45 to 59 minutes: 6
- 60 to 89 minutes: 14
- 90 or more minutes: 0
Means of transportation to work:
- Drove a car alone: 167 (89.3%)
- Carpooled: 9 (4.8%)
- Bus or trolley bus: 3 (1.6%)
- Walked: 3 (1.6%)
- Worked at home: 5 (2.7%)

- Unemployment by race in 2022
- Unemployment rate for White non-Hispanic residents
- 6.6%Males
- 3.8%Females

- Year of entry for the foreign-born population in Flat Rock, Illinois
- 21995 to March 2000
- 01990 to 1994
- 01985 to 1989
- 01980 to 1984
- 01975 to 1979
- 01970 to 1974
- 01965 to 1969
- 0Before 1965

First ancestries reported:
- German: 49 (34.5%)
- American: 32 (22.6%)
- English: 23 (16.2%)
- Norwegian: 9 (6.3%)
- Irish: 6 (4.2%)
- Scotch-Irish: 2 (1.4%)
- Swiss: 2 (1.4%)
Most common places of birth for foreign-born residents (%):
| Flat Rock: | 100.0% (2) |
| Illinois: | 0.8% (12,544) |
Place of birth for U.S.-born residents:
- This state: 303
- Other state: 143
- Northeast: 2
- Midwest: 135
- South: 7
- West: 0
93.9% of Flat Rock residents lived in the same house 1 years ago.
Out of people who lived in different houses, 40.9% lived in this county.
Out of people who lived in different counties, 100.0% lived in Illinois.
| Flat Rock: | 93.9% |
| State average: | 88.3% |
Education attainment for males 25 years and older:
- No schooling: 0
- Nursery to 4th grade: 0
- 5th and 6th grade: 0
- 7th and 8th grade: 0
- 9th grade: 6
- 10th grade: 0
- 11th grade: 0
- 12th grade, no diploma: 0
- High school graduate (or equivalency): 49
- Less than 1 year of college: 22
- Some college more than 1 year, no degree: 25
- Associate degree: 27
- Bachelor's degree: 20
- Master's degree: 0
- Professional school degree: 0
- Doctorate degree: 0

Education attainment for females 25 years and older:
- No schooling: 0
- Nursery to 4th grade: 0
- 5th and 6th grade: 0
- 7th and 8th grade: 0
- 9th grade: 9
- 10th grade: 0
- 11th grade: 0
- 12th grade, no diploma: 3
- High school graduate (or equivalency): 39
- Less than 1 year of college: 1
- Some college more than 1 year, no degree: 27
- Associate degree: 31
- Bachelor's degree: 16
- Master's degree: 3
- Professional school degree: 0
- Doctorate degree: 0


Housing units in structures:
- One, detached: 172
- Mobile homes: 26
Median worth of mobile homes: $64,034
Housing units lacking complete kitchen facilities in 2022: 5.6%
House/condo owner moved in on average 16 years ago
Renter moved in on average 6 years ago

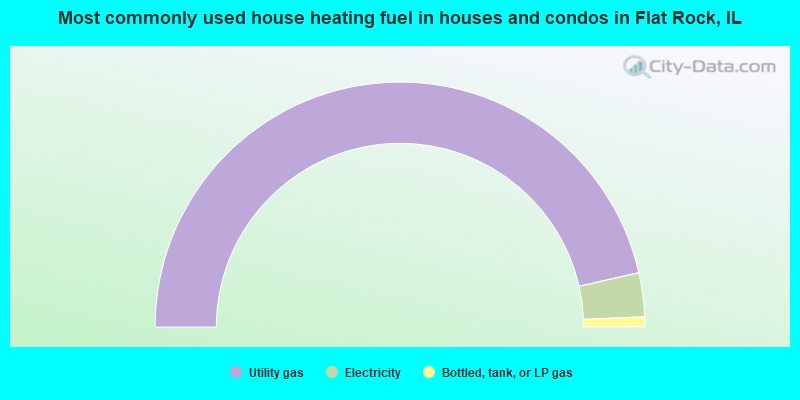
- 92.9%Utility gas
- 5.8%Electricity
- 1.3%Bottled, tank, or LP gas
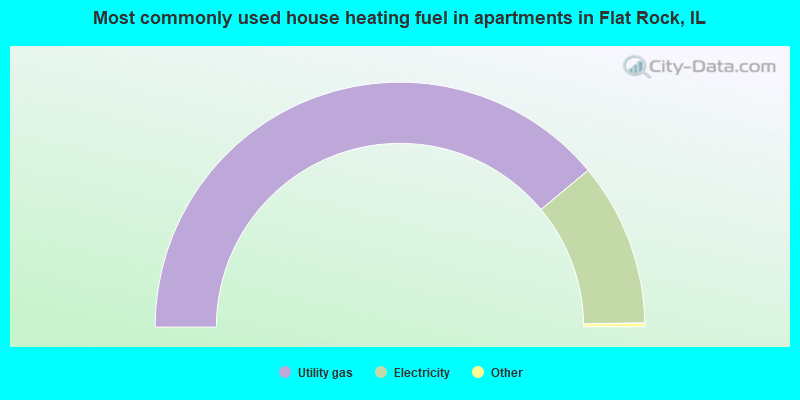
- 78.3%Utility gas
- 21.7%Electricity
Private vs. public school enrollment:
| Here: | 0.0% |
| Illinois: | 13.3% |
| Here: | 0.0% |
| Illinois: | 9.9% |
| Here: | 0.0% |
| Illinois: | 27.4% |


