Fayetteville, NC (North Carolina) Houses and Residents
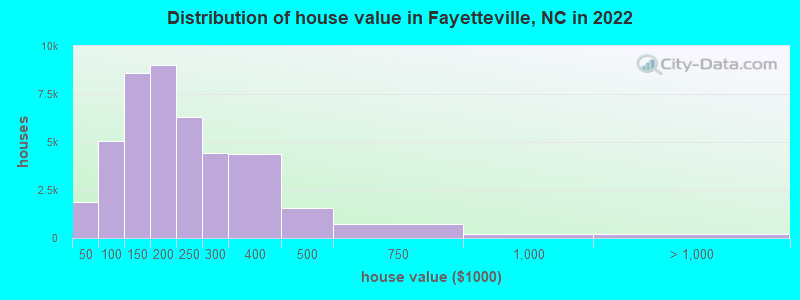
Estimated median house or condo value in 2022: $179,500 (it was $87,200 in 2000 )
Fayetteville:
$179,500North Carolina:
$280,600
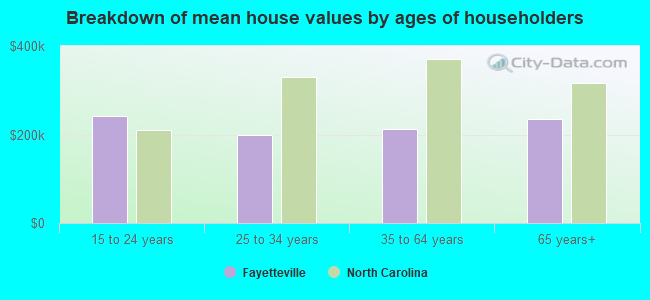
Lower value quartile - upper value quartile: $122,400 - $261,400Mean price in 2022: Detached houses: $257,346 Here:
$257,346State:
$375,326
Townhouses or other attached units: $284,565 Here:
$284,565State:
$317,935
In 2-unit structures: $177,594 Here:
$177,594State:
$250,488
In 3-to-4-unit structures: $288,149 Here:
$288,149State:
$254,939
In 5-or-more-unit structures: $238,854 Here:
$238,854State:
$329,290
Mobile homes: $125,949 Here:
$125,949State:
$124,933
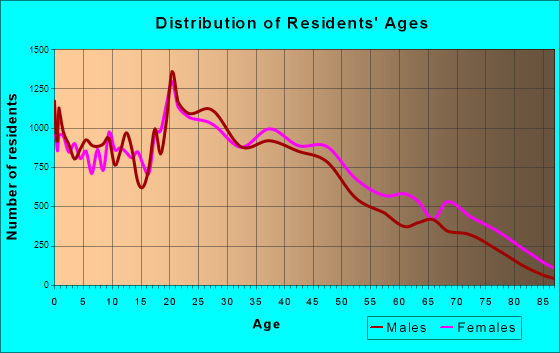
Total population: 203,948 (Urban population: 120,581, Rural population: 262 (all nonfarm) )
Houses: 92,076 (84,755 occupied: 41,955 owner occupied, 42,800 renter occupied )
% of renters here:
50%State:
33%
Housing density: 1,567 houses/condos per square mile
Median price asked for vacant for-sale houses and condos in 2022: $82,896.
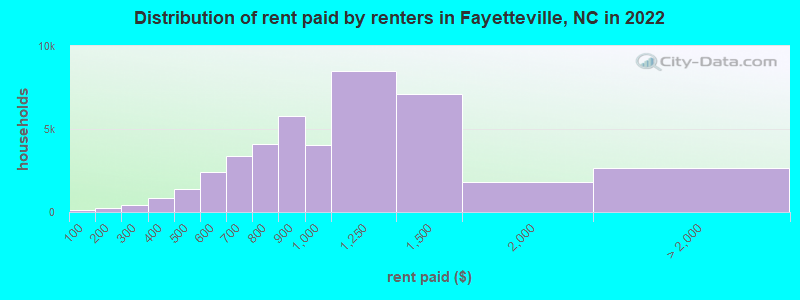
Median contract rent in 2022: $942 (lower quartile is $746, upper quartile is $1,231)
Median rent asked for vacant for-rent units in 2022: $769
Median gross rent in Fayetteville, NC in 2022: $1,160
Housing units in Fayetteville with a mortgage: 26,474 (1,902 second mortgage, 57 home equity loan, 1,478 both second mortgage and home equity loan )Houses without a mortgage: 342
Median household income for houses/condos with a mortgage: $79,032
Median household income for apartments without a mortgage: $63,190
Median monthly housing costs: $1,099
Data:
Median house or condo value ($)
Median house or condo value ($ change since 2000)
Median house or condo value ($) - White
Median house or condo value ($) - Black or African American
Median house or condo value ($) - Asian
Median house or condo value ($) - Hispanic or Latino
Median house or condo value ($) - American Indian and Alaska Native
Median house or condo value ($) - Multirace
Median house or condo value ($) - Other Race
Median price asked for mobile homes ($)
Household density (households per square mile)
Mean house or condo value by units in structure - 1, detached ($)
Mean house or condo value by units in structure - 1, attached ($)
Mean house or condo value by units in structure - 2 ($)
Mean house or condo value by units in structure by units in structure - 3 or 4 ($)
Mean house or condo value by units in structure - 5 or more ($)
Mean house or condo value by units in structure - Boat, RV, van, etc. ($)
Mean house or condo value by units in structure - Mobile home ($)
Median contract rent ($)
Median contract rent - Lower quartile ($)
Median contract rent - Upper quartile ($)
Median gross rent ($)
Urban houses (%)
Rural houses (%)
Houses occupied (%)
Houses occupied (% change since 2000)
Houses owner occupied (%)
Houses owner occupied (% change since 2000)
Houses renter occupied (%)
Houses renter occupied (% change since 2000)
Vacant housing units - For rent (%)
Vacant housing units - For rent (% change since 2000)
Vacant housing units - For sale only (%)
Vacant housing units - For sale only (% change since 2000)
Vacant housing units - Rented or sold, not occupied (%)
Vacant housing units - Rented or sold, not occupied (% change since 2000)
Vacant housing units - For seasonal, recreational, or occasional use (%)
Vacant housing units - For seasonal, recreational, or occasional use (% change since 2000)
Vacant housing units - For migrant workers (%)
Vacant housing units - For migrant workers (% change since 2000)
Vacant housing units - Other vacant (%)
Vacant housing units - Other vacant (% change since 2000)
Median monthly housing costs ($)
Median household income for houses/condos with a mortgage ($)
Median household income for houses/condos without a mortgage ($)
Median household income ($)
Median household income ($) - White
Median household income ($) - Black or African American
Median household income ($) - Asian
Median household income ($) - Hispanic or Latino
Median household income ($) - American Indian and Alaska Native
Median household income ($) - Multirace
Median household income ($) - Other Race
Mortgage status - with mortgage (%)
Mortgage status - with second mortgage (%)
Mortgage status - with home equity loan (%)
Mortgage status - with both second mortgage and home equity loan (%)
Mortgage status - without a mortgage (%)
Median year house/condo built
Median year apartment built
Household type by relationship - Male householder living alone (%)
Household type by relationship - Male householder not living alone (%)
Household type by relationship - Female householder living alone (%)
Household type by relationship - Female householder not living alone (%)
Household type by relationship - Opposite-Sex spouse (%)
Household type by relationship - Same-Sex spouse (%)
Household type by relationship - Opposite-Sex unmarried partner (%)
Household type by relationship - Same-Sex unmarried partner (%)
Household type by relationship - In group quarters (%)
Size of family households - 2-person household (%)
Size of family households - 3-person household (%)
Size of family households - 4-person household (%)
Size of family households - 5-person household (%)
Size of family households - 6-person household (%)
Size of family households - 7-or-more-person household (%)
Size of nonfamily households - 1-person household (%)
Size of nonfamily households - 2-person household (%)
Size of nonfamily households - 3-person household (%)
Size of nonfamily households - 4-person household (%)
Size of nonfamily households - 5-person household (%)
Size of nonfamily households - 6-person household (%)
Size of nonfamily households - 7-or-moreperson household (%)
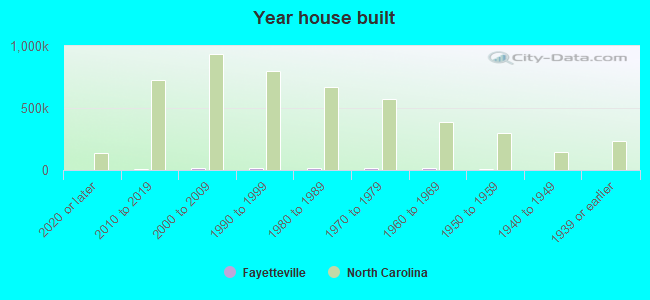
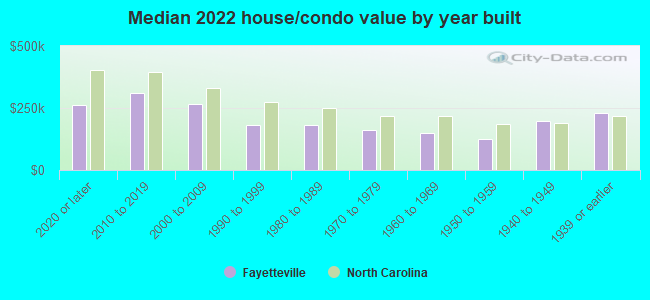
Year house built - Built 2010 or later (%)
Year house built - Built 2000 to 2009 (%)
Year house built - Built 1990 to 1999 (%)
Year house built - Built 1980 to 1989 (%)
Year house built - Built 1970 to 1979 (%)
Year house built - Built 1960 to 1969 (%)
Year house built - Built 1950 to 1959 (%)
Year house built - Built 1940 to 1949 (%)
Year house built - Built 1939 or earlier (%)
Median number of rooms in houses and condos
Median number of rooms in apartments
Median number of bedrooms in owner occupied houses
Mean number of bedrooms in owner occupied houses
Median number of bedrooms in renter occupied houses
Mean number of bedrooms in renter occupied houses
Median number of vehichles in owner occupied houses
Mean number of vehichles in owner occupied houses
Median number of vehichles in renter occupied houses
Mean number of vehichles in renter occupied houses
Rooms in owner-occupied houses - 1 room (%)
Rooms in owner-occupied houses - 2 rooms (%)
Rooms in owner-occupied houses - 3 rooms (%)
Rooms in owner-occupied houses - 4 rooms (%)
Rooms in owner-occupied houses - 5 rooms (%)
Rooms in owner-occupied houses - 6 rooms (%)
Rooms in owner-occupied houses - 7 rooms (%)
Rooms in owner-occupied houses - 8 rooms (%)
Rooms in owner-occupied houses - 9+ rooms (%)
Rooms in renter-occupied houses - 1 room (%)
Rooms in renter-occupied houses - 2 rooms (%)
Rooms in renter-occupied houses - 3 rooms (%)
Rooms in renter-occupied houses - 4 rooms (%)
Rooms in renter-occupied houses - 5 rooms (%)
Rooms in renter-occupied houses - 6 rooms (%)
Rooms in renter-occupied houses - 7 rooms (%)
Rooms in renter-occupied houses - 8 rooms (%)
Rooms in renter-occupied houses - 9+ rooms (%)
Bedrooms in owner-occupied houses - no bedrooms (%)
Bedrooms in owner-occupied houses - 1 bedroom (%)
Bedrooms in owner-occupied houses - 2 bedrooms (%)
Bedrooms in owner-occupied houses - 3 bedrooms (%)
Bedrooms in owner-occupied houses - 4 bedrooms (%)
Bedrooms in owner-occupied houses - 5+ bedrooms (%)
Bedrooms in renter-occupied houses - no bedrooms (%)
Bedrooms in renter-occupied houses - 1 bedroom (%)
Bedrooms in renter-occupied houses - 2 bedrooms (%)
Bedrooms in renter-occupied houses - 3 bedrooms (%)
Bedrooms in renter-occupied houses - 4 bedrooms (%)
Bedrooms in renter-occupied houses - 5+ bedrooms (%)
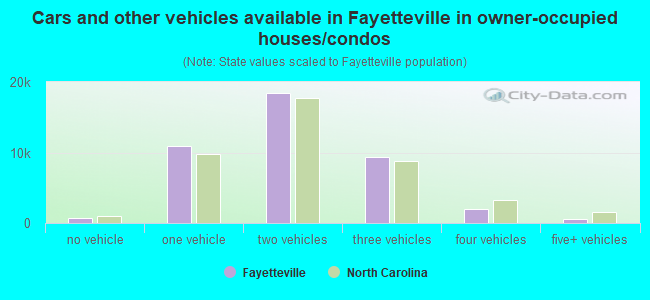
Vehicles available in owner-occupied houses - no vehicle available (%)
Vehicles available in owner-occupied houses - 1 vehicle available(%)
Vehicles available in owner-occupied houses - 2 Vehicles available (%)
Vehicles available in owner-occupied houses - 3 Vehicles available (%)
Vehicles available in owner-occupied houses - 4 Vehicles available (%)
Vehicles available in owner-occupied houses - 5+ Vehicles available (%)
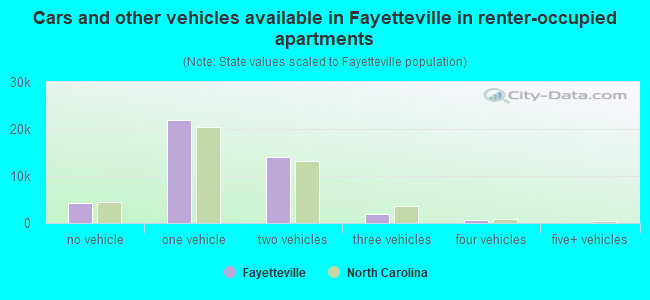
Vehicles available in renter-occupied houses - no vehicle available (%)
Vehicles available in renter-occupied houses - 1 vehicle available (%)
Vehicles available in renter-occupied houses - 2 Vehicles available (%)
Vehicles available in renter-occupied houses - 3 Vehicles available (%)
Vehicles available in renter-occupied houses - 4 Vehicles available (%)
Vehicles available in renter-occupied houses - 5+ Vehicles available (%)
Housing units in structures - 1, detached (%)
Housing units in structures - 1, attached (%)
Housing units in structures - 2 (%)
Housing units in structures - 3 or 4 (%)
Housing units in structures - 5 to 9 (%)
Housing units in structures - 10 to 19 (%)
Housing units in structures - 20 to 49 (%)
Housing units in structures - 50 or more (%)
Housing units in structures - Mobile home (%)
Housing units in structures - Boat, RV, van, etc. (%)
Housing units in structures - Owners - 1, detached (%)
Housing units in structures - Owners - 1, attached (%)
Housing units in structures - Owners - 2 (%)
Housing units in structures - Owners - 3 or 4 (%)
Housing units in structures - Owners - 5 to 9 (%)
Housing units in structures - Owners - 10 to 19 (%)
Housing units in structures - Owners - 20 to 49 (%)
Housing units in structures - Owners - 50 or more (%)
Housing units in structures - Owners - Mobile home (%)
Housing units in structures - Owners - Boat, RV, van, etc. (%)
Housing units in structures - Renters - 1, detached (%)
Housing units in structures - Renters - 1, attached (%)
Housing units in structures - Renters - 2 (%)
Housing units in structures - Renters - 3 or 4 (%)
Housing units in structures - Renters - 5 to 9 (%)
Housing units in structures - Renters - 10 to 19 (%)
Housing units in structures - Renters - 20 to 49 (%)
Housing units in structures - Renters - 50 or more (%)
Housing units in structures - Renters - Mobile home (%)
Housing units in structures - Renters - Boat, RV, van, etc. (%)
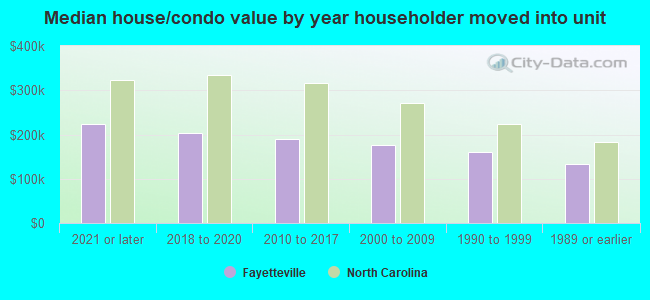
House/condo owner moved in on average (years ago)
Renter moved in on average (years ago)
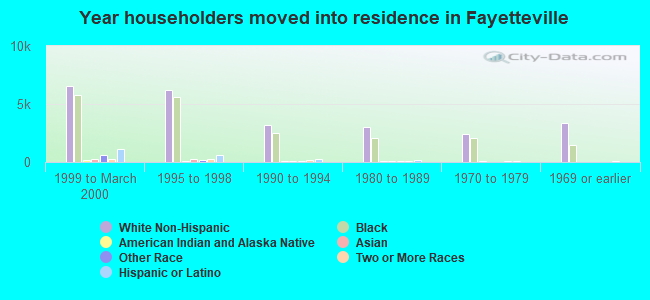
Year householder moved into unit - Moved in 1999 to March 2000 (%)
Year householder moved into unit - Moved in 1999 to March 2000 (%) - White
Year householder moved into unit - Moved in 1999 to March 2000 (%) - Black or African American
Year householder moved into unit - Moved in 1999 to March 2000 (%) - Asian
Year householder moved into unit - Moved in 1999 to March 2000 (%) - Hispanic or Latino
Year householder moved into unit - Moved in 1999 to March 2000 (%) - American Indian and Alaska Native
Year householder moved into unit - Moved in 1999 to March 2000 (%) - Multirace
Year householder moved into unit - Moved in 1999 to March 2000 (%) - Other Race
Year householder moved into unit - Moved in 1995 to 1998 (%)
Year householder moved into unit - Moved in 1995 to 1998 (%) - White
Year householder moved into unit - Moved in 1995 to 1998 (%) - Black or African American
Year householder moved into unit - Moved in 1995 to 1998 (%) - Asian
Year householder moved into unit - Moved in 1995 to 1998 (%) - Hispanic or Latino
Year householder moved into unit - Moved in 1995 to 1998 (%) - American Indian and Alaska Native
Year householder moved into unit - Moved in 1995 to 1998 (%) - Multirace
Year householder moved into unit - Moved in 1995 to 1998 (%) - Other Race
Year householder moved into unit - Moved in 1990 to 1994 (%)
Year householder moved into unit - Moved in 1990 to 1994 (%) - White
Year householder moved into unit - Moved in 1990 to 1994 (%) - Black or African American
Year householder moved into unit - Moved in 1990 to 1994 (%) - Asian
Year householder moved into unit - Moved in 1990 to 1994 (%) - Hispanic or Latino
Year householder moved into unit - Moved in 1990 to 1994 (%) - American Indian and Alaska Native
Year householder moved into unit - Moved in 1990 to 1994 (%) - Multirace
Year householder moved into unit - Moved in 1990 to 1994 (%) - Other Race
Year householder moved into unit - Moved in 1980 to 1989 (%)
Year householder moved into unit - Moved in 1980 to 1989 (%) - White
Year householder moved into unit - Moved in 1980 to 1989 (%) - Black or African American
Year householder moved into unit - Moved in 1980 to 1989 (%) - Asian
Year householder moved into unit - Moved in 1980 to 1989 (%) - Hispanic or Latino
Year householder moved into unit - Moved in 1980 to 1989 (%) - American Indian and Alaska Native
Year householder moved into unit - Moved in 1980 to 1989 (%) - Multirace
Year householder moved into unit - Moved in 1980 to 1989 (%) - Other Race
Year householder moved into unit - Moved in 1970 to 1979 (%)
Year householder moved into unit - Moved in 1970 to 1979 (%) - White
Year householder moved into unit - Moved in 1970 to 1979 (%) - Black or African American
Year householder moved into unit - Moved in 1970 to 1979 (%) - Asian
Year householder moved into unit - Moved in 1970 to 1979 (%) - Hispanic or Latino
Year householder moved into unit - Moved in 1970 to 1979 (%) - American Indian and Alaska Native
Year householder moved into unit - Moved in 1970 to 1979 (%) - Multirace
Year householder moved into unit - Moved in 1970 to 1979 (%) - Other Race
Year householder moved into unit - Moved in 1969 or earlier (%)
Year householder moved into unit - Moved in 1969 or earlier (%) - White
Year householder moved into unit - Moved in 1969 or earlier (%) - Black or African American
Year householder moved into unit - Moved in 1969 or earlier (%) - Asian
Year householder moved into unit - Moved in 1969 or earlier (%) - Hispanic or Latino
Year householder moved into unit - Moved in 1969 or earlier (%) - American Indian and Alaska Native
Year householder moved into unit - Moved in 1969 or earlier (%) - Multirace
Year householder moved into unit - Moved in 1969 or earlier (%) - Other Race
Housing units lacking complete plumbing facilities (%)
Housing units lacking complete kitchen facilities (%)
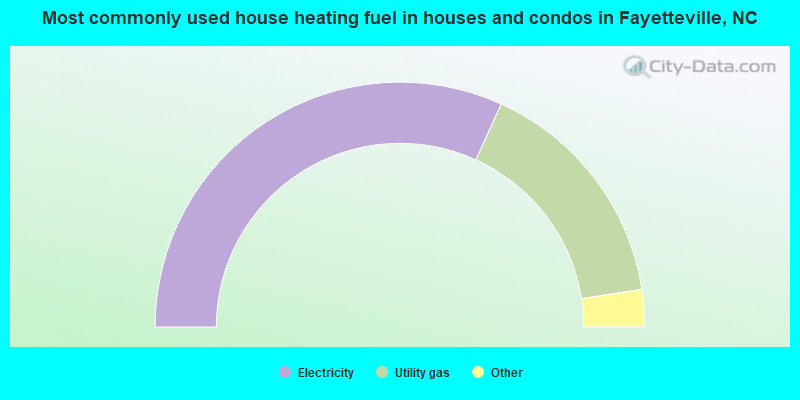
House heating fuel used in houses and condos - Utility gas (%)
House heating fuel used in houses and condos - Bottled, tank, or LP gas (%)
House heating fuel used in houses and condos - Electricity (%)
House heating fuel used in houses and condos - Fuel oil, kerosene, etc. (%)
House heating fuel used in houses and condos - Coal or coke (%)
House heating fuel used in houses and condos - Wood (%)
House heating fuel used in houses and condos - Solar energy (%)
House heating fuel used in houses and condos - Other fuel (%)
House heating fuel used in houses and condos - No fuel used (%)
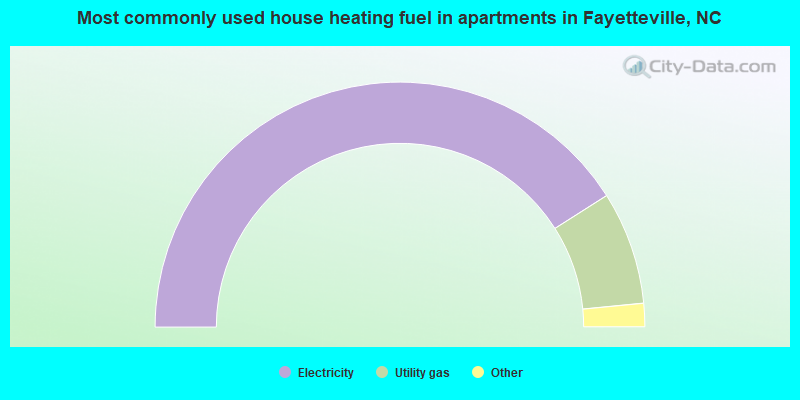
House heating fuel used in apartments - Utility gas (%)
House heating fuel used in apartments - Bottled, tank, or LP gas (%)
House heating fuel used in apartments - Electricity (%)
House heating fuel used in apartments - Fuel oil, kerosene, etc. (%)
House heating fuel used in apartments - Coal or coke (%)
House heating fuel used in apartments - Wood (%)
House heating fuel used in apartments - Solar energy (%)
House heating fuel used in apartments - Other fuel (%)
House heating fuel used in apartments - No fuel used (%)
Latest news about housing in Fayetteville, NC collected exclusively by city-data.com from local newspapers, TV, and radio stations
Median year house/condo built: 1981Median year apartment built: 1986Household type by relationship:
Households: 208,888
Male householders: 40,899 (13,242 living alone ), Female householders: 43,856 (14,853 living alone )33,708 spouses (33,337 opposite-sex spouses ), 5,734 unmarried partners , (5,231 opposite-sex unmarried partners ), 52,028 children (48,781 natural , 243 adopted , 3,004 stepchildren ), 6,952 grandchildren , 1,885 brothers or sisters , 1,727 parents , 86 foster children , 1,938 other relatives , 4,600 non-relatives In group quarters: 15,475
Size of family households: 23,477 2-persons , 13,101 3-persons , 7,585 4-persons , 3,921 5-persons , 1,367 6-persons , 929 7-or-more-persons .
Size of nonfamily households: 28,095 1-person , 5,725 2-persons , 428 3-persons , 127 4-persons .
24,543 married couples with children. single-parent households (2,858 men , 13,047 women ).
85.3% of residents of Fayetteville speak English at home. of residents speak Spanish at home (75% speak English very well , 15% speak English well , 9% speak English not well , 1% don't speak English at all ).of residents speak other Indo-European language at home (79% speak English very well , 17% speak English well , 2% speak English not well , 2% don't speak English at all ).of residents speak Asian or Pacific Island language at home (56% speak English very well , 29% speak English well , 13% speak English not well , 1% don't speak English at all ).of residents speak other language at home (76% speak English very well , 19% speak English well , 2% speak English not well , 3% don't speak English at all ).
Foreign born population: 16,421 (7.9%)of them are naturalized citizens )
Median number of rooms in houses and condos:
Median number of rooms in apartments
Owner-occupied Renter-occupied
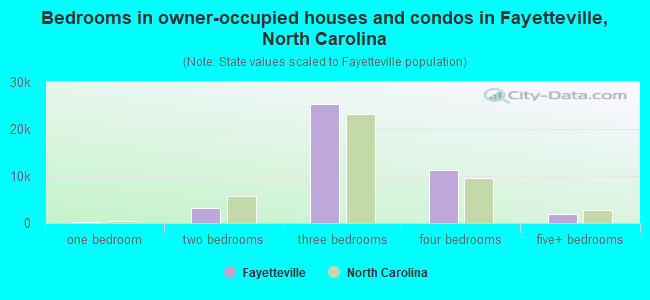
Bedrooms in owner-occupied houses and condos in Fayetteville, North Carolina
70 no bedroom 244 1 bedroom 3,195 2 bedrooms 25,220 3 bedrooms 11,272 4 bedrooms 1,954 5+ bedrooms
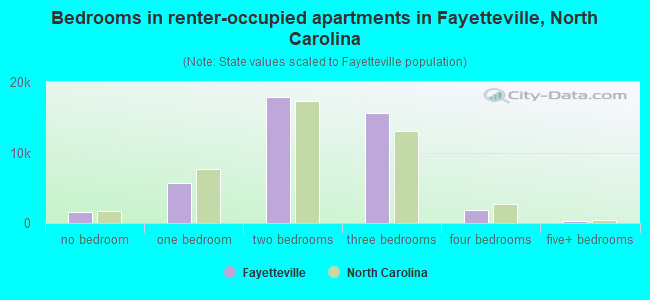
Bedrooms in renter-occupied apartments in Fayetteville, North Carolina
1,513 no bedroom 5,694 1 bedroom 17,866 2 bedrooms 15,596 3 bedrooms 1,781 4 bedrooms 350 5+ bedrooms
Owner-occupied Renter-occupied
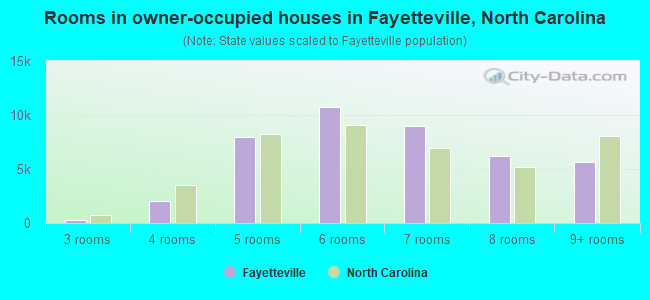
Rooms in owner-occupied houses in Fayetteville, North Carolina
70 1 room 52 2 rooms 298 3 rooms 1,992 4 rooms 7,925 5 rooms 10,710 6 rooms 9,010 7 rooms 6,226 8 rooms 5,672 9+ rooms
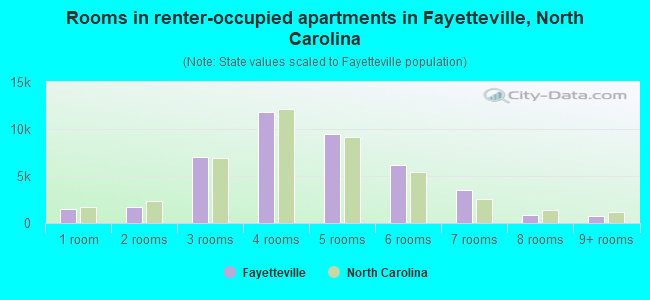
Rooms in renter-occupied apartments in Fayetteville, North Carolina
1,513 1 room 1,681 2 rooms 7,022 3 rooms 11,766 4 rooms 9,481 5 rooms 6,187 6 rooms 3,529 7 rooms 827 8 rooms 794 9+ rooms
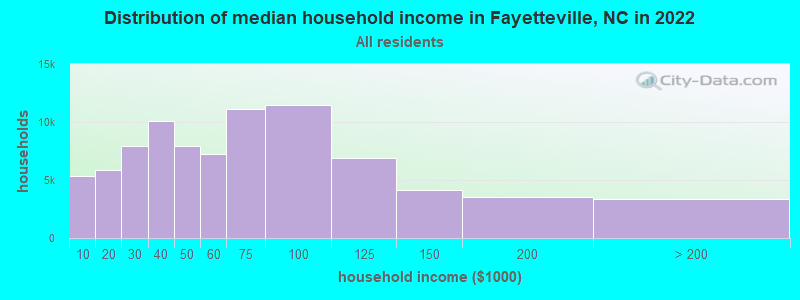
Fayetteville, NC household income distribution 5,319 Less than $10,0005,832 $10,000 to $19,9997,898 $20,000 to $29,99910,088 $30,000 to $39,9997,908 $40,000 to $49,9997,202 $50,000 to $59,99911,104 $60,000 to $74,99911,501 $75,000 to $99,9996,910 $100,000 to $124,9994,141 $125,000 to $149,9993,497 $150,000 to $199,9993,355 $200,000 or more
Home value of owner - occupied houses in 2022 in Fayetteville, NC 103 Less than $10,000250 $10,000 to $14,999431 $15,000 to $19,999187 $20,000 to $24,999205 $25,000 to $29,999232 $30,000 to $34,999121 $35,000 to $39,999371 $40,000 to $49,999524 $50,000 to $59,999474 $60,000 to $69,999927 $70,000 to $79,9991,078 $80,000 to $89,9991,672 $90,000 to $99,9994,360 $100,000 to $124,9994,231 $125,000 to $149,9995,113 $150,000 to $174,9993,877 $175,000 to $199,9996,305 $200,000 to $249,9994,419 $250,000 to $299,9994,399 $300,000 to $399,9991,543 $400,000 to $499,999711 $500,000 to $749,999227 $750,000 to $999,99969 $1,000,000 to $1,499,999126 $2,000,000 or moreRent paid by renters in 2022 in Fayetteville, NC 119 Less than $100207 $100 to $14928 $150 to $199210 $200 to $249233 $250 to $299341 $300 to $349506 $350 to $399739 $400 to $449621 $450 to $4991,091 $500 to $5491,330 $550 to $5992,059 $600 to $6491,334 $650 to $6991,477 $700 to $7492,626 $750 to $7995,762 $800 to $8994,062 $900 to $9998,477 $1,000 to $1,2497,109 $1,250 to $1,4991,830 $1,500 to $1,999539 $2,000 to $2,49940 $2,500 to $2,99918 $3,000 to $3,4992,042 No cash rent
Percentage of workers working in this county: 90.3%Number of people working at home: 7,420 (7.3% of all workers )
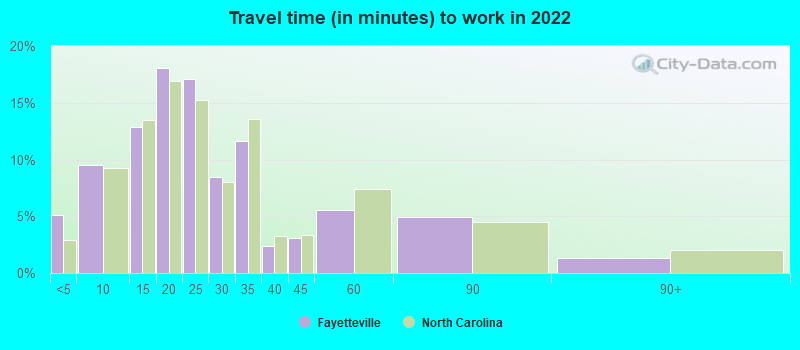
Travel time to work (commute)
Less than 5 minutes: 6,5825 to 9 minutes: 12,56310 to 14 minutes: 16,84015 to 19 minutes: 20,20220 to 24 minutes: 17,66325 to 29 minutes: 5,40230 to 34 minutes: 5,47235 to 39 minutes: 41940 to 44 minutes: 1,43745 to 59 minutes: 1,62560 to 89 minutes: 3,40490 or more minutes: 1,500
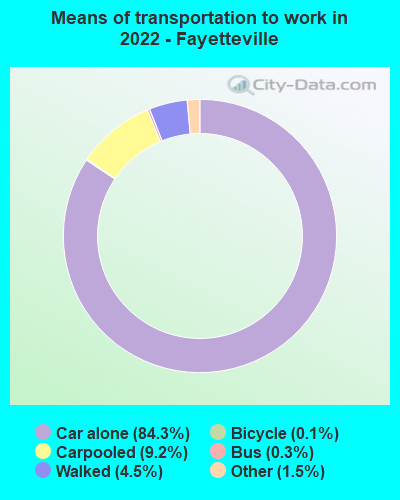
Means of transportation to work:
Drove a car alone: 119,753 (79.9%)Carpooled: 14,351 (9.6%)Bus : 224 (0.1%)Subway or elevated rail : 29 (0.0%)Ferryboat: 10 (0.0%)Taxi: 1,304 (0.9%)Bicycle: 220 (0.1%)Walked: 6,084 (4.1%)Worked at home: 7,420 (5.0%)
Unemployment by race in 2022
Unemployment rate for White non-Hispanic residents 6.8% Males5.2% FemalesUnemployment rate for Black residents 10.3% Males8.6% FemalesUnemployment rate for American Indian and Alaska Native residents 2.6% Males10.7% FemalesUnemployment rate for Asian residents 6.8% Males3.0% FemalesUnemployment rate for other race residents 9.7% Males9.9% FemalesUnemployment rate for two or more race residents 8.5% Males4.4% FemalesUnemployment rate for Hispanic or Latino residents 5.9% Males9.2% Females
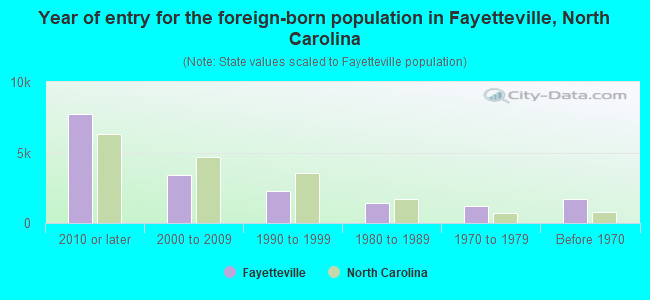
Year of entry for the foreign-born population in Fayetteville, North Carolina
7,720 2010 or later 3,424 2000 to 2009 2,254 1990 to 1999 1,422 1980 to 1989 1,187 1970 to 1979 1,732 Before 1970
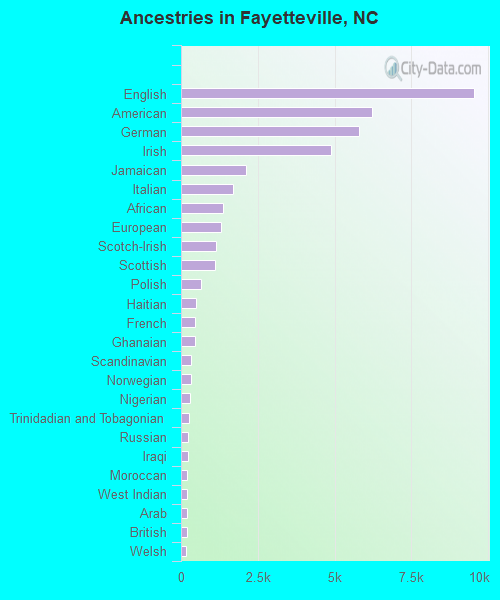
First ancestries reported:
English: 9,551 (7.0%)
American: 6,206 (4.6%)
German: 5,804 (4.3%)
Irish: 4,885 (3.6%)
Jamaican: 2,123 (1.6%)
Italian: 1,698 (1.2%)
African: 1,354 (1.0%)
European: 1,287 (0.9%)
Scotch-Irish: 1,148 (0.8%)
Scottish: 1,115 (0.8%)
Polish: 643 (0.5%)
Haitian: 497 (0.4%)
French: 469 (0.3%)
Ghanaian: 464 (0.3%)
Scandinavian: 318 (0.2%)
Norwegian: 316 (0.2%)
Nigerian: 279 (0.2%)
Trinidadian and Tobagonian: 269 (0.2%)
Russian: 241 (0.2%)
Iraqi: 213 (0.2%)
Moroccan: 205 (0.2%)
West Indian: 194 (0.1%)
Arab: 193 (0.1%)
British: 184 (0.1%)
Welsh: 155 (0.1%)
French Canadian: 145 (0.1%)
Barbadian: 138 (0.1%)
Dutch: 137 (0.1%)
Turkish: 132 (0.10%)
Eastern European: 128 (0.09%)
Greek: 126 (0.09%)
Swedish: 123 (0.09%)
Danish: 117 (0.09%)
Guyanese: 107 (0.08%)
Ethiopian: 90 (0.07%)
Swiss: 90 (0.07%)
Ukrainian: 81 (0.06%)
Lebanese: 80 (0.06%)
Northern European: 80 (0.06%)
Hungarian: 79 (0.06%)
Dutch West Indian: 75 (0.06%)
Portuguese: 69 (0.05%)
British West Indian: 69 (0.05%)
Slovak: 66 (0.05%)
Czech: 62 (0.05%)
Austrian: 61 (0.04%)
Czechoslovakian: 60 (0.04%)
Croatian: 59 (0.04%)
Canadian: 57 (0.04%)
Egyptian: 55 (0.04%)
Slavic: 53 (0.04%)
Albanian: 49 (0.04%)
Armenian: 44 (0.03%)
Kenyan: 44 (0.03%)
Romanian: 43 (0.03%)
Yugoslavian: 41 (0.03%)
New Zealander: 40 (0.03%)
Bulgarian: 37 (0.03%)
Belgian: 36 (0.03%)
Sierra Leonean: 35 (0.03%)
Pennsylvania German: 34 (0.03%)
Afghan: 33 (0.02%)
Celtic: 33 (0.02%)
Finnish: 31 (0.02%)
Brazilian: 25 (0.02%)
Latvian: 25 (0.02%)
Cajun: 25 (0.02%)
Israeli: 24 (0.02%)
Zimbabwean: 23 (0.02%)
German Russian: 22 (0.02%)
Liberian: 22 (0.02%)
Sudanese: 20 (0.01%)
Bahamian: 18 (0.01%)
Syrian: 16 (0.01%)
U.S. Virgin Islander: 13 (0.01%)
Iranian: 11 (0.01%)
Australian: 9 (0.01%)
Somali: 8 (0.01%)
Icelander: 7 (0.01%)
Serbian: 7 (0.01%)
Most common places of birth for foreign-born residents (%): Jamaica Fayetteville:
11.1% (1,918)North Carolina:
1.3% (11,419)
Korea Fayetteville:
8.4% (1,455)North Carolina:
1.8% (15,988)
Germany Fayetteville:
7.0% (1,213)North Carolina:
1.8% (15,534)
Mexico Fayetteville:
6.7% (1,169)North Carolina:
24.7% (214,776)
Philippines Fayetteville:
4.9% (848)North Carolina:
2.4% (20,695)
India Fayetteville:
4.0% (693)North Carolina:
9.3% (80,594)
Panama Fayetteville:
3.9% (668)North Carolina:
0.3% (3,031)
Ghana Fayetteville:
3.1% (530)North Carolina:
0.5% (4,233)
Colombia Fayetteville:
2.9% (504)North Carolina:
2.1% (18,275)
Vietnam Fayetteville:
2.5% (429)North Carolina:
2.9% (24,965)
Guatemala Fayetteville:
2.2% (388)North Carolina:
2.6% (22,964)
Honduras Fayetteville:
2.0% (355)North Carolina:
4.7% (40,707)
Dominican Republic Fayetteville:
1.9% (332)North Carolina:
1.7% (15,135)
El Salvador Fayetteville:
1.9% (328)North Carolina:
3.8% (33,379)
Thailand Fayetteville:
1.8% (314)North Carolina:
0.7% (6,161)
Nigeria Fayetteville:
1.8% (308)North Carolina:
1.1% (9,173)
Haiti Fayetteville:
1.5% (263)North Carolina:
0.6% (5,018)
Place of birth for U.S.-born residents:
This state: 84,915Other state: 97,936Northeast: 22,701Midwest: 16,099South: 43,263West: 15,873 78.3% of Fayetteville residents lived in the same house 1 years ago.
Out of people who lived in different houses, 34.6% lived in this county.
Out of people who lived in different counties, 24.4% lived in North Carolina.
Fayetteville:
78.3%State average:
87.3%
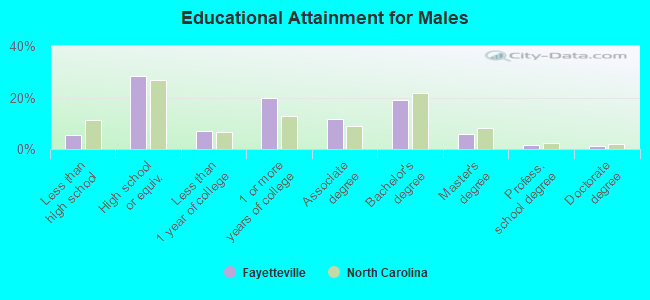
Education attainment for males 25 years and older:
No schooling: 736Nursery to 4th grade: 05th and 6th grade: 3597th and 8th grade: 2179th grade: 33410th grade: 49811th grade: 78512th grade, no diploma: 475High school graduate (or equivalency): 18,014Less than 1 year of college: 4,547Some college more than 1 year, no degree: 12,554Associate degree: 7,375Bachelor's degree: 12,049Master's degree: 3,773Professional school degree: 1,103Doctorate degree: 707
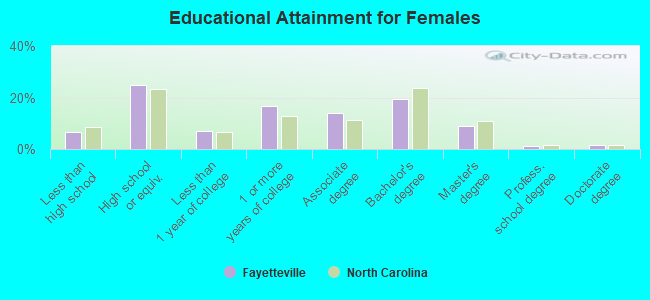
Education attainment for females 25 years and older:
No schooling: 782Nursery to 4th grade: 05th and 6th grade: 3387th and 8th grade: 2449th grade: 61410th grade: 74011th grade: 87712th grade, no diploma: 960High school graduate (or equivalency): 16,875Less than 1 year of college: 4,694Some college more than 1 year, no degree: 11,365Associate degree: 9,651Bachelor's degree: 13,125Master's degree: 6,211Professional school degree: 755Doctorate degree: 1,013
Housing units in structures:
One, detached: 57,855One, attached: 2,475Two: 2,9823 or 4: 4,5745 to 9: 7,84110 to 19: 7,63320 to 49: 4,72050 or more: 1,380Mobile homes: 2,580Boats, RVs, vans, etc.: 36Median worth of mobile homes: $41,349
Housing units lacking complete plumbing facilities in 2022: 1.1%Housing units lacking complete kitchen facilities in 2022: 1.1%House/condo owner moved in on average 11 years ago
Renter moved in on average 1 years ago
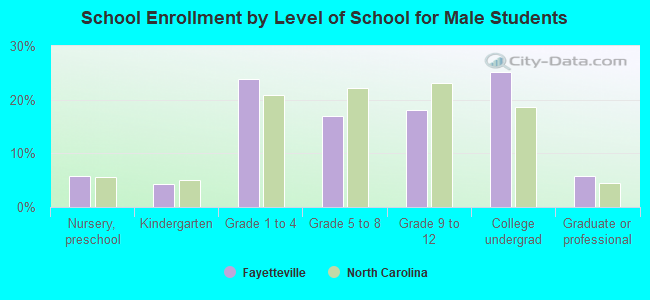
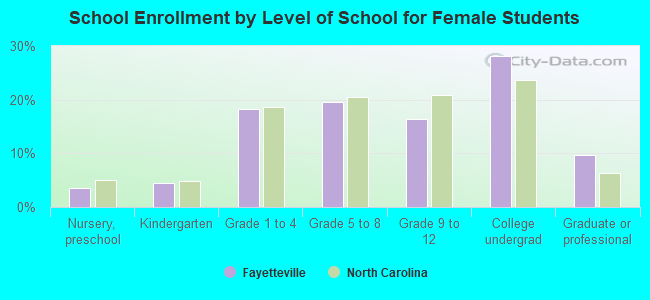
Private vs. public school enrollment:
Students in private schools in grades 1 to 8 (elementary and middle school): 2,017 Here:
10.2%North Carolina:
13.8%
Students in private schools in grades 9 to 12 (high school): 482 Here:
5.6%North Carolina:
11.9%
Students in private undergraduate colleges: 3,764 Here:
28.1%North Carolina:
19.3%