Falmouth, MA (Massachusetts) Houses and Residents
| Falmouth: | $825,126 |
| Massachusetts: | $534,700 |
Total population: 3,799 (All urban)
Houses: 3,223 (2,083 occupied: 1,224 owner occupied, 995 renter occupied)
| % of renters here: | 45% |
| State: | 38% |
Housing density: 1,561 houses/condos per square mile
Median price asked for vacant for-sale houses and condos in 2022: $2,831,478.
Median contract rent in 2022: $1,153 (lower quartile is $453, upper quartile is $1,442)
Median rent asked for vacant for-rent units in 2022: $1,763
Median gross rent in Falmouth, MA in 2022: $1,127
Housing units in Falmouth with a mortgage: 459 (96 second mortgage, 0 home equity loan, 95 both second mortgage and home equity loan)
Houses without a mortgage: 78
Median household income for houses/condos with a mortgage: $110,171
Median household income for apartments without a mortgage: $106,830
Median monthly housing costs: $1,071
Compare current foreclosures near Falmouth, MA:
| Photo | Address | Area | Beds / Baths | Price | Details |
|---|---|---|---|---|---|

|
#1
W Falmouth Hwy
Falmouth, MA 02540
|
1,224 sq. feet
|
2 baths 4 beds |
$615,000
|
show details |

|
#2
Braeside Rd
Falmouth, MA 02540
|
1,054 sq. feet
|
2 baths 3 beds |
show details | |

|
#3
Young Rd
Falmouth, MA 02540
|
1,395 sq. feet
|
2 baths 2 beds |
show details | |

|
#4
Locust St Apt 232
Falmouth, MA 02540
|
- sq. feet
|
- baths - beds |
show details | |

|
#5
Hunters Brook Rd
Sagamore Beach, MA 02562
|
1,714 sq. feet
|
2 baths 3 beds |
$710,000
|
show details |

|
#6
Willimantic Dr
Marstons Mills, MA 02648
|
1,267 sq. feet
|
2 baths 3 beds |
show details | |

|
#7
Circuit Ave
Pocasset, MA 02559
|
1,342 sq. feet
|
1 baths 3 beds |
show details | |

|
#8
Main St
West Barnstable, MA 02668
|
2,003 sq. feet
|
2 baths 4 beds |
show details | |

|
#9
Plum Hollow Rd
East Falmouth, MA 02536
|
1,531 sq. feet
|
2 baths 3 beds |
show details | |

|
#10
Harbor Hill Rd
Chilmark, MA 02535
|
561 sq. feet
|
1 baths 2 beds |
show details |
| Photo | Address | Area | Beds / Baths | Price | Details |
|---|---|---|---|---|---|

|
#11
Puritan Dr
Oak Bluffs, MA 02557
|
1,999 sq. feet
|
2 baths 3 beds |
show details | |

|
#12
Quaker Run Rd
Mashpee, MA 02649
|
3,010 sq. feet
|
3 baths 4 beds |
show details | |

|
#13
Avenue A St
Wareham, MA 02571
|
1,260 sq. feet
|
1 baths 3 beds |
show details | |

|
#14
Iron Hill Rd
Oak Bluffs, MA 02557
|
2,022 sq. feet
|
2 baths 4 beds |
show details | |

|
#15
Riverview Ave # D
Mashpee, MA 02649
|
1,507 sq. feet
|
2 baths 3 beds |
show details | |

|
#16
Kennebec Ave
Pocasset, MA 02559
|
3,029 sq. feet
|
3 baths 4 beds |
show details | |

|
#17
10th Ave
Wareham, MA 02571
|
1,216 sq. feet
|
1 baths 3 beds |
show details | |

|
#18
Monomoy Cir
Centerville, MA 02632
|
2,006 sq. feet
|
2 baths 3 beds |
show details | |

|
#19
Dodgers Hole Rd
Edgartown, MA 02539
|
1,392 sq. feet
|
2 baths 3 beds |
show details | |

|
#20
Samoset Rd
Mashpee, MA 02649
|
2,332 sq. feet
|
3 baths 4 beds |
show details |
| Photo | Address | Area | Beds / Baths | Price | Details |
|---|---|---|---|---|---|

|
#21
Manamok Cir
Sandwich, MA 02563
|
1,232 sq. feet
|
2 baths 3 beds |
show details | |

|
#22
Milford St
Plymouth, MA 02360
|
960 sq. feet
|
1 baths 3 beds |
show details | |

|
#23
Bay St
Osterville, MA 02655
|
3,128 sq. feet
|
3 baths 4 beds |
show details | |

|
#24
Fish House Rd
East Sandwich, MA 02537
|
2,900 sq. feet
|
3 baths 4 beds |
show details | |

|
#25
Day St
Fairhaven, MA 02719
|
936 sq. feet
|
1 baths 3 beds |
show details | |

|
#26
Quaker Meeting House Rd
East Sandwich, MA 02537
|
2,924 sq. feet
|
3 baths 4 beds |
show details | |

|
#27
Onset Ave # G
Buzzards Bay, MA 02532
|
1,654 sq. feet
|
2 baths 2 beds |
show details | |

|
#28
Scituate Rd
Mashpee, MA 02649
|
1,248 sq. feet
|
1 baths 2 beds |
show details | |

|
#29
Agawam Lake Shore Dr
Wareham, MA 02571
|
936 sq. feet
|
1 baths 3 beds |
show details | |

|
#30
Suncrest Dr
East Falmouth, MA 02536
|
1,344 sq. feet
|
2 baths 4 beds |
show details |
| Photo | Address | Area | Beds / Baths | Price | Details |
|---|---|---|---|---|---|

|
#31
Siasconset Dr
Sagamore Beach, MA 02562
|
1,428 sq. feet
|
2 baths 4 beds |
show details | |

|
#32
Iroquois St
East Falmouth, MA 02536
|
880 sq. feet
|
1 baths 2 beds |
show details | |

|
#33
Edgewater Dr E
East Falmouth, MA 02536
|
884 sq. feet
|
1 baths 3 beds |
show details | |

|
#34
Seatucket Rd
East Falmouth, MA 02536
|
1,280 sq. feet
|
2 baths 4 beds |
show details | |

|
#35
David St
New Bedford, MA 02744
|
3,360 sq. feet
|
3 baths 9 beds |
show details | |

|
#36
Sally Ln
East Falmouth, MA 02536
|
1,456 sq. feet
|
3 baths 3 beds |
show details | |

|
#37
Fern St
New Bedford, MA 02744
|
1,137 sq. feet
|
2 baths 3 beds |
show details | |

|
#38
Forest Way
Wareham, MA 02571
|
2,969 sq. feet
|
2 baths 4 beds |
show details | |

|
#39
Swifts Beach Rd
Wareham, MA 02571
|
1,180 sq. feet
|
1 baths 3 beds |
show details | |

|
#40
Sconticut Neck Rd
Fairhaven, MA 02719
|
571 sq. feet
|
1 baths 2 beds |
show details |
| Photo | Address | Area | Beds / Baths | Price | Details |
|---|---|---|---|---|---|

|
#41
Buzzards Bay Dr
Plymouth, MA 02360
|
1,283 sq. feet
|
1 baths 2 beds |
show details | |

|
#42
Village Dr
East Sandwich, MA 02537
|
2,352 sq. feet
|
2 baths 4 beds |
show details | |

|
#43
Minot Ave
Wareham, MA 02571
|
960 sq. feet
|
1 baths 3 beds |
show details | |

|
#44
Desires Ln
West Barnstable, MA 02668
|
2,622 sq. feet
|
2 baths 3 beds |
show details | |

|
#45
Walnut St
Plymouth, MA 02360
|
704 sq. feet
|
1 baths 2 beds |
show details | |

|
#46
Main St
Fairhaven, MA 02719
|
784 sq. feet
|
1 baths 3 beds |
show details | |

|
#47
Wellesley Cir
Hyannis, MA 02601
|
1,056 sq. feet
|
2 baths 3 beds |
show details | |

|
#48
Boysenberry Rd
East Wareham, MA 02538
|
872 sq. feet
|
1 baths 2 beds |
show details | |

|
#49
Old Stage Rd
Centerville, MA 02632
|
1,344 sq. feet
|
1 baths 3 beds |
show details | |

|
Check over 1 million property listings on Foreclosure.com!
|
browse all offers | |||

Latest news about housing in Falmouth, MA collected exclusively by city-data.com from local newspapers, TV, and radio stations

 | How Much Massachusetts Households Make Per Year: Census Data (37 replies) |
| 2022 Real Estate Observations (1122 replies) |
| Summer home in Cape Cod to rent out for eventual retirement (31 replies) |
| MA Real Estate is CRAZY (344 replies) |
| Buying house on Cape Cod for rental income? (11 replies) |
| Where to stay on cape cod (and is it worth going in April)? (71 replies) |

Median year apartment built: 1968
Household type by relationship:
Households: 3,934- Male householders: 994 (375 living alone), Female householders: 1,102 (660 living alone)
788 spouses (788 opposite-sex spouses), 35 unmarried partners, (35 opposite-sex unmarried partners), 653 children (590 natural, 50 adopted, 12 stepchildren), 39 grandchildren, 0 brothers or sisters, 14 parents, 0 foster children, 21 other relatives, 160 non-relatives
- In group quarters: 124
Size of family households: 772 2-persons, 136 3-persons, 60 4-persons, 40 5-persons, 8 6-persons.
Size of nonfamily households: 1,109 1-person, 43 2-persons, 24 4-persons, 19 5-persons.
228 married couples with children.
127 single-parent households (11 men, 116 women).
90.1% of residents of Falmouth speak English at home.
0.4% of residents speak Spanish at home (100% speak English very well).
6.6% of residents speak other Indo-European language at home (33% speak English very well, 15% speak English well, 52% speak English not well).
3.0% of residents speak Asian or Pacific Island language at home (100% speak English very well).
2.0% of residents speak other language at home (70% speak English very well, 30% speak English well).
Foreign born population: 511 (13.0%)
(25.6% of them are naturalized citizens)
| Here: | 6.1 |
| State: | 6.5 |
| Here: | 3.4 |
| State: | 4.0 |

- Bedrooms in owner-occupied houses and condos in Falmouth, Massachusetts
- 9no bedroom
- 291 bedroom
- 2922 bedrooms
- 5193 bedrooms
- 2974 bedrooms
- 795+ bedrooms

- Bedrooms in renter-occupied apartments in Falmouth, Massachusetts
- 95no bedroom
- 4631 bedroom
- 2712 bedrooms
- 1073 bedrooms
- 344 bedrooms
- 245+ bedrooms

- Cars and other vehicles available in Falmouth in owner-occupied houses/condos
- 71no vehicle
- 5091 vehicle
- 5502 vehicles
- 783 vehicles
- 94 vehicles
- 85+ vehicles

- Cars and other vehicles available in Falmouth in renter-occupied apartments
- 378no vehicle
- 3981 vehicle
- 1742 vehicles
- 453 vehicles
- 04 vehicles
- 05+ vehicles

- Rooms in owner-occupied houses in Falmouth, Massachusetts
- 91 room
- 02 rooms
- 473 rooms
- 1104 rooms
- 2545 rooms
- 3036 rooms
- 3337 rooms
- 508 rooms
- 1179+ rooms

- Rooms in renter-occupied apartments in Falmouth, Massachusetts
- 471 room
- 1482 rooms
- 3183 rooms
- 2614 rooms
- 585 rooms
- 796 rooms
- 07 rooms
- 458 rooms
- 399+ rooms


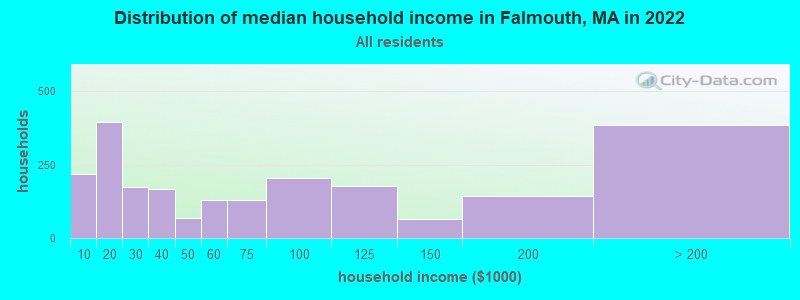
Falmouth, MA household income distribution

- 217Less than $10,000
- 395$10,000 to $19,999
- 174$20,000 to $29,999
- 167$30,000 to $39,999
- 69$40,000 to $49,999
- 130$50,000 to $59,999
- 128$60,000 to $74,999
- 204$75,000 to $99,999
- 176$100,000 to $124,999
- 63$125,000 to $149,999
- 143$150,000 to $199,999
- 386$200,000 or more
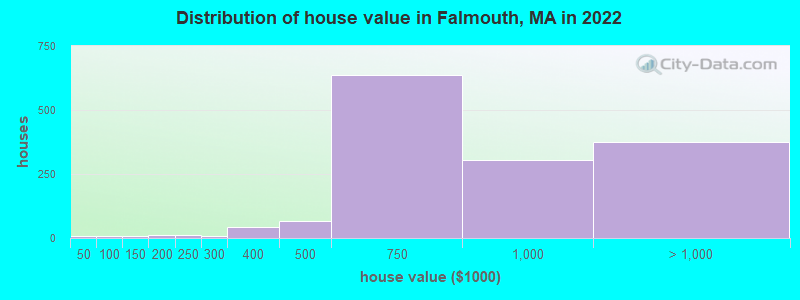
Home value of owner - occupied houses in 2022 in Falmouth, MA
-
- 6$40,000 to $49,999
- 5$100,000 to $124,999
- 10$175,000 to $199,999
- 13$200,000 to $249,999
- 8$250,000 to $299,999
- 41$300,000 to $399,999
- 66$400,000 to $499,999
- 635$500,000 to $749,999
- 302$750,000 to $999,999
- 272$1,000,000 to $1,499,999
- 90$1,500,000 to $1,999,999
- 12$2,000,000 or more
Rent paid by renters in 2022 in Falmouth, MA
-
- 16$200 to $249
- 57$250 to $299
- 89$300 to $349
- 66$350 to $399
- 6$400 to $449
- 4$450 to $499
- 53$500 to $549
- 8$550 to $599
- 55$600 to $649
- 22$650 to $699
- 32$700 to $749
- 62$800 to $899
- 7$900 to $999
- 156$1,000 to $1,249
- 65$1,250 to $1,499
- 113$1,500 to $1,999
- 62$2,000 to $2,499
- 41$2,500 to $2,999
- 27No cash rent


Percentage of workers working in this county: 85.3%
Number of people working at home: 303 (19.8% of all workers)
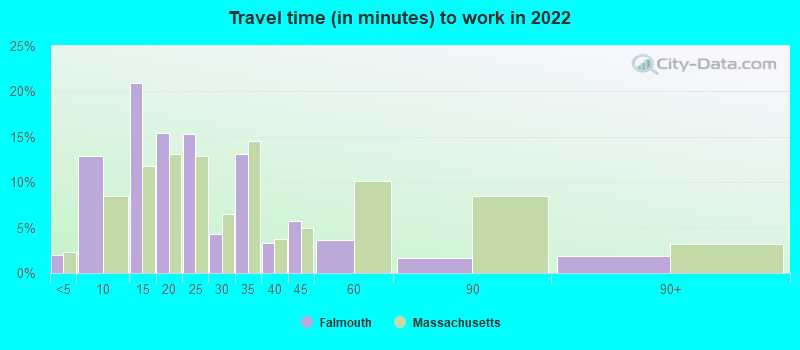
Travel time to work (commute)
- Less than 5 minutes: 62
- 5 to 9 minutes: 416
- 10 to 14 minutes: 209
- 15 to 19 minutes: 117
- 20 to 24 minutes: 91
- 25 to 29 minutes: 27
- 30 to 34 minutes: 100
- 35 to 39 minutes: 29
- 40 to 44 minutes: 25
- 45 to 59 minutes: 68
- 60 to 89 minutes: 28
- 90 or more minutes: 44
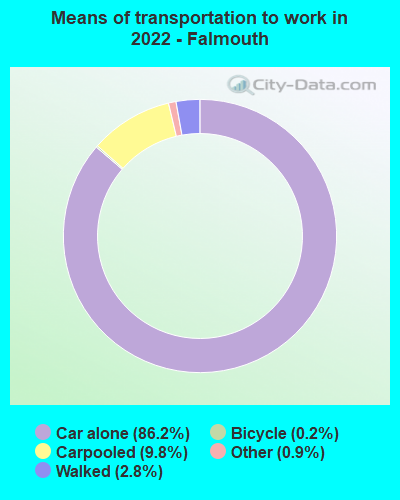
Means of transportation to work:
- Drove a car alone: 3,200 (78.3%)
- Carpooled: 360 (8.8%)
- Subway or elevated rail: 3 (0.1%)
- Taxi: 41 (1.0%)
- Bicycle: 8 (0.2%)
- Walked: 74 (1.8%)
- Worked at home: 303 (7.4%)

- Unemployment by race in 2022
- Unemployment rate for White non-Hispanic residents
- 4.8%Males
- 3.1%Females

- Year of entry for the foreign-born population in Falmouth, Massachusetts
- 3042010 or later
- 262000 to 2009
- 01990 to 1999
- 591980 to 1989
- 201970 to 1979
- 116Before 1970

First ancestries reported:
- Irish: 294 (16.2%)
- Brazilian: 179 (9.9%)
- English: 135 (7.4%)
- Italian: 122 (6.7%)
- Portuguese: 110 (6.1%)
- French Canadian: 100 (5.5%)
- Northern European: 78 (4.3%)
- Moroccan: 74 (4.1%)
- German: 56 (3.1%)
- American: 53 (2.9%)
- Greek: 47 (2.6%)
- French: 42 (2.3%)
- Polish: 34 (1.9%)
- Scottish: 28 (1.5%)
- European: 15 (0.8%)
- Armenian: 14 (0.8%)
- Eastern European: 14 (0.8%)
- Swedish: 13 (0.7%)
- Finnish: 10 (0.6%)
- British: 9 (0.5%)
- Canadian: 9 (0.5%)
- Cape Verdean: 9 (0.5%)
- Norwegian: 6 (0.3%)
Most common places of birth for foreign-born residents (%):
| Falmouth: | 31.9% (172) |
| Massachusetts: | 7.6% (92,959) |
| Falmouth: | 21.5% (116) |
| Massachusetts: | 0.9% (10,698) |
| Falmouth: | 18.7% (101) |
| Massachusetts: | 8.4% (103,233) |
| Falmouth: | 8.7% (47) |
| Massachusetts: | 0.7% (8,562) |
| Falmouth: | 3.1% (17) |
| Massachusetts: | 1.0% (12,709) |
| Falmouth: | 3.1% (17) |
| Massachusetts: | 2.3% (28,158) |
| Falmouth: | 2.2% (12) |
| Massachusetts: | 4.1% (50,360) |
| Falmouth: | 1.7% (9) |
| Massachusetts: | 1.0% (12,529) |
Place of birth for U.S.-born residents:
- This state: 2,299
- Other state: 1,076
- Northeast: 664
- Midwest: 140
- South: 99
- West: 154
87.8% of Falmouth residents lived in the same house 1 years ago.
Out of people who lived in different houses, 27.7% lived in this county.
Out of people who lived in different counties, 83.5% lived in Massachusetts.
| Falmouth: | 87.8% |
| State average: | 87.7% |
Education attainment for males 25 years and older:
- No schooling: 32
- Nursery to 4th grade: 0
- 5th and 6th grade: 75
- 7th and 8th grade: 0
- 9th grade: 8
- 10th grade: 0
- 11th grade: 0
- 12th grade, no diploma: 43
- High school graduate (or equivalency): 177
- Less than 1 year of college: 69
- Some college more than 1 year, no degree: 136
- Associate degree: 86
- Bachelor's degree: 394
- Master's degree: 349
- Professional school degree: 41
- Doctorate degree: 94

Education attainment for females 25 years and older:
- No schooling: 19
- Nursery to 4th grade: 14
- 5th and 6th grade: 0
- 7th and 8th grade: 26
- 9th grade: 0
- 10th grade: 0
- 11th grade: 71
- 12th grade, no diploma: 6
- High school graduate (or equivalency): 270
- Less than 1 year of college: 124
- Some college more than 1 year, no degree: 152
- Associate degree: 281
- Bachelor's degree: 633
- Master's degree: 263
- Professional school degree: 26
- Doctorate degree: 52


Housing units in structures:
- One, detached: 1,906
- One, attached: 394
- Two: 45
- 3 or 4: 316
- 5 to 9: 90
- 10 to 19: 33
- 20 to 49: 221
- 50 or more: 216
Housing units lacking complete kitchen facilities in 2022: 0.5%
House/condo owner moved in on average 10 years ago
Renter moved in on average 3 years ago

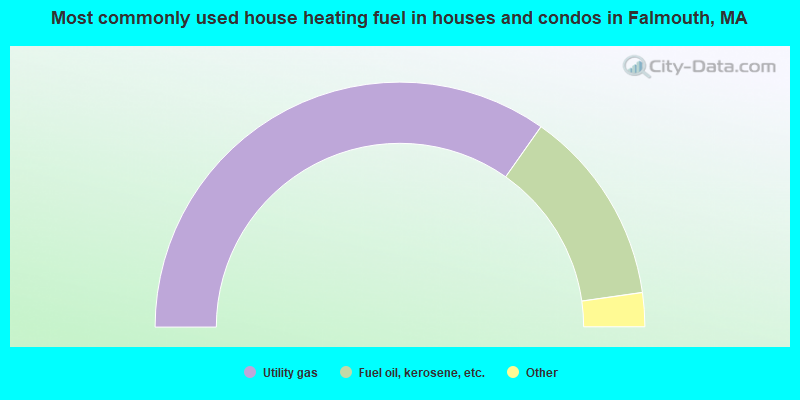
- 69.6%Utility gas
- 26.0%Fuel oil, kerosene, etc.
- 1.8%Electricity
- 1.4%Solar energy
- 1.1%Bottled, tank, or LP gas
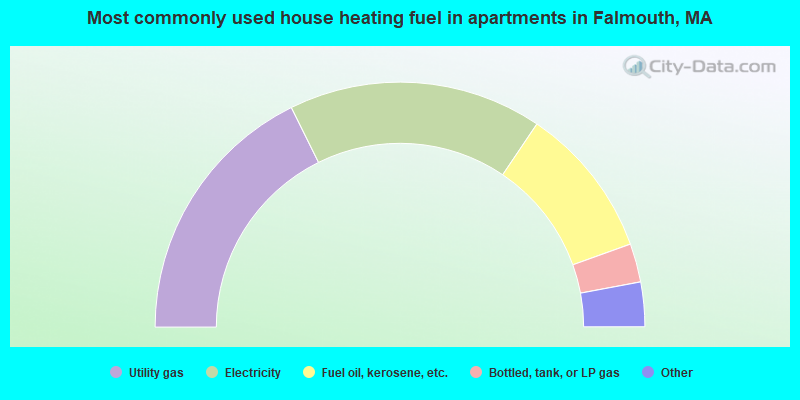
- 35.5%Utility gas
- 33.6%Electricity
- 20.2%Fuel oil, kerosene, etc.
- 5.1%Bottled, tank, or LP gas
- 3.1%No fuel used
- 2.6%Other fuel
Private vs. public school enrollment:
| Here: | 0.0% |
| Massachusetts: | 10.3% |
| Here: | 8.8% |
| Massachusetts: | 12.3% |
| Here: | 49.2% |
| Massachusetts: | 51.2% |


