Jump to a detailed profile or search site with Google Custom Search

Elk Grove, CA (California) Houses and Residents

Estimated median house or condo value in 2022: $627,100 (it was $150,900 in 2000)
Elk Grove:

$627,100
California:

$715,900
Lower value quartile - upper value quartile: $502,100 - $755,300

Mean price in 2022:

Detached houses: $466,810
Here:

$466,810
State:

$988,808

Townhouses or other attached units: $343,159
Here:

$343,159
State:

$838,546

In 3-to-4-unit structures: $374,063
Here:

$374,063
State:

$824,253

In 5-or-more-unit structures: $238,400
Here:

$238,400
State:

$730,996

Mobile homes: $99,017
Here:

$99,017
State:

$184,506

Total population: 163,553 (Urban population: 60,020, Rural population: 235 (all nonfarm))

Houses: 56,571 (54,931 occupied: 39,827 owner occupied, 15,104 renter occupied)

% of renters here:

27%
State:

44%

Housing density: 3,722 houses/condos per square mile

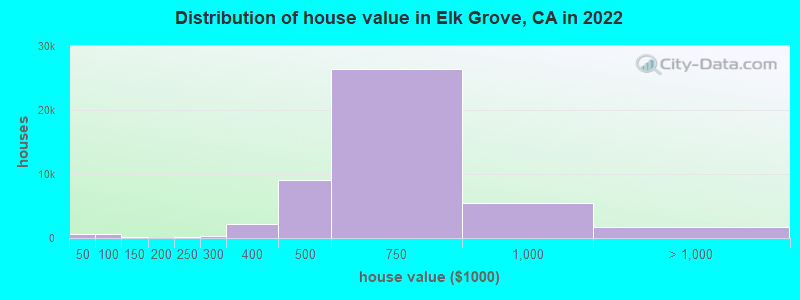
Median price asked for vacant for-sale houses and condos in 2022: $270,615.

Median contract rent in 2022: $1,843 (lower quartile is $1,342, upper quartile is over $2,000)


Median rent asked for vacant for-rent units in 2022: $2,532


Median gross rent in Elk Grove, CA in 2022: over $2,000

Housing units in Elk Grove with a mortgage: 26,750 (2,104 second mortgage, 199 home equity loan, 1,513 both second mortgage and home equity loan)
Houses without a mortgage: 284

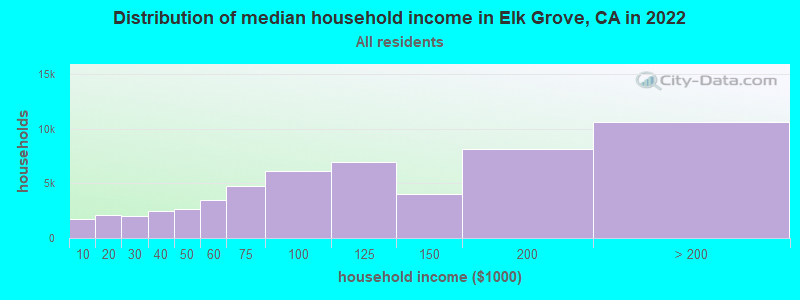
Median household income for houses/condos with a mortgage: $142,588

Median household income for apartments without a mortgage: $104,685

Median monthly housing costs: $2,013

Compare current foreclosures in Elk Grove, CA:

Check out more offers in Elk Grove, CA.
Powered by Foreclosure.com

Settings
X
Data:
Loading data...
Based on 2000-2022 data
Loading data...

123
Hide US histogram

Elk Grove, California Age and Sex of Residents
Median year house/condo built: 2001

Median year apartment built: 2000

Household type by relationship:

Households: 177,558
  • Male householders: 25,011 (3,003 living alone), Female householders: 29,920 (5,762 living alone)
  • 32,170 spouses (31,888 opposite-sex spouses), 2,842 unmarried partners, (2,633 opposite-sex unmarried partners), 62,663 children (60,640 natural, 563 adopted, 1,460 stepchildren), 3,120 grandchildren, 3,232 brothers or sisters, 8,385 parents, 0 foster children, 4,428 other relatives, 4,061 non-relatives
  • In group quarters: 1,726

Size of family households: 14,128 2-persons, 9,955 3-persons, 11,012 4-persons, 4,135 5-persons, 3,432 6-persons, 1,630 7-or-more-persons.

Size of nonfamily households: 8,765 1-person, 1,349 2-persons, 140 3-persons, 319 4-persons, 66 5-persons.

27,985 married couples with children.
9,904 single-parent households (2,437 men, 7,467 women).

61.0% of residents of Elk Grove speak English at home.
9.0% of residents speak Spanish at home (68% speak English very well, 18% speak English well, 10% speak English not well, 4% don't speak English at all).
7.6% of residents speak other Indo-European language at home (57% speak English very well, 29% speak English well, 9% speak English not well, 5% don't speak English at all).
21.3% of residents speak Asian or Pacific Island language at home (57% speak English very well, 25% speak English well, 13% speak English not well, 5% don't speak English at all).
1.1% of residents speak other language at home (93% speak English very well, 4% speak English well, 3% speak English not well).

Foreign born population: 47,153 (26.6%)
(74.0% of them are naturalized citizens)

Median number of rooms in houses and condos:
Here:

6.7
State:

6.0

Median number of rooms in apartments
Here:

5.2
State:

3.9

Owner-occupied Renter-occupied
Bedrooms in owner-occupied houses and condos in Elk Grove, California
  • Bedrooms in owner-occupied houses and condos in Elk Grove, California
  • 0no bedroom
  • 4231 bedroom
  • 2,9102 bedrooms
  • 14,2033 bedrooms
  • 15,3524 bedrooms
  • 6,9395+ bedrooms
Bedrooms in renter-occupied apartments in Elk Grove, California
  • Bedrooms in renter-occupied apartments in Elk Grove, California
  • 448no bedroom
  • 9081 bedroom
  • 5,0292 bedrooms
  • 4,6093 bedrooms
  • 3,4804 bedrooms
  • 6305+ bedrooms
Owner-occupied Renter-occupied
Cars and other vehicles available in Elk Grove in owner-occupied houses/condos
  • Cars and other vehicles available in Elk Grove in owner-occupied houses/condos
  • 1,164no vehicle
  • 6,7921 vehicle
  • 14,6662 vehicles
  • 11,0543 vehicles
  • 4,8384 vehicles
  • 1,3135+ vehicles
Cars and other vehicles available in Elk Grove in renter-occupied apartments
  • Cars and other vehicles available in Elk Grove in renter-occupied apartments
  • 826no vehicle
  • 5,1321 vehicle
  • 5,6372 vehicles
  • 2,1333 vehicles
  • 1,3424 vehicles
  • 345+ vehicles
Owner-occupied Renter-occupied
Rooms in owner-occupied houses in Elk Grove, California
  • Rooms in owner-occupied houses in Elk Grove, California
  • 01 room
  • 3252 rooms
  • 7093 rooms
  • 2,4734 rooms
  • 5,7245 rooms
  • 8,8276 rooms
  • 7,8867 rooms
  • 6,6988 rooms
  • 7,1859+ rooms
Rooms in renter-occupied apartments in Elk Grove, California
  • Rooms in renter-occupied apartments in Elk Grove, California
  • 4261 room
  • 4082 rooms
  • 1,7293 rooms
  • 2,7354 rooms
  • 3,2125 rooms
  • 2,0966 rooms
  • 1,7387 rooms
  • 1,9768 rooms
  • 7849+ rooms
Year house built
Median 2022 house/condo value by year built
Median house/condo value by year householder moved into unit
Breakdown of mean house values by ages of householders
Owners and renters by unit type in Elk Grove, CA
  • Elk Grove, CA household income distribution

  • Distribution of median household income in Elk Grove, CA in 2022
  • 1,745Less than $10,000
  • 2,112$10,000 to $19,999
  • 1,988$20,000 to $29,999
  • 2,455$30,000 to $39,999
  • 2,610$40,000 to $49,999
  • 3,509$50,000 to $59,999
  • 4,737$60,000 to $74,999
  • 6,096$75,000 to $99,999
  • 6,926$100,000 to $124,999
  • 3,992$125,000 to $149,999
  • 8,154$150,000 to $199,999
  • 10,607$200,000 or more
  • Home value of owner - occupied houses in 2022 in Elk Grove, CA

  • Distribution of house value in Elk Grove, CA in 2022
  • 351Less than $10,000
  • 25$15,000 to $19,999
  • 57$25,000 to $29,999
  • 112$30,000 to $34,999
  • 22$35,000 to $39,999
  • 112$40,000 to $49,999
  • 100$50,000 to $59,999
  • 103$60,000 to $69,999
  • 134$70,000 to $79,999
  • 31$80,000 to $89,999
  • 89$90,000 to $99,999
  • 44$100,000 to $124,999
  • 117$125,000 to $149,999
  • 55$150,000 to $174,999
  • 8$175,000 to $199,999
  • 156$200,000 to $249,999
  • 309$250,000 to $299,999
  • 2,130$300,000 to $399,999
  • 9,101$400,000 to $499,999
  • 26,337$500,000 to $749,999
  • 5,474$750,000 to $999,999
  • 1,270$1,000,000 to $1,499,999
  • 218$1,500,000 to $1,999,999
  • 268$2,000,000 or more
  • Rent paid by renters in 2022 in Elk Grove, CA

  • Distribution of rent paid by renters in Elk Grove, CA in 2022
  • 10Less than $100
  • 2$100 to $149
  • 15$150 to $199
  • 4$200 to $249
  • 10$250 to $299
  • 44$300 to $349
  • 12$400 to $449
  • 141$450 to $499
  • 178$500 to $549
  • 30$550 to $599
  • 22$600 to $649
  • 68$650 to $699
  • 137$700 to $749
  • 42$750 to $799
  • 218$800 to $899
  • 545$900 to $999
  • 1,202$1,000 to $1,249
  • 951$1,250 to $1,499
  • 4,931$1,500 to $1,999
  • 4,265$2,000 to $2,499
  • 1,044$2,500 to $2,999
  • 296$3,000 to $3,499
  • 137$3,500 or more
  • 1,009No cash rent
Time Leaving Home To Go To Work in 2022

Percentage of workers working in this county: 86.7%
Number of people working at home: 17,980 (21.7% of all workers)

Travel time (in minutes) to work in 2022

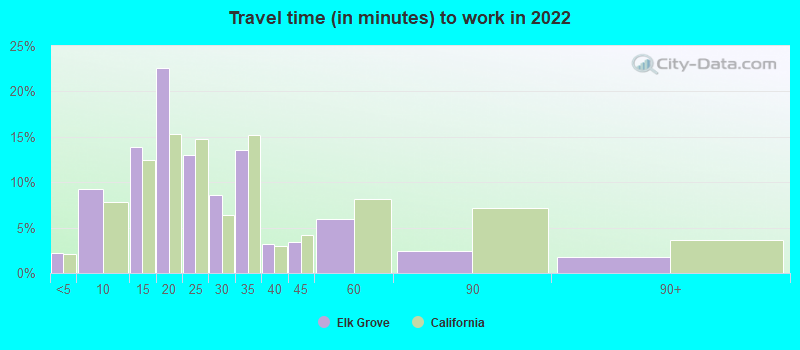
Travel time to work (commute)

  • Less than 5 minutes: 303
  • 5 to 9 minutes: 3,696
  • 10 to 14 minutes: 5,785
  • 15 to 19 minutes: 10,934
  • 20 to 24 minutes: 7,428
  • 25 to 29 minutes: 4,924
  • 30 to 34 minutes: 10,849
  • 35 to 39 minutes: 1,786
  • 40 to 44 minutes: 3,633
  • 45 to 59 minutes: 6,488
  • 60 to 89 minutes: 1,945
  • 90 or more minutes: 3,430
Means of transportation to work in 2022 - Elk Grove

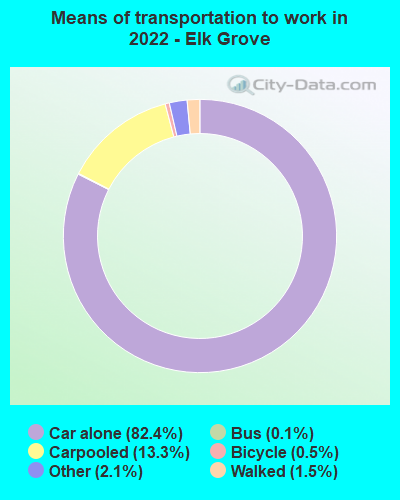
Means of transportation to work:

  • Drove a car alone: 32,151 (58.4%)
  • Carpooled: 5,354 (9.7%)
  • Bus: 29 (0.1%)
  • Light rail, streetcar or trolley: 4 (0.0%)
  • Taxi: 1,028 (1.9%)
  • Bicycle: 161 (0.3%)
  • Walked: 641 (1.2%)
  • Worked at home: 17,980 (32.7%)
Class of Workers in 2022
  • Unemployment by race in 2022
  • Unemployment rate for White non-Hispanic residents
  • 3.4%Males
  • 4.0%Females
  • Unemployment rate for Black residents
  • 9.4%Males
  • 6.4%Females
  • Unemployment rate for American Indian and Alaska Native residents
  • 5.4%Males
  • 4.8%Females
  • Unemployment rate for Asian residents
  • 7.8%Males
  • 3.2%Females
  • Unemployment rate for other race residents
  • 2.0%Males
  • 1.7%Females
  • Unemployment rate for two or more race residents
  • 10.7%Males
  • 4.2%Females
  • Unemployment rate for Hispanic or Latino residents
  • 0.8%Males
  • 0.9%Females
Year of entry for the foreign-born population in Elk Grove, California
  • Year of entry for the foreign-born population in Elk Grove, California
  • 10,6892010 or later
  • 9,1212000 to 2009
  • 9,7261990 to 1999
  • 3,7621980 to 1989
  • 1,9841970 to 1979
  • 1,108Before 1970
Ancestries in Elk Grove, CA

First ancestries reported:

  • American: 2,823 (2.9%)
  • English: 2,679 (2.8%)
  • German: 2,472 (2.6%)
  • Italian: 2,173 (2.2%)
  • Afghan: 1,536 (1.6%)
  • Irish: 1,536 (1.6%)
  • European: 1,469 (1.5%)
  • Portuguese: 1,013 (1.0%)
  • Russian: 829 (0.9%)
  • African: 683 (0.7%)
  • Nigerian: 681 (0.7%)
  • Ethiopian: 674 (0.7%)
  • Swiss: 597 (0.6%)
  • Norwegian: 499 (0.5%)
  • Scottish: 404 (0.4%)
  • Dutch: 298 (0.3%)
  • Polish: 278 (0.3%)
  • Arab: 264 (0.3%)
  • Ghanaian: 242 (0.2%)
  • Iranian: 222 (0.2%)
  • Ukrainian: 195 (0.2%)
  • Jordanian: 192 (0.2%)
  • British: 186 (0.2%)
  • Greek: 173 (0.2%)
  • French: 165 (0.2%)
  • Swedish: 164 (0.2%)
  • Northern European: 150 (0.2%)
  • Danish: 139 (0.1%)
  • Eastern European: 130 (0.1%)
  • Yugoslavian: 129 (0.1%)
  • Palestinian: 123 (0.1%)
  • Egyptian: 114 (0.1%)
  • Basque: 103 (0.1%)
  • Scotch-Irish: 97 (0.1%)
  • Lebanese: 84 (0.09%)
  • Kenyan: 73 (0.08%)
  • Belgian: 68 (0.07%)
  • Lithuanian: 66 (0.07%)
  • Czech: 64 (0.07%)
  • Guyanese: 62 (0.06%)
  • Cape Verdean: 56 (0.06%)
  • Hungarian: 56 (0.06%)
  • Albanian: 55 (0.06%)
  • Liberian: 54 (0.06%)
  • Turkish: 52 (0.05%)
  • Trinidadian and Tobagonian: 51 (0.05%)
  • Romanian: 49 (0.05%)
  • French Canadian: 46 (0.05%)
  • Bulgarian: 40 (0.04%)
  • Syrian: 39 (0.04%)
  • Welsh: 38 (0.04%)
  • Canadian: 36 (0.04%)
  • Scandinavian: 35 (0.04%)
  • Moroccan: 33 (0.03%)
  • Czechoslovakian: 32 (0.03%)
  • Brazilian: 32 (0.03%)
  • Estonian: 29 (0.03%)
  • Ugandan: 28 (0.03%)
  • Jamaican: 27 (0.03%)
  • Latvian: 24 (0.02%)
  • Finnish: 15 (0.02%)
  • Macedonian: 15 (0.02%)
  • Armenian: 15 (0.02%)
  • Croatian: 11 (0.01%)
  • Slovak: 10 (0.01%)
  • Austrian: 10 (0.01%)
  • British West Indian: 10 (0.01%)
  • Haitian: 10 (0.01%)
  • Slovene: 7 (0.01%)
  • Slavic: 6 (0.01%)
  • Iraqi: 6 (0.01%)
  • Assyrian: 5 (0.01%)

Most common places of birth for foreign-born residents (%):

Philippines
Elk Grove:

20.0% (8,889)
California:

7.8% (818,297)

Vietnam
Elk Grove:

14.4% (6,395)
California:

4.9% (512,335)

Mexico
Elk Grove:

11.4% (5,059)
California:

37.2% (3,881,193)

India
Elk Grove:

9.3% (4,141)
California:

5.2% (539,184)

China, excluding Hong Kong and Taiwan
Elk Grove:

8.8% (3,929)
California:

6.6% (684,672)

Afghanistan
Elk Grove:

5.3% (2,371)
California:

0.5% (53,260)

Fiji
Elk Grove:

3.7% (1,667)
California:

0.3% (33,937)

Laos
Elk Grove:

2.1% (954)
California:

0.5% (48,911)

Hong Kong
Elk Grove:

1.8% (783)
California:

1.0% (105,215)

Place of birth for U.S.-born residents:

  • This state: 104,833
  • Other state: 23,781
  • Northeast: 3,768
  • Midwest: 5,989
  • South: 8,621
  • West: 5,403

88.8% of Elk Grove residents lived in the same house 1 years ago.
   Out of people who lived in different houses, 32.3% lived in this county.
   Out of people who lived in different counties, 88.2% lived in California.


Elk Grove:

88.8%
State average:

88.9%

Education attainment for males 25 years and older:

  • No schooling: 2,300
  • Nursery to 4th grade: 0
  • 5th and 6th grade: 379
  • 7th and 8th grade: 73
  • 9th grade: 0
  • 10th grade: 86
  • 11th grade: 114
  • 12th grade, no diploma: 2,205
  • High school graduate (or equivalency): 11,933
  • Less than 1 year of college: 4,293
  • Some college more than 1 year, no degree: 8,435
  • Associate degree: 5,548
  • Bachelor's degree: 14,279
  • Master's degree: 4,789
  • Professional school degree: 864
  • Doctorate degree: 1,009
Educational Attainment for Males

Education attainment for females 25 years and older:

  • No schooling: 3,983
  • Nursery to 4th grade: 419
  • 5th and 6th grade: 404
  • 7th and 8th grade: 497
  • 9th grade: 112
  • 10th grade: 475
  • 11th grade: 548
  • 12th grade, no diploma: 1,170
  • High school graduate (or equivalency): 9,833
  • Less than 1 year of college: 5,531
  • Some college more than 1 year, no degree: 10,211
  • Associate degree: 6,601
  • Bachelor's degree: 17,400
  • Master's degree: 4,340
  • Professional school degree: 1,701
  • Doctorate degree: 1,357
Educational Attainment for Females
Elk Grove marital status for males
Elk Grove marital status for females

Housing units in structures:

  • One, detached: 48,168
  • One, attached: 1,632
  • Two: 232
  • 3 or 4: 1,036
  • 5 to 9: 889
  • 10 to 19: 752
  • 20 to 49: 643
  • 50 or more: 2,582
  • Mobile homes: 509
  • Boats, RVs, vans, etc.: 128

Median worth of mobile homes: $147,600

Housing units lacking complete plumbing facilities in 2022: 0.4%

Housing units lacking complete kitchen facilities in 2022: 0.8%

House/condo owner moved in on average 10 years ago

Renter moved in on average 3 years ago

Year householders moved into residence in Elk Grove
Houses and condos Apartments
Most commonly used house heating fuel in houses and condos in Elk Grove, CA
  • 71.3%Utility gas
  • 23.9%Electricity
  • 2.5%Bottled, tank, or LP gas
  • 1.2%Solar energy
  • 0.6%No fuel used
  • 0.3%Wood
Most commonly used house heating fuel in apartments in Elk Grove, CA
  • 49.2%Utility gas
  • 46.2%Electricity
  • 2.4%Bottled, tank, or LP gas
  • 1.8%No fuel used
  • 0.3%Fuel oil, kerosene, etc.
  • 0.1%Wood

Private vs. public school enrollment:

Students in private schools in grades 1 to 8 (elementary and middle school): 1,203
Here:

6.5%
California:

10.5%

Students in private schools in grades 9 to 12 (high school): 439
Here:

3.7%
California:

8.5%

Students in private undergraduate colleges: 1,327
Here:

12.4%
California:

15.9%
School Enrollment by Level of School for Male Students
School Enrollment by Level of School for Female Students
Age and Sex of Sensory-Disabled Noninstitutionalized Residents
Age and Sex of Physically-Disabled Noninstitutionalized Residents
Age and Sex of Mentally-Disabled Noninstitutionalized Residents
Age and Sex of Self-Care Disabled Noninstitutionalized Residents
Age and Sex of Go-Outside-Home Disabled Noninstitutionalized Residents
Age and Sex of Noninstitutionalized Residents with Employment Disability