East Sierra, CA (California) Houses and Residents
| East Sierra: | $263,505 |
| California: | $715,900 |
Total population: 2,320 (Urban population: 0, Rural population: 2,450 (85 farm, 2,365 nonfarm))
Houses: 1,282 (991 occupied: 680 owner occupied, 311 renter occupied)
| % of renters here: | 31% |
| State: | 44% |
Housing density: 3 houses/condos per square mile
Median price asked for vacant for-sale houses and condos in 2022 in this county: $364,127.
Median contract rent in 2022: $902 (lower quartile is $544, upper quartile is $1,447)
Median rent asked for vacant for-rent units in 2022: $573
Median gross rent in East Sierra, CA in 2022: $1,178
Housing units in East Sierra with a mortgage: 353 (58 second mortgage, 37 home equity loan, 0 both second mortgage and home equity loan)
Houses without a mortgage: 143
Compare current foreclosures near East Sierra, CA:
| Photo | Address | Area | Beds / Baths | Price | Details |
|---|---|---|---|---|---|

|
#1
6th Ave
Portola, CA 96122
|
1,560 sq. feet
|
3 baths 3 beds |
show details | |

|
#2
Rheinfelder St
Portola, CA 96122
|
2,394 sq. feet
|
3 baths 3 beds |
show details | |

|
#3
Ellen Ave
Portola, CA 96122
|
1,674 sq. feet
|
3 baths 3 beds |
show details | |

|
#4
Chaparral
Portola, CA 96122
|
1,560 sq. feet
|
2 baths 3 beds |
show details | |

|
#5
Colina Ct
Portola, CA 96122
|
1,872 sq. feet
|
2 baths 3 beds |
show details | |

|
#6
2nd Ave
Portola, CA 96122
|
1,001 sq. feet
|
1 baths 2 beds |
show details | |

|
#7
Taylor Ave
Portola, CA 96122
|
1 sq. feet
|
2 baths 3 beds |
show details | |

|
#8
Wolf Ave
Portola, CA 96122
|
1,156 sq. feet
|
1 baths 3 beds |
show details | |

|
#9
Oberwald Way
Truckee, CA 96161
|
- sq. feet
|
2 baths 3 beds |
show details | |

|
#10
Meadow Way # B
Portola, CA 96122
|
- sq. feet
|
- baths - beds |
show details |
| Photo | Address | Area | Beds / Baths | Price | Details |
|---|---|---|---|---|---|

|
#11
Arriba Ave
Portola, CA 96122
|
64 sq. feet
|
- baths - beds |
show details | |

|
#12
Taylor Ave
Portola, CA 96122
|
- sq. feet
|
- baths - beds |
show details | |

|
#13
Rocky Point Rd
Portola, CA 96122
|
- sq. feet
|
- baths - beds |
show details | |

|
Check over 1 million property listings on Foreclosure.com!
|
browse all offers | |||

Household type by relationship:
Households: 3,207- In family households: 2,548 (702 male householders, 224 female householders)
750 spouses, 688 children (619 natural, 15 adopted, 54 stepchildren), 35 grandchildren, 15 brothers or sisters, 22 parents, foster children, 21 other relatives, 77 non-relatives
- In nonfamily households: 659 (294 male householders (239 living alone)), 262 female householders (224 living alone)), 103 nonrelatives
- In group quarters: 33 (all institutionalized)
556 married couples with children.
207 single-parent households (59 men, 148 women).
92.9% of residents of East Sierra speak English at home.
4.5% of residents speak Spanish at home (50% speak English very well, 22% speak English well, 29% speak English not well).
2.2% of residents speak other Indo-European language at home (92% speak English very well, 4% speak English well, 4% speak English not well).
0.3% of residents speak Asian or Pacific Island language at home (100% speak English well).
Foreign born population: 106 (3.6%)
(69.8% of them are naturalized citizens)
| Here: | 6.0 |
| State: | 6.0 |
| Here: | 4.7 |
| State: | 3.9 |

- Bedrooms in owner-occupied houses and condos in East Sierra, California
- 0no bedroom
- 361 bedroom
- 2432 bedrooms
- 3253 bedrooms
- 554 bedrooms
- 215+ bedrooms

- Bedrooms in renter-occupied apartments in East Sierra, California
- 17no bedroom
- 971 bedroom
- 1012 bedrooms
- 833 bedrooms
- 104 bedrooms
- 35+ bedrooms

- Cars and other vehicles available in East Sierra in owner-occupied houses/condos
- 29no vehicle
- 1601 vehicle
- 2892 vehicles
- 1373 vehicles
- 544 vehicles
- 115+ vehicles

- Cars and other vehicles available in East Sierra in renter-occupied apartments
- 53no vehicle
- 911 vehicle
- 1142 vehicles
- 393 vehicles
- 34 vehicles
- 115+ vehicles

- Rooms in owner-occupied houses in East Sierra, California
- 01 room
- 62 rooms
- 483 rooms
- 944 rooms
- 2325 rooms
- 1656 rooms
- 667 rooms
- 318 rooms
- 389+ rooms

- Rooms in renter-occupied apartments in East Sierra, California
- 101 room
- 232 rooms
- 613 rooms
- 1014 rooms
- 485 rooms
- 216 rooms
- 387 rooms
- 58 rooms
- 49+ rooms


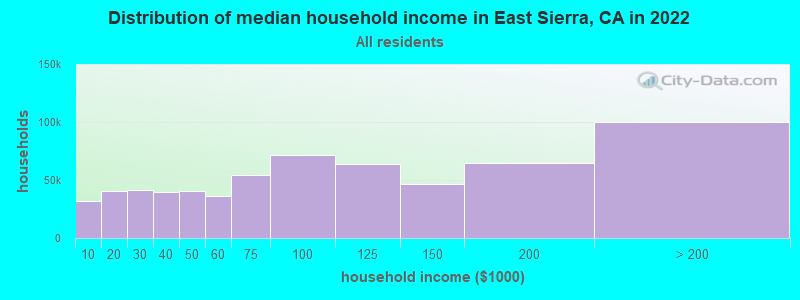
East Sierra, CA household income distribution

- 29,967Less than $10,000
- 37,727$10,000 to $19,999
- 38,922$20,000 to $29,999
- 37,578$30,000 to $39,999
- 38,223$40,000 to $49,999
- 33,732$50,000 to $59,999
- 50,678$60,000 to $74,999
- 66,774$75,000 to $99,999
- 59,242$100,000 to $124,999
- 43,766$125,000 to $149,999
- 60,534$150,000 to $199,999
- 92,264$200,000 or more
Percentage of workers working in this county: 57.5%
Number of people working at home: 197 (16.2% of all workers)
Travel time to work (commute)
- Less than 5 minutes: 90
- 5 to 9 minutes: 222
- 10 to 14 minutes: 80
- 15 to 19 minutes: 99
- 20 to 24 minutes: 43
- 25 to 29 minutes: 43
- 30 to 34 minutes: 91
- 35 to 39 minutes: 30
- 40 to 44 minutes: 19
- 45 to 59 minutes: 179
- 60 to 89 minutes: 48
- 90 or more minutes: 40
Means of transportation to work:
- Drove a car alone: 687 (67.5%)
- Carpooled: 204 (20.0%)
- Bicycle: 4 (0.4%)
- Walked: 89 (8.7%)
- Worked at home: 34 (3.3%)


- Year of entry for the foreign-born population in East Sierra, California
- 91995 to March 2000
- 91990 to 1994
- 151985 to 1989
- 31980 to 1984
- 41975 to 1979
- 81970 to 1974
- 21965 to 1969
- 27Before 1965
Most common places of birth for foreign-born residents (%):
| East Sierra: | 68.8% (53) |
| California: | 44.3% (3,928,701) |
| East Sierra: | 14.3% (11) |
| California: | 1.3% (112,212) |
| East Sierra: | 9.1% (7) |
| California: | 3.0% (268,452) |
| East Sierra: | 2.6% (2) |
| California: | 1.5% (133,090) |
| East Sierra: | 2.6% (2) |
| California: | 1.1% (98,160) |
| East Sierra: | 2.6% (2) |
| California: | 0.4% (38,450) |
Place of birth for U.S.-born residents:
- This state: 1,359
- Other state: 998
- Northeast: 114
- Midwest: 219
- South: 144
- West: 521
60% of East Sierra residents lived in the same house 5 years ago.
Out of people who lived in different houses, 34% lived in this county.
Out of people who lived in different counties, 68% lived in California.
Education attainment for males 25 years and older:
- No schooling: 5
- Nursery to 4th grade: 4
- 5th and 6th grade: 18
- 7th and 8th grade: 32
- 9th grade: 20
- 10th grade: 14
- 11th grade: 7
- 12th grade, no diploma: 51
- High school graduate (or equivalency): 260
- Less than 1 year of college: 29
- Some college more than 1 year, no degree: 148
- Associate degree: 63
- Bachelor's degree: 84
- Master's degree: 45
- Professional school degree: 5
- Doctorate degree: 6

Education attainment for females 25 years and older:
- No schooling: 7
- Nursery to 4th grade: 3
- 5th and 6th grade: 4
- 7th and 8th grade: 16
- 9th grade: 8
- 10th grade: 41
- 11th grade: 20
- 12th grade, no diploma: 40
- High school graduate (or equivalency): 284
- Less than 1 year of college: 75
- Some college more than 1 year, no degree: 192
- Associate degree: 87
- Bachelor's degree: 67
- Master's degree: 29
- Professional school degree: 8
- Doctorate degree: 6


Housing units in structures:
- One, detached: 1,061
- One, attached: 33
- Two: 3
- 5 to 9: 18
- 10 to 19: 5
- 50 or more: 33
- Mobile homes: 129
Median worth of mobile homes: $62,514
Housing units lacking complete kitchen facilities: 1.7%

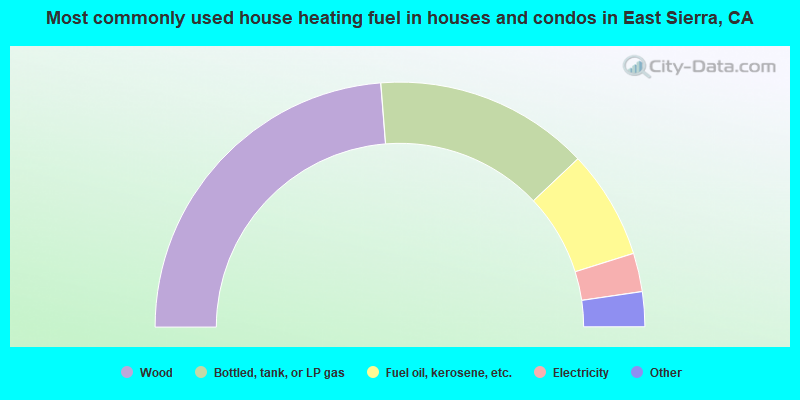
- 47.5%Wood
- 28.4%Bottled, tank, or LP gas
- 14.4%Fuel oil, kerosene, etc.
- 5.1%Electricity
- 3.1%Other fuel
- 1.5%Utility gas
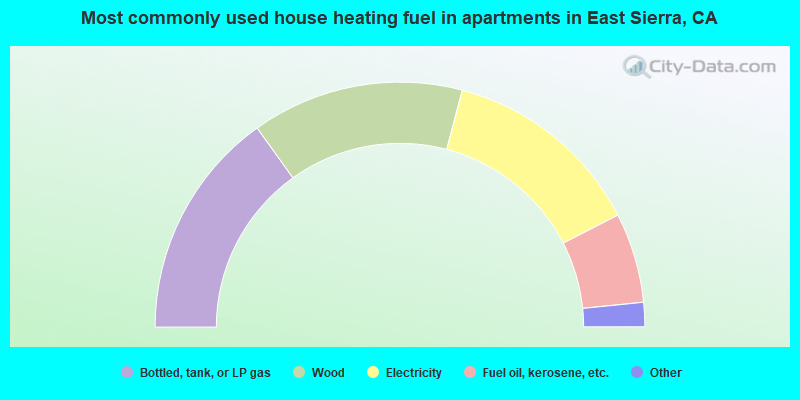
- 30.2%Bottled, tank, or LP gas
- 28.0%Wood
- 26.7%Electricity
- 11.9%Fuel oil, kerosene, etc.
- 1.9%Other fuel
- 1.3%Utility gas
Private vs. public school enrollment:
| Here: | 2.2% |
| California: | 9.9% |
| Here: | 1.7% |
| California: | 7.8% |
| Here: | 0.0% |
| California: | 15.4% |


