Decatur, TN (Tennessee) Houses and Residents
| Decatur: | $237,067 |
| Tennessee: | $284,800 |
Mean price in 2022:
Detached houses: $222,122
Here: $222,122 State: $374,382 Mobile homes: $158,089
Here: $158,089 State: $101,421
Total population: 1,570 (Urban population: 0, Rural population: 1,419 (9 farm, 1,410 nonfarm))
Houses: 839 (761 occupied: 436 owner occupied, 338 renter occupied)
| % of renters here: | 44% |
| State: | 33% |
Housing density: 328 houses/condos per square mile
Median price asked for vacant for-sale houses and condos in 2022 in this county: $344,279.
Median contract rent in 2022: $640 (lower quartile is $421, upper quartile is $687)
Median rent asked for vacant for-rent units in 2022: $979
Median gross rent in Decatur, TN in 2022: $847
Housing units in Decatur with a mortgage: 172 (14 second mortgage, 0 home equity loan, 9 both second mortgage and home equity loan)
Houses without a mortgage: 0
Median household income for houses/condos with a mortgage: $91,137
Median household income for apartments without a mortgage: $47,594
Median monthly housing costs: $668
Compare current foreclosures in Decatur, TN:
| Photo | Address | Area | Beds / Baths | Price | Details |
|---|---|---|---|---|---|

|
#1
Eaves Ferry Rd
Decatur, TN 37322
|
1,440 sq. feet
|
2 baths 3 beds |
show details | |

|
#2
Lamontville Rd
Decatur, TN 37322
|
1,500 sq. feet
|
2 baths - beds |
show details | |

|
#3
Dogwood Cir
Decatur, TN 37322
|
2,876 sq. feet
|
3 baths - beds |
show details | |

|
#4
Fezzell Rd
Decatur, TN 37322
|
1,596 sq. feet
|
2 baths - beds |
show details | |

|
#5
County Road 100
Decatur, TN 37322
|
1,430 sq. feet
|
2 baths - beds |
show details | |

|
#6
Shiloh Rd
Decatur, TN 37322
|
1,520 sq. feet
|
1 baths - beds |
show details | |

|
#7
N Main St
Decatur, TN 37322
|
1,207 sq. feet
|
1 baths - beds |
show details | |

|
#8
Hilltop Ln
Decatur, TN 37322
|
1,920 sq. feet
|
1 baths - beds |
show details | |

|
#9
Burketts Chapel Rd
Decatur, TN 37322
|
1,848 sq. feet
|
2 baths - beds |
show details | |

|
#10
Bowman Ln
Decatur, TN 37322
|
1,716 sq. feet
|
- baths - beds |
show details |
| Photo | Address | Area | Beds / Baths | Price | Details |
|---|---|---|---|---|---|

|
#11
Cunningham Dr
Decatur, TN 37322
|
- sq. feet
|
- baths - beds |
show details | |

|
#12
Howard Rd
Decatur, TN 37322
|
- sq. feet
|
- baths - beds |
show details | |

|
#13
Old State Hwy 30 West
Decatur, TN 37322
|
- sq. feet
|
- baths - beds |
show details | |

|
#14
Ford Rd
Decatur, TN 37322
|
460 sq. feet
|
- baths - beds |
show details | |

|
#15
Charles Rd
Decatur, TN 37322
|
- sq. feet
|
- baths - beds |
show details | |

|
#16
County Road 188
Decatur, TN 37322
|
- sq. feet
|
- baths - beds |
show details | |

|
#17
Hayes Hill Ln # 19
Decatur, TN 37322
|
- sq. feet
|
- baths - beds |
show details | |

|
#18
Queens Ln
Decatur, TN 37322
|
840 sq. feet
|
- baths - beds |
show details | |

|
#19
Fisher Ln
Decatur, TN 37322
|
924 sq. feet
|
- baths - beds |
show details | |

|
#20
Old Hickory Flat Rd
Decatur, TN 37322
|
840 sq. feet
|
- baths - beds |
show details |
| Photo | Address | Area | Beds / Baths | Price | Details |
|---|---|---|---|---|---|

|
#21
Lamontville Rd
Decatur, TN 37322
|
- sq. feet
|
- baths - beds |
show details | |

|
#22
Five Points Rd
Decatur, TN 37322
|
- sq. feet
|
- baths - beds |
show details | |

|
#23
Johns Rd
Decatur, TN 37322
|
- sq. feet
|
- baths - beds |
show details | |

|
#24
N Hunter Bend Rd
Decatur, TN 37322
|
- sq. feet
|
- baths - beds |
show details | |

|
#25
Redman Rd
Decatur, TN 37322
|
1,643 sq. feet
|
- baths - beds |
show details | |

|
#26
Goodfield Rd
Decatur, TN 37322
|
- sq. feet
|
- baths - beds |
show details | |

|
#27
County Road 188
Decatur, TN 37322
|
1,456 sq. feet
|
- baths - beds |
show details | |

|
#28
Armstrong Ferry Rd
Decatur, TN 37322
|
- sq. feet
|
- baths - beds |
show details | |

|
#29
Seals Ln
Decatur, TN 37322
|
- sq. feet
|
- baths - beds |
show details | |

|
#30
Gib Cooley Ln
Decatur, TN 37322
|
1,568 sq. feet
|
- baths - beds |
show details |
| Photo | Address | Area | Beds / Baths | Price | Details |
|---|---|---|---|---|---|

|
#31
State Highway 58 N
Decatur, TN 37322
|
- sq. feet
|
- baths - beds |
show details | |

|
#32
Rynes Rd
Decatur, TN 37322
|
- sq. feet
|
- baths - beds |
show details | |

|
#33
Cottonport Ridge Ln
Decatur, TN 37322
|
- sq. feet
|
- baths - beds |
show details | |

|
#34
State Highway 58 S
Decatur, TN 37322
|
- sq. feet
|
2 baths - beds |
show details | |

|
#35
Warren Ln
Decatur, TN 37322
|
1,056 sq. feet
|
- baths - beds |
show details | |

|
#36
Brady Ln
Decatur, TN 37322
|
1,248 sq. feet
|
- baths - beds |
show details | |

|
#37
Peakland Rd
Decatur, TN 37322
|
- sq. feet
|
- baths - beds |
show details | |

|
#38
Armstrong Ferry Rd
Decatur, TN 37322
|
- sq. feet
|
- baths - beds |
show details | |

|
#39
Ridge Rd
Decatur, TN 37322
|
- sq. feet
|
- baths - beds |
show details | |

|
#40
Legg Hollow Rd # A
Decatur, TN 37322
|
- sq. feet
|
- baths - beds |
show details |
| Photo | Address | Area | Beds / Baths | Price | Details |
|---|---|---|---|---|---|

|
#41
State Highway 58 S
Decatur, TN 37322
|
- sq. feet
|
- baths - beds |
show details | |

|
#42
Fezzell Rd
Decatur, TN 37322
|
1,216 sq. feet
|
- baths - beds |
show details | |

|
#43
Mt Carmel Rd
Decatur, TN 37322
|
- sq. feet
|
- baths - beds |
show details | |

|
#44
Cottonport Rd
Decatur, TN 37322
|
- sq. feet
|
- baths - beds |
show details | |

|
#45
County Road 179
Decatur, TN 37322
|
2,080 sq. feet
|
- baths - beds |
show details | |

|
Check over 1 million property listings on Foreclosure.com!
|
browse all offers | |||

Latest news about housing in Decatur, TN collected exclusively by city-data.com from local newspapers, TV, and radio stations

 | Non Electric Homestead McMinn County (480 replies) |
| Driving from Decatur, AL to Evansville, IN, best route through Nashville (11 replies) |
| Yet another "where should I live?" -- Older homes, larger lots, private schools (11 replies) |
| Cost of living - am I missing anything? (47 replies) |
| Fort Henry Mall under new management. (205 replies) |
| Airplane or Bus? (10 replies) |

Median year apartment built: 1986
Household type by relationship:
Households: 1,873- Male householders: 235 (119 living alone), Female householders: 517 (177 living alone)
256 spouses (253 opposite-sex spouses), 74 unmarried partners, (74 opposite-sex unmarried partners), 416 children (377 natural, 29 adopted, 9 stepchildren), 84 grandchildren, 8 brothers or sisters, 37 parents, 0 foster children, 97 other relatives, 30 non-relatives
- In group quarters: 115
Size of family households: 179 2-persons, 112 3-persons, 45 4-persons, 29 5-persons, 24 6-persons, 70 7-or-more-persons.
Size of nonfamily households: 301 1-person, 6 2-persons, 5 4-persons.
148 married couples with children.
161 single-parent households (7 men, 154 women).
98.4% of residents of Decatur speak English at home.
1.5% of residents speak Spanish at home (31% speak English very well, 69% speak English not well).
Foreign born population: 20 (1.1%)
(10.0% of them are naturalized citizens)
| Here: | 6.4 |
| State: | 6.5 |
| Here: | 5.3 |
| State: | 4.4 |

- Bedrooms in owner-occupied houses and condos in Decatur, Tennessee
- 0no bedroom
- 01 bedroom
- 812 bedrooms
- 2533 bedrooms
- 984 bedrooms
- 55+ bedrooms

- Bedrooms in renter-occupied apartments in Decatur, Tennessee
- 0no bedroom
- 521 bedroom
- 1152 bedrooms
- 1633 bedrooms
- 04 bedrooms
- 85+ bedrooms

- Cars and other vehicles available in Decatur in owner-occupied houses/condos
- 13no vehicle
- 1031 vehicle
- 2232 vehicles
- 673 vehicles
- 174 vehicles
- 145+ vehicles

- Cars and other vehicles available in Decatur in renter-occupied apartments
- 45no vehicle
- 1201 vehicle
- 1672 vehicles
- 73 vehicles
- 04 vehicles
- 05+ vehicles

- Rooms in owner-occupied houses in Decatur, Tennessee
- 01 room
- 02 rooms
- 03 rooms
- 334 rooms
- 855 rooms
- 1126 rooms
- 837 rooms
- 718 rooms
- 529+ rooms

- Rooms in renter-occupied apartments in Decatur, Tennessee
- 01 room
- 22 rooms
- 483 rooms
- 794 rooms
- 445 rooms
- 1266 rooms
- 307 rooms
- 58 rooms
- 49+ rooms


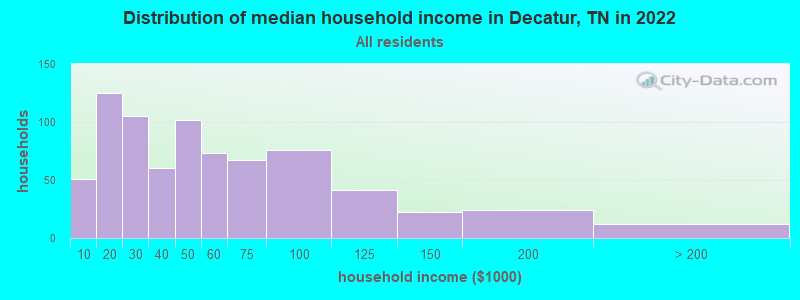
Decatur, TN household income distribution

- 51Less than $10,000
- 125$10,000 to $19,999
- 105$20,000 to $29,999
- 60$30,000 to $39,999
- 102$40,000 to $49,999
- 73$50,000 to $59,999
- 67$60,000 to $74,999
- 76$75,000 to $99,999
- 41$100,000 to $124,999
- 22$125,000 to $149,999
- 24$150,000 to $199,999
- 12$200,000 or more
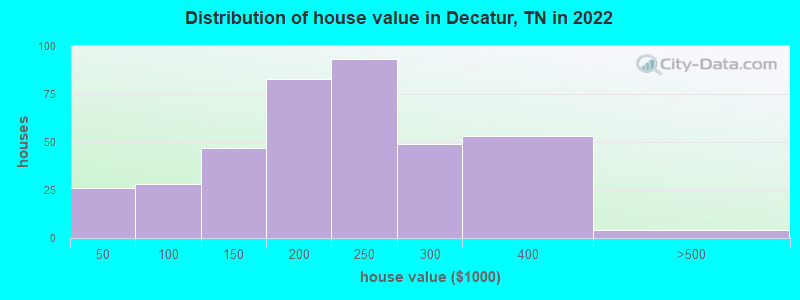
Home value of owner - occupied houses in 2022 in Decatur, TN
-
- 4$15,000 to $19,999
- 3$20,000 to $24,999
- 12$30,000 to $34,999
- 6$40,000 to $49,999
- 2$50,000 to $59,999
- 7$70,000 to $79,999
- 5$80,000 to $89,999
- 6$90,000 to $99,999
- 32$100,000 to $124,999
- 14$125,000 to $149,999
- 40$150,000 to $174,999
- 42$175,000 to $199,999
- 93$200,000 to $249,999
- 48$250,000 to $299,999
- 52$300,000 to $399,999
- 4$400,000 to $499,999
Rent paid by renters in 2022 in Decatur, TN
-
- 8Less than $100
- 12$100 to $149
- 3$150 to $199
- 10$200 to $249
- 19$250 to $299
- 10$300 to $349
- 3$350 to $399
- 17$400 to $449
- 17$450 to $499
- 28$500 to $549
- 2$550 to $599
- 93$600 to $649
- 27$650 to $699
- 5$700 to $749
- 18$900 to $999
- 5$1,000 to $1,249
- 34No cash rent


Percentage of workers working in this county: 46.7%
Number of people working at home: 23 (3.8% of all workers)
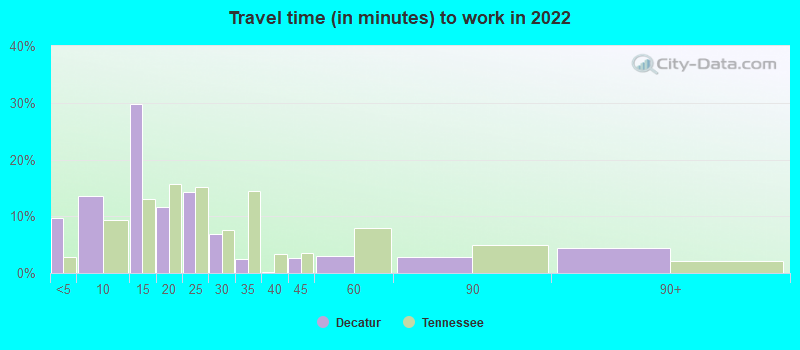
Travel time to work (commute)
- Less than 5 minutes: 80
- 5 to 9 minutes: 102
- 10 to 14 minutes: 30
- 15 to 19 minutes: 64
- 20 to 24 minutes: 136
- 25 to 29 minutes: 15
- 30 to 34 minutes: 59
- 35 to 39 minutes: 6
- 40 to 44 minutes: 0
- 45 to 59 minutes: 40
- 60 to 89 minutes: 15
- 90 or more minutes: 28
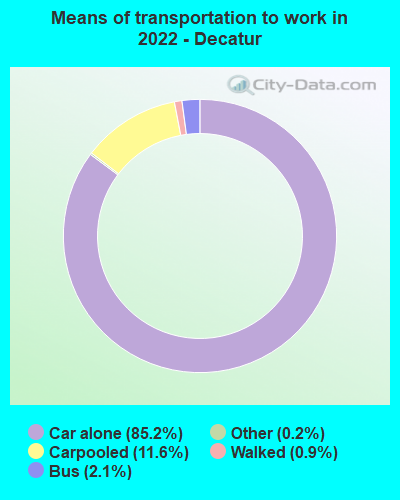
Means of transportation to work:
- Drove a car alone: 935 (80.0%)
- Carpooled: 135 (11.5%)
- Bus: 19 (1.6%)
- Taxi: 2 (0.2%)
- Walked: 10 (0.9%)
- Worked at home: 23 (2.0%)

- Unemployment by race in 2022
- Unemployment rate for White non-Hispanic residents
- 12.6%Males
- 21.3%Females

- Year of entry for the foreign-born population in Decatur, Tennessee
- 02010 or later
- 182000 to 2009
- 01990 to 1999
- 01980 to 1989
- 11970 to 1979
- 0Before 1970
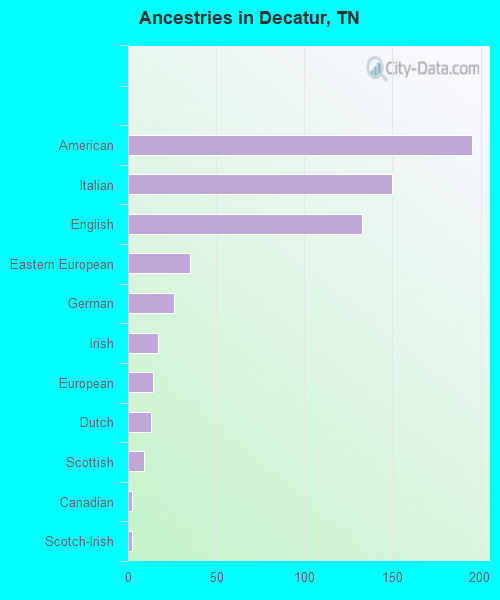
First ancestries reported:
- American: 195 (25.1%)
- Italian: 150 (19.3%)
- English: 133 (17.1%)
- Eastern European: 35 (4.5%)
- German: 26 (3.3%)
- Irish: 17 (2.2%)
- European: 14 (1.8%)
- Dutch: 13 (1.7%)
- Scottish: 9 (1.2%)
- Canadian: 2 (0.3%)
- Scotch-Irish: 2 (0.3%)
- Welsh: 1 (0.1%)
Most common places of birth for foreign-born residents (%):
| Decatur: | 100.0% (20) |
| Tennessee: | 5.7% (21,286) |
| Decatur: | 10.0% (2) |
| Tennessee: | 2.7% (10,295) |
Place of birth for U.S.-born residents:
- This state: 1,357
- Other state: 479
- Northeast: 89
- Midwest: 111
- South: 234
- West: 45
77.9% of Decatur residents lived in the same house 1 years ago.
Out of people who lived in different houses, 17.5% lived in this county.
Out of people who lived in different counties, 69.0% lived in Tennessee.
| Decatur: | 77.9% |
| State average: | 87.0% |
Education attainment for males 25 years and older:
- No schooling: 2
- Nursery to 4th grade: 2
- 5th and 6th grade: 30
- 7th and 8th grade: 19
- 9th grade: 27
- 10th grade: 24
- 11th grade: 15
- 12th grade, no diploma: 19
- High school graduate (or equivalency): 217
- Less than 1 year of college: 36
- Some college more than 1 year, no degree: 49
- Associate degree: 51
- Bachelor's degree: 40
- Master's degree: 6
- Professional school degree: 0
- Doctorate degree: 0

Education attainment for females 25 years and older:
- No schooling: 6
- Nursery to 4th grade: 3
- 5th and 6th grade: 2
- 7th and 8th grade: 16
- 9th grade: 5
- 10th grade: 10
- 11th grade: 18
- 12th grade, no diploma: 19
- High school graduate (or equivalency): 276
- Less than 1 year of college: 71
- Some college more than 1 year, no degree: 127
- Associate degree: 27
- Bachelor's degree: 19
- Master's degree: 34
- Professional school degree: 3
- Doctorate degree: 4


Housing units in structures:
- One, detached: 584
- Two: 43
- 3 or 4: 20
- 5 to 9: 15
- 20 to 49: 8
- Mobile homes: 166
Housing units lacking complete kitchen facilities in 2022: 2.2%
House/condo owner moved in on average 8 years ago
Renter moved in on average 5 years ago

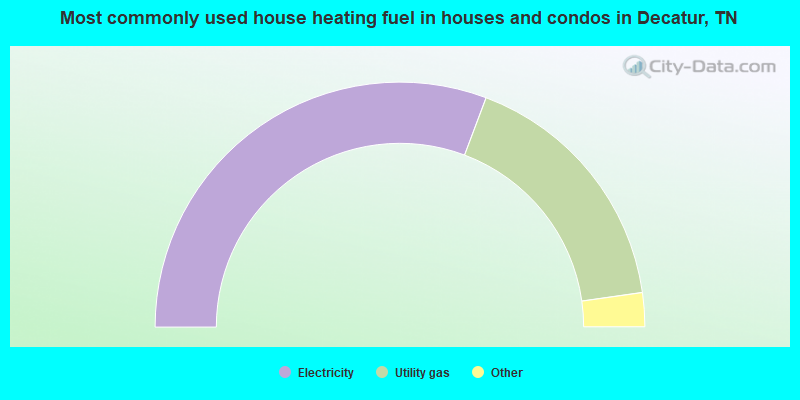
- 61.5%Electricity
- 34.1%Utility gas
- 2.6%Bottled, tank, or LP gas
- 1.7%Wood
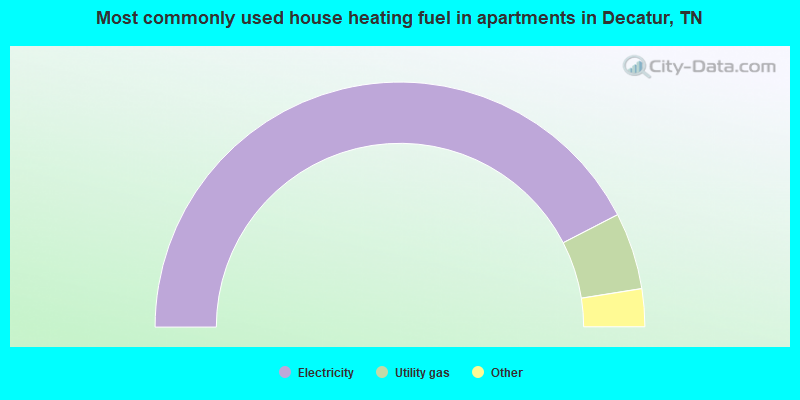
- 85.1%Electricity
- 10.2%Utility gas
- 3.1%Wood
- 1.5%Bottled, tank, or LP gas
Private vs. public school enrollment:
| Here: | 0.0% |
| Tennessee: | 15.0% |
| Here: | 13.5% |
| Tennessee: | 16.2% |
| Here: | 22.2% |
| Tennessee: | 23.5% |


