Daphne, AL (Alabama) Houses and Residents
| Daphne: | $316,395 |
| Alabama: | $200,900 |
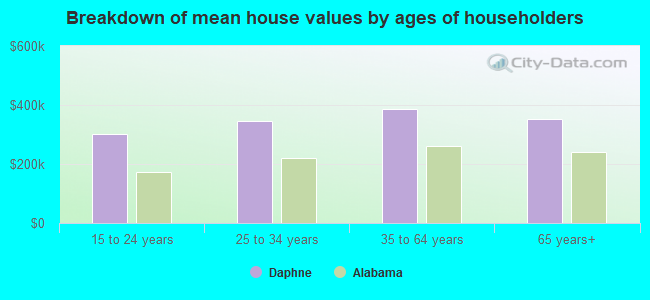
Mean price in 2022:
Detached houses: $341,860
Here: $341,860 State: $273,076 Townhouses or other attached units: $141,023
Here: $141,023 State: $222,857 In 3-to-4-unit structures: $108,323
Here: $108,323 State: $194,388 In 5-or-more-unit structures: $563,662
Here: $563,662 State: $307,073
Total population: 24,395 (Urban population: 16,761 (all inside urban clusters), Rural population: 82 (all nonfarm))
Houses: 11,979 (11,070 occupied: 8,148 owner occupied, 3,248 renter occupied)
| % of renters here: | 29% |
| State: | 30% |
Housing density: 889 houses/condos per square mile
Median price asked for vacant for-sale houses and condos in 2022: $292,710.
Median contract rent in 2022: $1,058 (lower quartile is $803, upper quartile is $1,501)
Median rent asked for vacant for-rent units in 2022: $998
Median gross rent in Daphne, AL in 2022: $1,248
Housing units in Daphne with a mortgage: 5,371 (463 second mortgage, 71 home equity loan, 269 both second mortgage and home equity loan)
Houses without a mortgage: 103
Median household income for houses/condos with a mortgage: $94,445
Median household income for apartments without a mortgage: $88,527
Median monthly housing costs: $1,292
Compare current foreclosures in Daphne, AL:
| Photo | Address | Area | Beds / Baths | Price | Details |
|---|---|---|---|---|---|

|
#1
Hillcrest Cir # 8
Daphne, AL 36526
|
1,467 sq. feet
|
2 baths 3 beds |
show details | |

|
#2
Drifton Ct
Daphne, AL 36526
|
1,799 sq. feet
|
2 baths 4 beds |
show details | |

|
#3
Rolling Hill Dr # 14
Daphne, AL 36526
|
2,755 sq. feet
|
4 baths 4 beds |
show details | |

|
#4
Marchand Ave
Daphne, AL 36526
|
2,091 sq. feet
|
3 baths 4 beds |
show details | |

|
#5
Bay View Dr
Daphne, AL 36526
|
1,334 sq. feet
|
3 baths 3 beds |
show details | |

|
#6
Rolling Hill Dr
Daphne, AL 36526
|
2,112 sq. feet
|
1 baths 3 beds |
show details | |

|
#7
Pollard Rd
Daphne, AL 36526
|
1,615 sq. feet
|
1 baths 3 beds |
show details | |

|
#8
Buena Vista Cir S
Daphne, AL 36526
|
1,283 sq. feet
|
1 baths 3 beds |
show details | |

|
#9
Daphmont Dr
Daphne, AL 36526
|
2,253 sq. feet
|
1 baths 3 beds |
show details | |

|
#10
Lawson Rd
Daphne, AL 36526
|
2,235 sq. feet
|
1 baths 3 beds |
show details |
| Photo | Address | Area | Beds / Baths | Price | Details |
|---|---|---|---|---|---|

|
#11
Nottingham Ct
Daphne, AL 36526
|
2,332 sq. feet
|
2 baths 4 beds |
show details | |

|
#12
Asbury Hill Rd
Daphne, AL 36526
|
1,533 sq. feet
|
2 baths 3 beds |
show details | |

|
#13
Wicker Way
Daphne, AL 36526
|
1,355 sq. feet
|
1 baths 3 beds |
show details | |

|
#14
Rolling Hill Dr
Daphne, AL 36526
|
2,112 sq. feet
|
1 baths 3 beds |
show details | |

|
#15
Hope Dr
Daphne, AL 36526
|
2,105 sq. feet
|
1 baths 3 beds |
show details | |

|
#16
Whispering Pines Rd
Daphne, AL 36526
|
2,452 sq. feet
|
1 baths 4 beds |
show details | |

|
#17
Ridgewood Dr
Daphne, AL 36526
|
1,608 sq. feet
|
1 baths 3 beds |
show details | |

|
#18
8th Ave
Daphne, AL 36526
|
891 sq. feet
|
2 baths 3 beds |
show details | |

|
#19
Michael Cir
Daphne, AL 36526
|
1,992 sq. feet
|
1 baths 3 beds |
show details | |

|
#20
Appomatox Dr
Daphne, AL 36526
|
1,696 sq. feet
|
2 baths 3 beds |
show details |
| Photo | Address | Area | Beds / Baths | Price | Details |
|---|---|---|---|---|---|

|
#21
Lawson Rd
Daphne, AL 36526
|
1,882 sq. feet
|
1 baths 3 beds |
show details | |

|
#22
Shiloh Dr
Daphne, AL 36526
|
1,368 sq. feet
|
1 baths 3 beds |
show details | |

|
#23
Cherryhill Dr
Daphne, AL 36526
|
1,698 sq. feet
|
1 baths 3 beds |
show details | |

|
#24
Gardenia Ct
Daphne, AL 36526
|
1,598 sq. feet
|
2 baths 3 beds |
show details | |

|
#25
Bit And Spur Dr
Daphne, AL 36526
|
1,839 sq. feet
|
2 baths 4 beds |
show details | |

|
#26
Shiloh Dr
Daphne, AL 36526
|
1,528 sq. feet
|
1 baths 3 beds |
show details | |

|
#27
Poets Cor
Daphne, AL 36526
|
2,156 sq. feet
|
2 baths 3 beds |
show details | |

|
#28
Hillcrest Cir
Daphne, AL 36526
|
1,467 sq. feet
|
1 baths 3 beds |
show details | |

|
#29
Deerwood Dr S
Daphne, AL 36526
|
1,745 sq. feet
|
2 baths 4 beds |
show details | |

|
#30
Canterbury Rd
Daphne, AL 36526
|
1,613 sq. feet
|
2 baths 3 beds |
show details |
| Photo | Address | Area | Beds / Baths | Price | Details |
|---|---|---|---|---|---|

|
#31
Ridgewood Dr
Daphne, AL 36526
|
1,275 sq. feet
|
1 baths 3 beds |
show details | |

|
#32
Worchester Dr
Daphne, AL 36526
|
2,678 sq. feet
|
1 baths 3 beds |
show details | |

|
#33
Cherryhill Dr
Daphne, AL 36526
|
1,714 sq. feet
|
2 baths 4 beds |
show details | |

|
#34
Stuart St
Daphne, AL 36526
|
1,587 sq. feet
|
1 baths 3 beds |
show details | |

|
#35
County Road 54 W # A
Daphne, AL 36526
|
1,941 sq. feet
|
1 baths 3 beds |
show details | |

|
#36
Mellattau Cir
Daphne, AL 36526
|
1,722 sq. feet
|
1 baths 3 beds |
show details | |

|
#37
Pine St
Daphne, AL 36526
|
1,456 sq. feet
|
1 baths 3 beds |
show details | |

|
#38
Lancaster Way
Daphne, AL 36526
|
1,927 sq. feet
|
1 baths 3 beds |
show details | |

|
#39
Larry Street Rd
Daphne, AL 36526
|
1,090 sq. feet
|
- baths 3 beds |
show details | |

|
#40
Richmond Rd
Daphne, AL 36526
|
1,496 sq. feet
|
1 baths - beds |
show details |
| Photo | Address | Area | Beds / Baths | Price | Details |
|---|---|---|---|---|---|

|
#41
Sintabouge Cir
Daphne, AL 36526
|
2,283 sq. feet
|
2 baths - beds |
show details | |

|
#42
Richmond Rd
Daphne, AL 36526
|
1,811 sq. feet
|
1 baths - beds |
show details | |

|
#43
Main St
Daphne, AL 36526
|
1,280 sq. feet
|
- baths 3 beds |
show details | |

|
#44
Steadfast Ct
Daphne, AL 36526
|
2,402 sq. feet
|
2 baths - beds |
show details | |

|
#45
Avery Ln
Daphne, AL 36526
|
1,615 sq. feet
|
2 baths - beds |
show details | |

|
#46
Courtland Ct
Daphne, AL 36526
|
2,136 sq. feet
|
2 baths - beds |
show details | |

|
#47
Mercer Ct
Daphne, AL 36526
|
3,132 sq. feet
|
2 baths - beds |
show details | |

|
#48
Chamberlain Ln
Daphne, AL 36526
|
2,346 sq. feet
|
2 baths - beds |
show details | |

|
#49
Pine St
Daphne, AL 36526
|
1,152 sq. feet
|
- baths 3 beds |
show details | |

|
Check over 1 million property listings on Foreclosure.com!
|
browse all offers | |||

Latest news about housing in Daphne, AL collected exclusively by city-data.com from local newspapers, TV, and radio stations

 | Bully breed friendly apartments/ townhomes/ condos/ houses in Mobile area? (1 reply) |
| Looking for rental homes in Daphne, Fairhope area on Eastern Shor (2 replies) |
| Mobile Area Real Estate (Mobile and Baldwin Counties) (175 replies) |
| Daphne -utilities (2 replies) |
| Looking to rent home in Plantation Hills, Daphne, Al (0 replies) |
| What is holding Mobile back? (187 replies) |

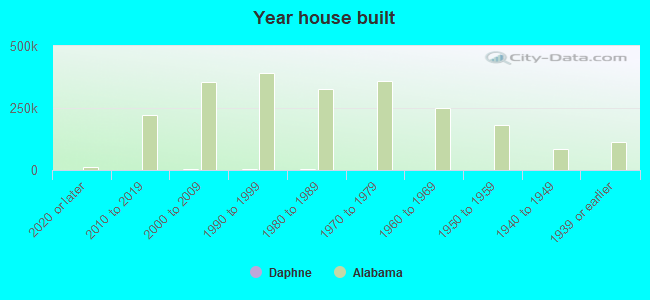
Median year apartment built: 1989
Household type by relationship:
Households: 29,414- Male householders: 5,670 (1,321 living alone), Female householders: 5,382 (1,548 living alone)
6,057 spouses (6,045 opposite-sex spouses), 805 unmarried partners, (785 opposite-sex unmarried partners), 9,402 children (8,681 natural, 205 adopted, 515 stepchildren), 501 grandchildren, 90 brothers or sisters, 447 parents, 32 foster children, 241 other relatives, 460 non-relatives
- In group quarters: 320
Size of family households: 3,322 2-persons, 2,064 3-persons, 1,781 4-persons, 714 5-persons, 116 6-persons, 135 7-or-more-persons.
Size of nonfamily households: 2,660 1-person, 693 2-persons, 30 3-persons, 24 4-persons.
4,692 married couples with children.
2,242 single-parent households (658 men, 1,584 women).
94.7% of residents of Daphne speak English at home.
1.3% of residents speak Spanish at home (87% speak English very well, 13% speak English well).
2.2% of residents speak other Indo-European language at home (90% speak English very well, 6% speak English well, 4% speak English not well).
1.4% of residents speak Asian or Pacific Island language at home (34% speak English very well, 26% speak English well, 30% speak English not well, 11% don't speak English at all).
0.3% of residents speak other language at home (100% speak English very well).
Foreign born population: 1,334 (4.5%)
(51.1% of them are naturalized citizens)
| Here: | 6.9 |
| State: | 6.5 |
| Here: | 4.2 |
| State: | 4.7 |
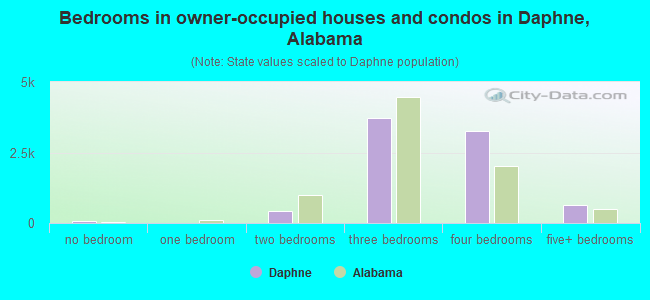
- Bedrooms in owner-occupied houses and condos in Daphne, Alabama
- 83no bedroom
- 161 bedroom
- 4402 bedrooms
- 3,7193 bedrooms
- 3,2574 bedrooms
- 6345+ bedrooms
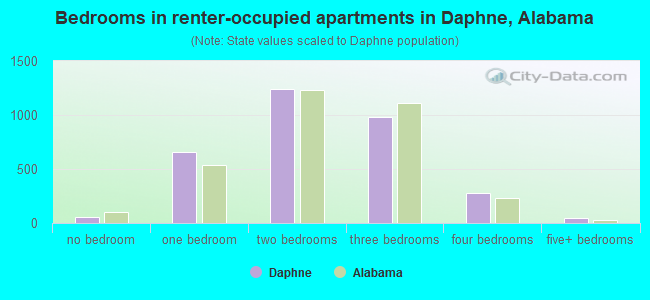
- Bedrooms in renter-occupied apartments in Daphne, Alabama
- 53no bedroom
- 6551 bedroom
- 1,2412 bedrooms
- 9803 bedrooms
- 2774 bedrooms
- 425+ bedrooms
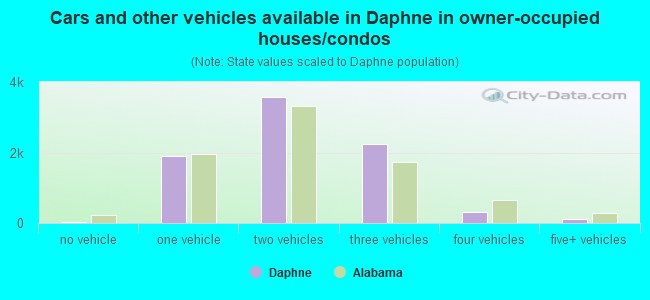
- Cars and other vehicles available in Daphne in owner-occupied houses/condos
- 24no vehicle
- 1,9021 vehicle
- 3,5692 vehicles
- 2,2273 vehicles
- 3224 vehicles
- 1055+ vehicles
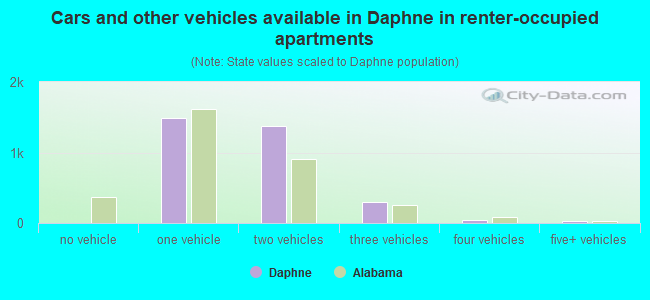
- Cars and other vehicles available in Daphne in renter-occupied apartments
- 0no vehicle
- 1,4901 vehicle
- 1,3792 vehicles
- 2983 vehicles
- 494 vehicles
- 325+ vehicles
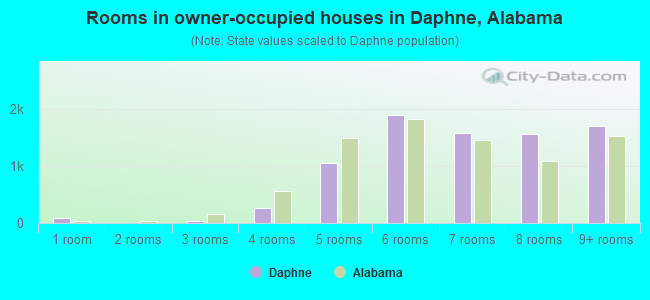
- Rooms in owner-occupied houses in Daphne, Alabama
- 831 room
- 02 rooms
- 293 rooms
- 2624 rooms
- 1,0465 rooms
- 1,8906 rooms
- 1,5797 rooms
- 1,5558 rooms
- 1,7059+ rooms
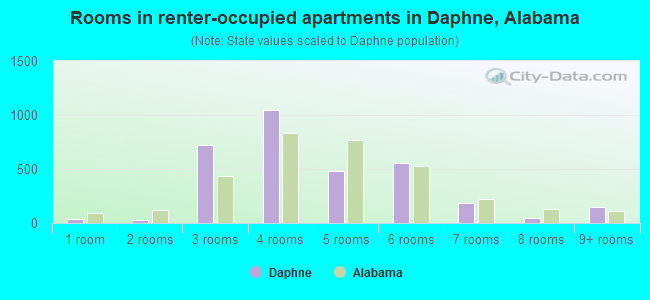
- Rooms in renter-occupied apartments in Daphne, Alabama
- 341 room
- 272 rooms
- 7263 rooms
- 1,0484 rooms
- 4845 rooms
- 5536 rooms
- 1837 rooms
- 488 rooms
- 1459+ rooms

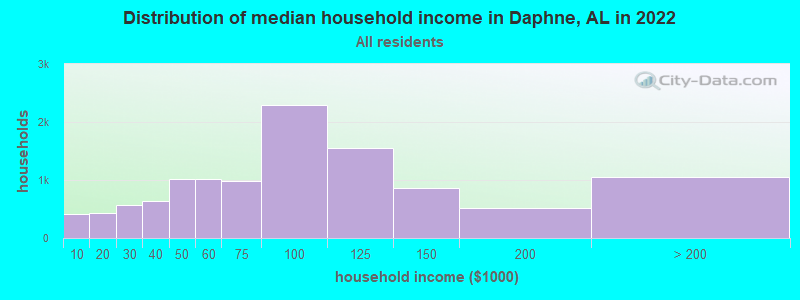
Daphne, AL household income distribution

- 413Less than $10,000
- 428$10,000 to $19,999
- 575$20,000 to $29,999
- 630$30,000 to $39,999
- 1,011$40,000 to $49,999
- 1,016$50,000 to $59,999
- 983$60,000 to $74,999
- 2,298$75,000 to $99,999
- 1,549$100,000 to $124,999
- 870$125,000 to $149,999
- 509$150,000 to $199,999
- 1,047$200,000 or more
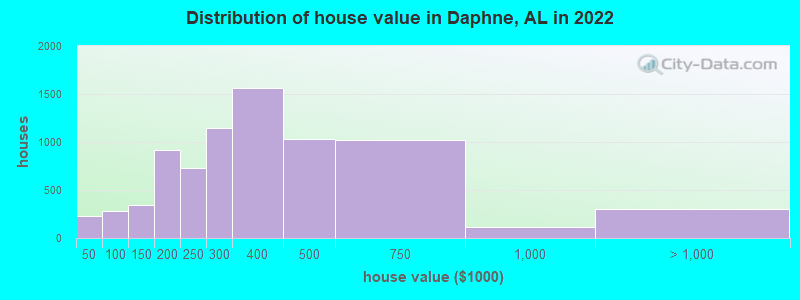
Home value of owner - occupied houses in 2022 in Daphne, AL
-
- 125Less than $10,000
- 15$15,000 to $19,999
- 6$20,000 to $24,999
- 9$30,000 to $34,999
- 75$40,000 to $49,999
- 110$50,000 to $59,999
- 8$80,000 to $89,999
- 90$90,000 to $99,999
- 85$100,000 to $124,999
- 261$125,000 to $149,999
- 387$150,000 to $174,999
- 529$175,000 to $199,999
- 734$200,000 to $249,999
- 1,142$250,000 to $299,999
- 1,561$300,000 to $399,999
- 1,030$400,000 to $499,999
- 1,017$500,000 to $749,999
- 112$750,000 to $999,999
- 241$1,000,000 to $1,499,999
- 63$2,000,000 or more
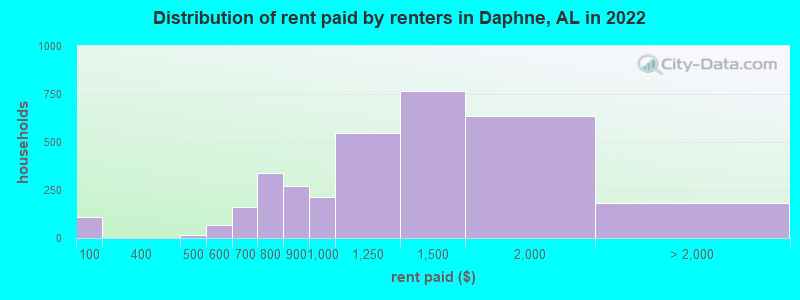
Rent paid by renters in 2022 in Daphne, AL
-
- 109Less than $100
- 13$400 to $449
- 70$500 to $549
- 58$600 to $649
- 104$650 to $699
- 23$700 to $749
- 313$750 to $799
- 273$800 to $899
- 213$900 to $999
- 546$1,000 to $1,249
- 765$1,250 to $1,499
- 637$1,500 to $1,999
- 83$2,000 to $2,499
- 34$2,500 to $2,999
- 65No cash rent
Percentage of workers working in this county: 63.2%
Number of people working at home: 1,812 (13.3% of all workers)
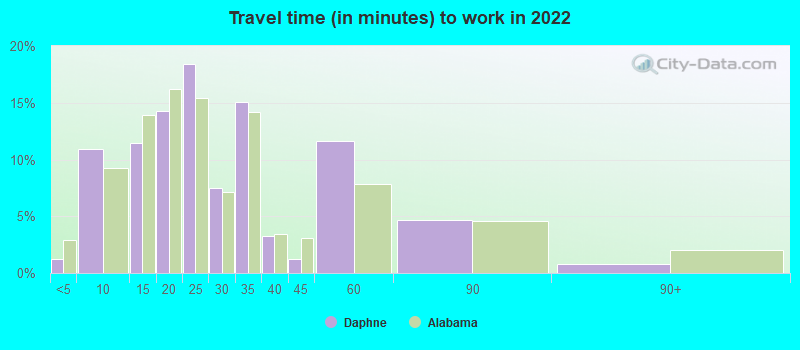
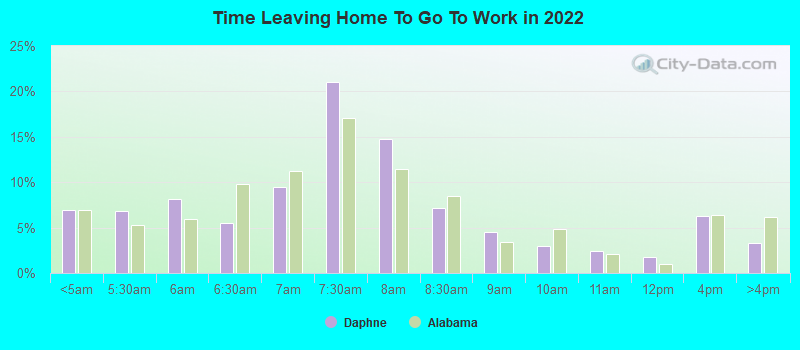
Travel time to work (commute)
- Less than 5 minutes: 126
- 5 to 9 minutes: 1,322
- 10 to 14 minutes: 1,446
- 15 to 19 minutes: 1,545
- 20 to 24 minutes: 1,852
- 25 to 29 minutes: 990
- 30 to 34 minutes: 1,673
- 35 to 39 minutes: 409
- 40 to 44 minutes: 478
- 45 to 59 minutes: 1,029
- 60 to 89 minutes: 774
- 90 or more minutes: 314
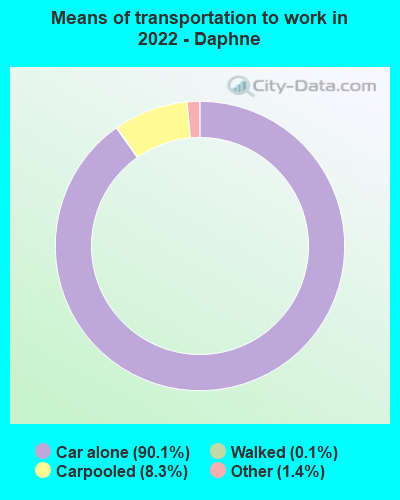
Means of transportation to work:
- Drove a car alone: 10,571 (78.7%)
- Carpooled: 986 (7.3%)
- Taxi: 225 (1.7%)
- Walked: 17 (0.1%)
- Worked at home: 1,812 (13.5%)
- Unemployment by race in 2022
- Unemployment rate for White non-Hispanic residents
- 1.2%Males
- 1.6%Females
- Unemployment rate for Black residents
- 4.7%Males
- 7.7%Females
- Unemployment rate for American Indian and Alaska Native residents
- 55.2%Females
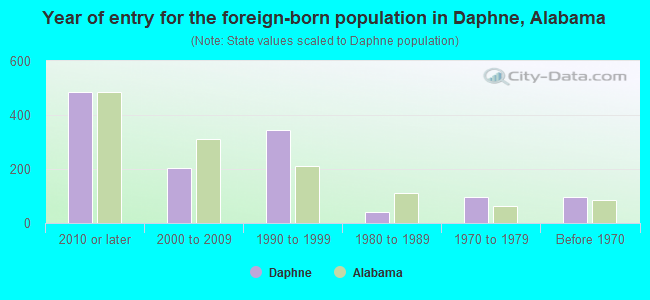
- Year of entry for the foreign-born population in Daphne, Alabama
- 4862010 or later
- 2032000 to 2009
- 3431990 to 1999
- 391980 to 1989
- 981970 to 1979
- 98Before 1970
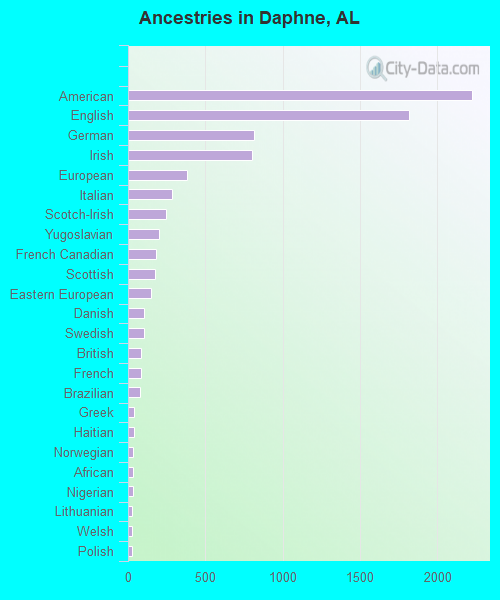
First ancestries reported:
- American: 2,223 (18.5%)
- English: 1,814 (15.1%)
- German: 814 (6.8%)
- Irish: 804 (6.7%)
- European: 383 (3.2%)
- Italian: 286 (2.4%)
- Scotch-Irish: 247 (2.1%)
- Yugoslavian: 199 (1.7%)
- French Canadian: 182 (1.5%)
- Scottish: 176 (1.5%)
- Eastern European: 149 (1.2%)
- Danish: 106 (0.9%)
- Swedish: 106 (0.9%)
- British: 84 (0.7%)
- French: 82 (0.7%)
- Brazilian: 79 (0.7%)
- Greek: 40 (0.3%)
- Haitian: 39 (0.3%)
- Norwegian: 33 (0.3%)
- African: 31 (0.3%)
- Nigerian: 30 (0.2%)
- Lithuanian: 28 (0.2%)
- Welsh: 25 (0.2%)
- Polish: 24 (0.2%)
- Austrian: 19 (0.2%)
- Turkish: 19 (0.2%)
- Finnish: 15 (0.1%)
- Belgian: 13 (0.1%)
- Czech: 13 (0.1%)
- Canadian: 8 (0.07%)
- Russian: 7 (0.06%)
- Swiss: 5 (0.04%)
- Palestinian: 2 (0.02%)
Most common places of birth for foreign-born residents (%):
| Daphne: | 11.3% (134) |
| Alabama: | 5.2% (9,293) |
| Daphne: | 10.7% (127) |
| Alabama: | 1.9% (3,447) |
| Daphne: | 9.8% (116) |
| Alabama: | 2.3% (4,000) |
| Daphne: | 9.3% (110) |
| Alabama: | 1.1% (1,867) |
| Daphne: | 9.1% (108) |
| Alabama: | 0.1% (225) |
| Daphne: | 5.7% (67) |
| Alabama: | 0.0% (84) |
| Daphne: | 5.5% (65) |
| Alabama: | 0.1% (144) |
| Daphne: | 5.3% (63) |
| Alabama: | 1.3% (2,391) |
| Daphne: | 4.6% (54) |
| Alabama: | 0.2% (416) |
| Daphne: | 3.7% (44) |
| Alabama: | 3.6% (6,414) |
| Daphne: | 2.8% (33) |
| Alabama: | 5.5% (9,672) |
| Daphne: | 2.6% (31) |
| Alabama: | 0.4% (631) |
| Daphne: | 2.6% (31) |
| Alabama: | 1.1% (1,979) |
| Daphne: | 1.6% (19) |
| Alabama: | 2.9% (5,154) |
Place of birth for U.S.-born residents:
- This state: 14,952
- Other state: 12,428
- Northeast: 1,201
- Midwest: 2,008
- South: 7,541
- West: 1,634
82.1% of Daphne residents lived in the same house 1 years ago.
Out of people who lived in different houses, 33.4% lived in this county.
Out of people who lived in different counties, 44.2% lived in Alabama.
| Daphne: | 82.1% |
| State average: | 87.6% |
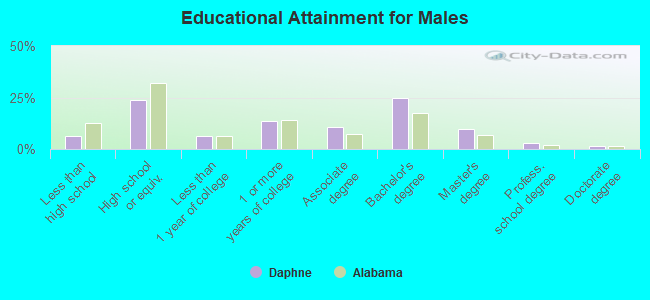
Education attainment for males 25 years and older:
- No schooling: 7
- Nursery to 4th grade: 0
- 5th and 6th grade: 31
- 7th and 8th grade: 119
- 9th grade: 51
- 10th grade: 93
- 11th grade: 180
- 12th grade, no diploma: 139
- High school graduate (or equivalency): 2,278
- Less than 1 year of college: 612
- Some college more than 1 year, no degree: 1,303
- Associate degree: 1,032
- Bachelor's degree: 2,404
- Master's degree: 954
- Professional school degree: 268
- Doctorate degree: 163
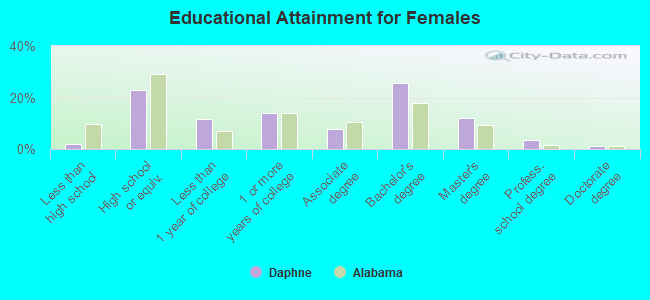
Education attainment for females 25 years and older:
- No schooling: 30
- Nursery to 4th grade: 0
- 5th and 6th grade: 48
- 7th and 8th grade: 0
- 9th grade: 36
- 10th grade: 19
- 11th grade: 0
- 12th grade, no diploma: 54
- High school graduate (or equivalency): 2,426
- Less than 1 year of college: 1,210
- Some college more than 1 year, no degree: 1,456
- Associate degree: 820
- Bachelor's degree: 2,700
- Master's degree: 1,255
- Professional school degree: 368
- Doctorate degree: 117


Housing units in structures:
- One, detached: 8,844
- One, attached: 284
- Two: 133
- 3 or 4: 364
- 5 to 9: 1,225
- 10 to 19: 579
- 20 to 49: 138
- 50 or more: 305
- Mobile homes: 103
Housing units lacking complete kitchen facilities in 2022: 0.4%
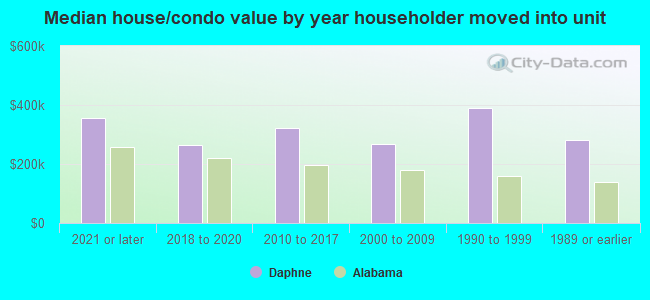
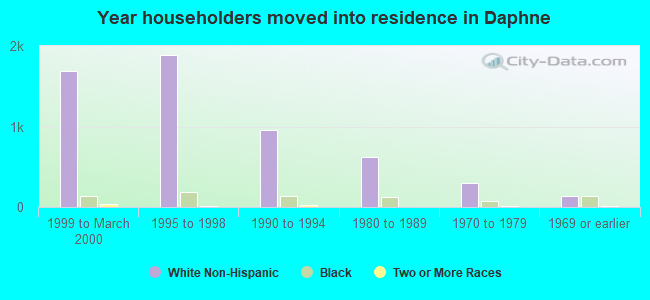
House/condo owner moved in on average 7 years ago
Renter moved in on average 2 years ago
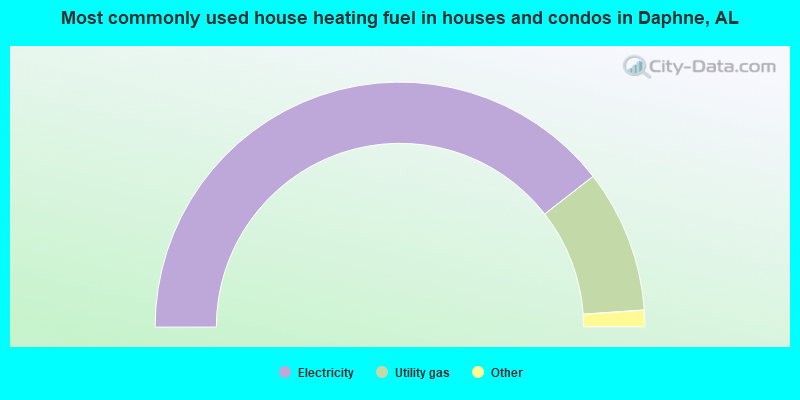
- 79.0%Electricity
- 18.9%Utility gas
- 1.2%No fuel used
- 0.8%Bottled, tank, or LP gas
- 0.1%Other fuel
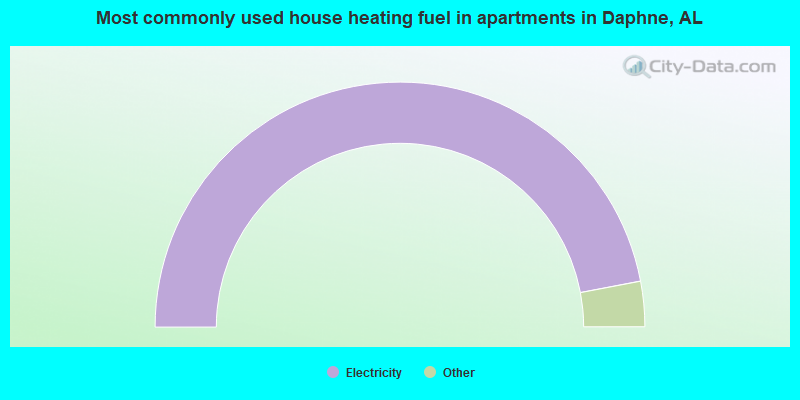
- 94.1%Electricity
- 2.3%Utility gas
- 1.9%Bottled, tank, or LP gas
- 1.7%No fuel used
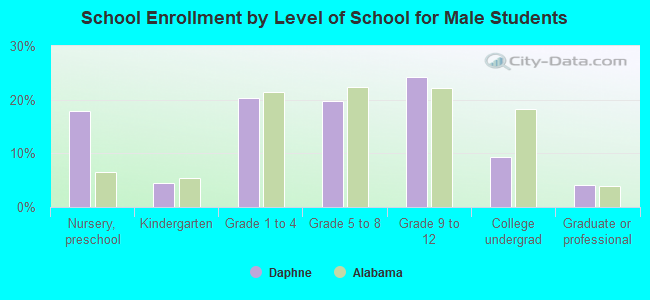
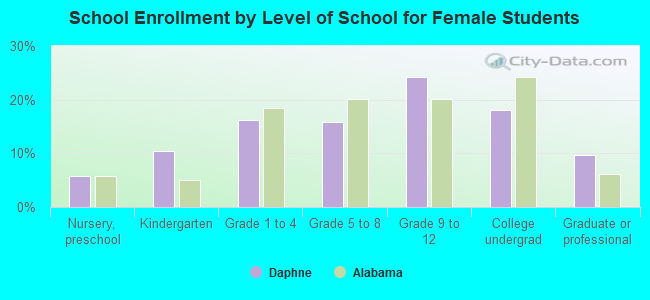
Private vs. public school enrollment:
| Here: | 23.6% |
| Alabama: | 14.7% |
| Here: | 33.3% |
| Alabama: | 16.3% |
| Here: | 18.4% |
| Alabama: | 14.6% |