Dale City, VA (Virginia) Houses and Residents
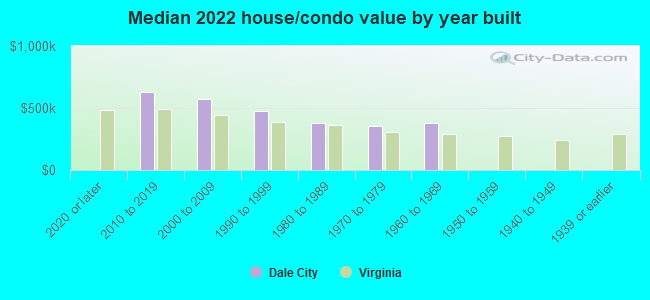
Estimated median house or condo value in 2022: $403,600 (it was $133,900 in 2000 )
Dale City:
$403,600Virginia:
$365,700
Lower value quartile - upper value quartile: $332,400 - $499,700Mean price in 2022: Detached houses: $468,380 Here:
$468,380State:
$472,865
Townhouses or other attached units: $345,170 Here:
$345,170State:
$457,437
In 3-to-4-unit structures: $180,814 Here:
$180,814State:
$252,346
In 5-or-more-unit structures: $213,041 Here:
$213,041State:
$382,551
Mobile homes: $266,868 Here:
$266,868State:
$100,736
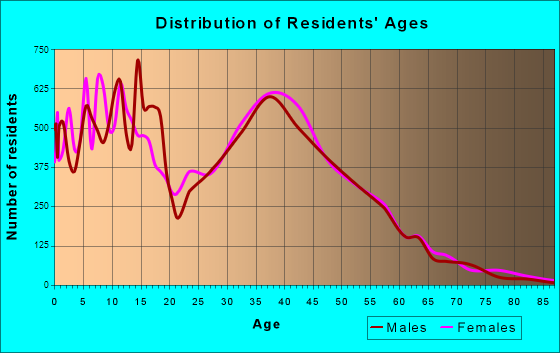
Total population: 65,969 (Urban population: 56,053, Rural population: 0)
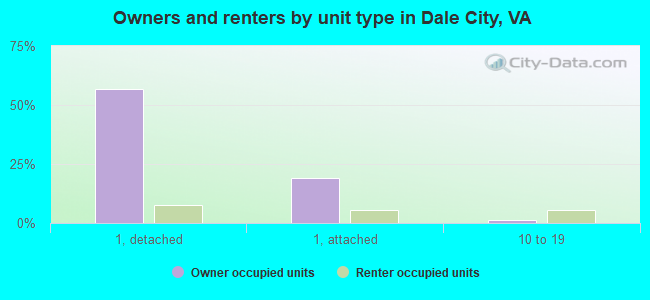
Houses: 21,523 (20,980 occupied: 15,953 owner occupied, 5,027 renter occupied )
% of renters here:
24%State:
33%
Housing density: 1,431 houses/condos per square mile
Median price asked for vacant for-sale houses and condos in 2022: $499,571.
Median contract rent in 2022: $1,429 (lower quartile is $1,129, upper quartile is over $2,000)
Median rent asked for vacant for-rent units in 2022: $1,513
Median gross rent in Dale City, VA in 2022: $1,526
Housing units in Dale City with a mortgage: 12,157 (842 second mortgage, 0 home equity loan, 765 both second mortgage and home equity loan )Houses without a mortgage: 280
Median household income for houses/condos with a mortgage: $127,922
Median household income for apartments without a mortgage: $97,168
Median monthly housing costs: $1,813
Data:
Median house or condo value ($)
Median house or condo value ($ change since 2000)
Median house or condo value ($) - White
Median house or condo value ($) - Black or African American
Median house or condo value ($) - Asian
Median house or condo value ($) - Hispanic or Latino
Median house or condo value ($) - American Indian and Alaska Native
Median house or condo value ($) - Multirace
Median house or condo value ($) - Other Race
Median price asked for mobile homes ($)
Household density (households per square mile)
Mean house or condo value by units in structure - 1, detached ($)
Mean house or condo value by units in structure - 1, attached ($)
Mean house or condo value by units in structure - 2 ($)
Mean house or condo value by units in structure by units in structure - 3 or 4 ($)
Mean house or condo value by units in structure - 5 or more ($)
Mean house or condo value by units in structure - Boat, RV, van, etc. ($)
Mean house or condo value by units in structure - Mobile home ($)
Median contract rent ($)
Median contract rent - Lower quartile ($)
Median contract rent - Upper quartile ($)
Median gross rent ($)
Urban houses (%)
Rural houses (%)
Houses occupied (%)
Houses occupied (% change since 2000)
Houses owner occupied (%)
Houses owner occupied (% change since 2000)
Houses renter occupied (%)
Houses renter occupied (% change since 2000)
Vacant housing units - For rent (%)
Vacant housing units - For rent (% change since 2000)
Vacant housing units - For sale only (%)
Vacant housing units - For sale only (% change since 2000)
Vacant housing units - Rented or sold, not occupied (%)
Vacant housing units - Rented or sold, not occupied (% change since 2000)
Vacant housing units - For seasonal, recreational, or occasional use (%)
Vacant housing units - For seasonal, recreational, or occasional use (% change since 2000)
Vacant housing units - For migrant workers (%)
Vacant housing units - For migrant workers (% change since 2000)
Vacant housing units - Other vacant (%)
Vacant housing units - Other vacant (% change since 2000)
Median monthly housing costs ($)
Median household income for houses/condos with a mortgage ($)
Median household income for houses/condos without a mortgage ($)
Median household income ($)
Median household income ($) - White
Median household income ($) - Black or African American
Median household income ($) - Asian
Median household income ($) - Hispanic or Latino
Median household income ($) - American Indian and Alaska Native
Median household income ($) - Multirace
Median household income ($) - Other Race
Mortgage status - with mortgage (%)
Mortgage status - with second mortgage (%)
Mortgage status - with home equity loan (%)
Mortgage status - with both second mortgage and home equity loan (%)
Mortgage status - without a mortgage (%)
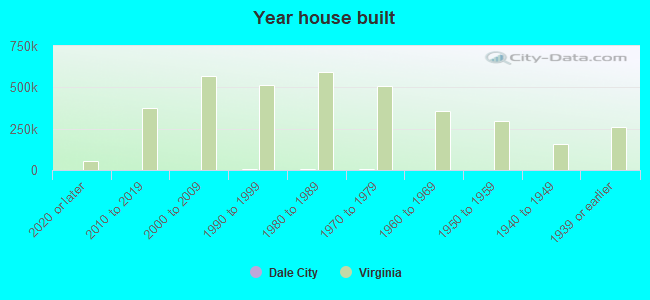
Median year house/condo built
Median year apartment built
Household type by relationship - Male householder living alone (%)
Household type by relationship - Male householder not living alone (%)
Household type by relationship - Female householder living alone (%)
Household type by relationship - Female householder not living alone (%)
Household type by relationship - Opposite-Sex spouse (%)
Household type by relationship - Same-Sex spouse (%)
Household type by relationship - Opposite-Sex unmarried partner (%)
Household type by relationship - Same-Sex unmarried partner (%)
Household type by relationship - In group quarters (%)
Size of family households - 2-person household (%)
Size of family households - 3-person household (%)
Size of family households - 4-person household (%)
Size of family households - 5-person household (%)
Size of family households - 6-person household (%)
Size of family households - 7-or-more-person household (%)
Size of nonfamily households - 1-person household (%)
Size of nonfamily households - 2-person household (%)
Size of nonfamily households - 3-person household (%)
Size of nonfamily households - 4-person household (%)
Size of nonfamily households - 5-person household (%)
Size of nonfamily households - 6-person household (%)
Size of nonfamily households - 7-or-moreperson household (%)
Year house built - Built 2010 or later (%)
Year house built - Built 2000 to 2009 (%)
Year house built - Built 1990 to 1999 (%)
Year house built - Built 1980 to 1989 (%)
Year house built - Built 1970 to 1979 (%)
Year house built - Built 1960 to 1969 (%)
Year house built - Built 1950 to 1959 (%)
Year house built - Built 1940 to 1949 (%)
Year house built - Built 1939 or earlier (%)
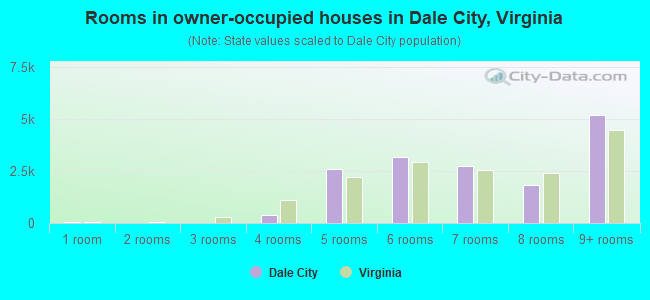
Median number of rooms in houses and condos
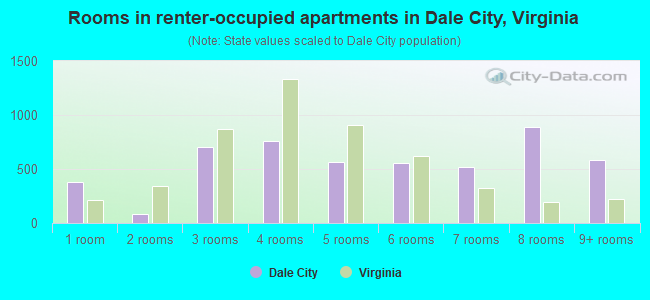
Median number of rooms in apartments
Median number of bedrooms in owner occupied houses
Mean number of bedrooms in owner occupied houses
Median number of bedrooms in renter occupied houses
Mean number of bedrooms in renter occupied houses
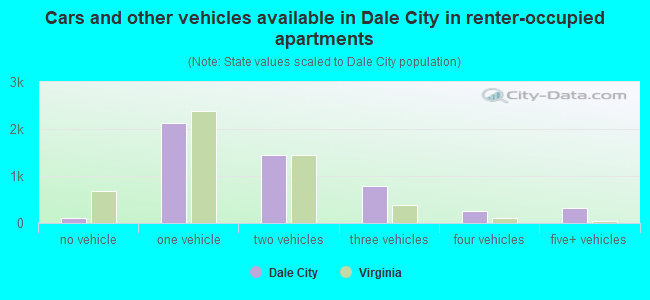
Median number of vehichles in owner occupied houses
Mean number of vehichles in owner occupied houses
Median number of vehichles in renter occupied houses
Mean number of vehichles in renter occupied houses
Rooms in owner-occupied houses - 1 room (%)
Rooms in owner-occupied houses - 2 rooms (%)
Rooms in owner-occupied houses - 3 rooms (%)
Rooms in owner-occupied houses - 4 rooms (%)
Rooms in owner-occupied houses - 5 rooms (%)
Rooms in owner-occupied houses - 6 rooms (%)
Rooms in owner-occupied houses - 7 rooms (%)
Rooms in owner-occupied houses - 8 rooms (%)
Rooms in owner-occupied houses - 9+ rooms (%)
Rooms in renter-occupied houses - 1 room (%)
Rooms in renter-occupied houses - 2 rooms (%)
Rooms in renter-occupied houses - 3 rooms (%)
Rooms in renter-occupied houses - 4 rooms (%)
Rooms in renter-occupied houses - 5 rooms (%)
Rooms in renter-occupied houses - 6 rooms (%)
Rooms in renter-occupied houses - 7 rooms (%)
Rooms in renter-occupied houses - 8 rooms (%)
Rooms in renter-occupied houses - 9+ rooms (%)
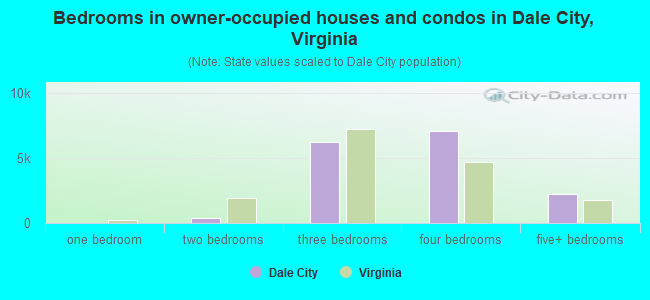
Bedrooms in owner-occupied houses - no bedrooms (%)
Bedrooms in owner-occupied houses - 1 bedroom (%)
Bedrooms in owner-occupied houses - 2 bedrooms (%)
Bedrooms in owner-occupied houses - 3 bedrooms (%)
Bedrooms in owner-occupied houses - 4 bedrooms (%)
Bedrooms in owner-occupied houses - 5+ bedrooms (%)
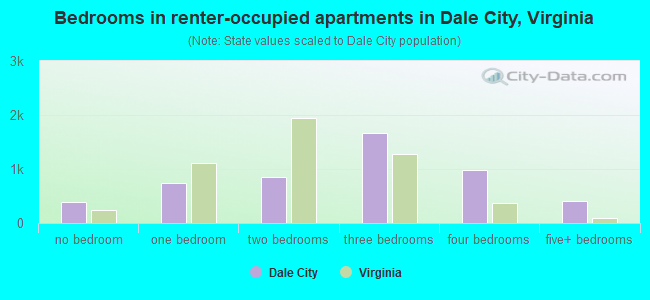
Bedrooms in renter-occupied houses - no bedrooms (%)
Bedrooms in renter-occupied houses - 1 bedroom (%)
Bedrooms in renter-occupied houses - 2 bedrooms (%)
Bedrooms in renter-occupied houses - 3 bedrooms (%)
Bedrooms in renter-occupied houses - 4 bedrooms (%)
Bedrooms in renter-occupied houses - 5+ bedrooms (%)
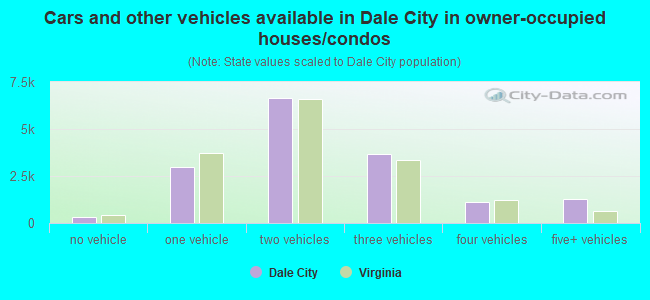
Vehicles available in owner-occupied houses - no vehicle available (%)
Vehicles available in owner-occupied houses - 1 vehicle available(%)
Vehicles available in owner-occupied houses - 2 Vehicles available (%)
Vehicles available in owner-occupied houses - 3 Vehicles available (%)
Vehicles available in owner-occupied houses - 4 Vehicles available (%)
Vehicles available in owner-occupied houses - 5+ Vehicles available (%)
Vehicles available in renter-occupied houses - no vehicle available (%)
Vehicles available in renter-occupied houses - 1 vehicle available (%)
Vehicles available in renter-occupied houses - 2 Vehicles available (%)
Vehicles available in renter-occupied houses - 3 Vehicles available (%)
Vehicles available in renter-occupied houses - 4 Vehicles available (%)
Vehicles available in renter-occupied houses - 5+ Vehicles available (%)
Housing units in structures - 1, detached (%)
Housing units in structures - 1, attached (%)
Housing units in structures - 2 (%)
Housing units in structures - 3 or 4 (%)
Housing units in structures - 5 to 9 (%)
Housing units in structures - 10 to 19 (%)
Housing units in structures - 20 to 49 (%)
Housing units in structures - 50 or more (%)
Housing units in structures - Mobile home (%)
Housing units in structures - Boat, RV, van, etc. (%)
Housing units in structures - Owners - 1, detached (%)
Housing units in structures - Owners - 1, attached (%)
Housing units in structures - Owners - 2 (%)
Housing units in structures - Owners - 3 or 4 (%)
Housing units in structures - Owners - 5 to 9 (%)
Housing units in structures - Owners - 10 to 19 (%)
Housing units in structures - Owners - 20 to 49 (%)
Housing units in structures - Owners - 50 or more (%)
Housing units in structures - Owners - Mobile home (%)
Housing units in structures - Owners - Boat, RV, van, etc. (%)
Housing units in structures - Renters - 1, detached (%)
Housing units in structures - Renters - 1, attached (%)
Housing units in structures - Renters - 2 (%)
Housing units in structures - Renters - 3 or 4 (%)
Housing units in structures - Renters - 5 to 9 (%)
Housing units in structures - Renters - 10 to 19 (%)
Housing units in structures - Renters - 20 to 49 (%)
Housing units in structures - Renters - 50 or more (%)
Housing units in structures - Renters - Mobile home (%)
Housing units in structures - Renters - Boat, RV, van, etc. (%)
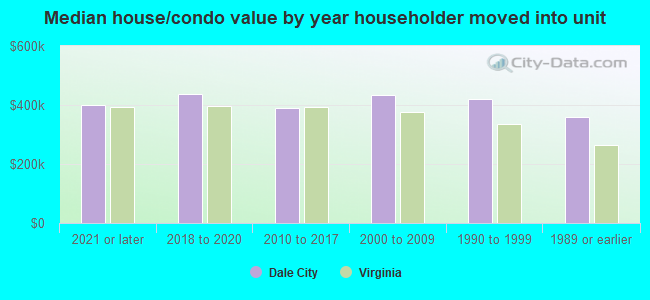
House/condo owner moved in on average (years ago)
Renter moved in on average (years ago)
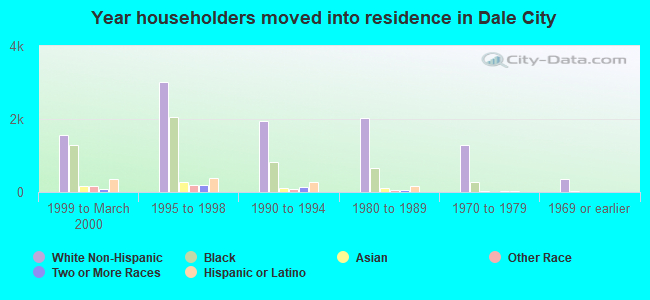
Year householder moved into unit - Moved in 1999 to March 2000 (%)
Year householder moved into unit - Moved in 1999 to March 2000 (%) - White
Year householder moved into unit - Moved in 1999 to March 2000 (%) - Black or African American
Year householder moved into unit - Moved in 1999 to March 2000 (%) - Asian
Year householder moved into unit - Moved in 1999 to March 2000 (%) - Hispanic or Latino
Year householder moved into unit - Moved in 1999 to March 2000 (%) - American Indian and Alaska Native
Year householder moved into unit - Moved in 1999 to March 2000 (%) - Multirace
Year householder moved into unit - Moved in 1999 to March 2000 (%) - Other Race
Year householder moved into unit - Moved in 1995 to 1998 (%)
Year householder moved into unit - Moved in 1995 to 1998 (%) - White
Year householder moved into unit - Moved in 1995 to 1998 (%) - Black or African American
Year householder moved into unit - Moved in 1995 to 1998 (%) - Asian
Year householder moved into unit - Moved in 1995 to 1998 (%) - Hispanic or Latino
Year householder moved into unit - Moved in 1995 to 1998 (%) - American Indian and Alaska Native
Year householder moved into unit - Moved in 1995 to 1998 (%) - Multirace
Year householder moved into unit - Moved in 1995 to 1998 (%) - Other Race
Year householder moved into unit - Moved in 1990 to 1994 (%)
Year householder moved into unit - Moved in 1990 to 1994 (%) - White
Year householder moved into unit - Moved in 1990 to 1994 (%) - Black or African American
Year householder moved into unit - Moved in 1990 to 1994 (%) - Asian
Year householder moved into unit - Moved in 1990 to 1994 (%) - Hispanic or Latino
Year householder moved into unit - Moved in 1990 to 1994 (%) - American Indian and Alaska Native
Year householder moved into unit - Moved in 1990 to 1994 (%) - Multirace
Year householder moved into unit - Moved in 1990 to 1994 (%) - Other Race
Year householder moved into unit - Moved in 1980 to 1989 (%)
Year householder moved into unit - Moved in 1980 to 1989 (%) - White
Year householder moved into unit - Moved in 1980 to 1989 (%) - Black or African American
Year householder moved into unit - Moved in 1980 to 1989 (%) - Asian
Year householder moved into unit - Moved in 1980 to 1989 (%) - Hispanic or Latino
Year householder moved into unit - Moved in 1980 to 1989 (%) - American Indian and Alaska Native
Year householder moved into unit - Moved in 1980 to 1989 (%) - Multirace
Year householder moved into unit - Moved in 1980 to 1989 (%) - Other Race
Year householder moved into unit - Moved in 1970 to 1979 (%)
Year householder moved into unit - Moved in 1970 to 1979 (%) - White
Year householder moved into unit - Moved in 1970 to 1979 (%) - Black or African American
Year householder moved into unit - Moved in 1970 to 1979 (%) - Asian
Year householder moved into unit - Moved in 1970 to 1979 (%) - Hispanic or Latino
Year householder moved into unit - Moved in 1970 to 1979 (%) - American Indian and Alaska Native
Year householder moved into unit - Moved in 1970 to 1979 (%) - Multirace
Year householder moved into unit - Moved in 1970 to 1979 (%) - Other Race
Year householder moved into unit - Moved in 1969 or earlier (%)
Year householder moved into unit - Moved in 1969 or earlier (%) - White
Year householder moved into unit - Moved in 1969 or earlier (%) - Black or African American
Year householder moved into unit - Moved in 1969 or earlier (%) - Asian
Year householder moved into unit - Moved in 1969 or earlier (%) - Hispanic or Latino
Year householder moved into unit - Moved in 1969 or earlier (%) - American Indian and Alaska Native
Year householder moved into unit - Moved in 1969 or earlier (%) - Multirace
Year householder moved into unit - Moved in 1969 or earlier (%) - Other Race
Housing units lacking complete plumbing facilities (%)
Housing units lacking complete kitchen facilities (%)
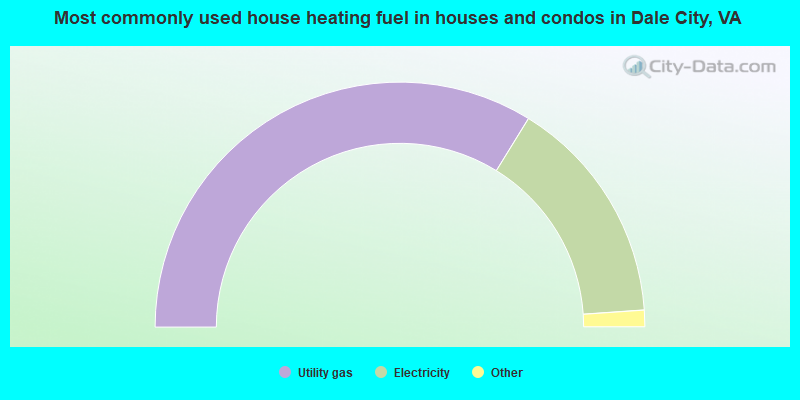
House heating fuel used in houses and condos - Utility gas (%)
House heating fuel used in houses and condos - Bottled, tank, or LP gas (%)
House heating fuel used in houses and condos - Electricity (%)
House heating fuel used in houses and condos - Fuel oil, kerosene, etc. (%)
House heating fuel used in houses and condos - Coal or coke (%)
House heating fuel used in houses and condos - Wood (%)
House heating fuel used in houses and condos - Solar energy (%)
House heating fuel used in houses and condos - Other fuel (%)
House heating fuel used in houses and condos - No fuel used (%)
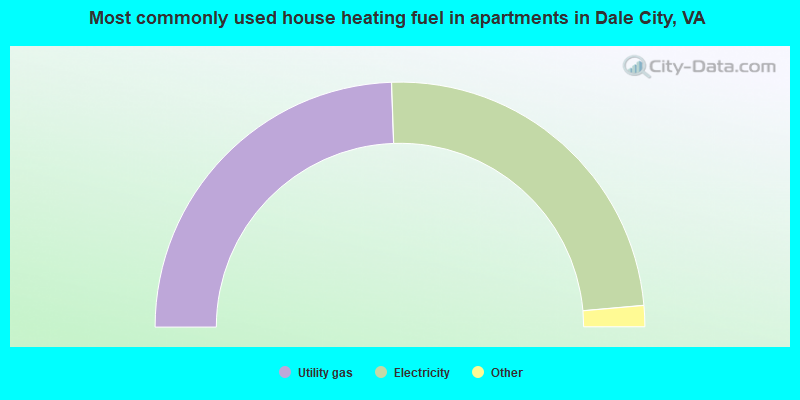
House heating fuel used in apartments - Utility gas (%)
House heating fuel used in apartments - Bottled, tank, or LP gas (%)
House heating fuel used in apartments - Electricity (%)
House heating fuel used in apartments - Fuel oil, kerosene, etc. (%)
House heating fuel used in apartments - Coal or coke (%)
House heating fuel used in apartments - Wood (%)
House heating fuel used in apartments - Solar energy (%)
House heating fuel used in apartments - Other fuel (%)
House heating fuel used in apartments - No fuel used (%)
Median year house/condo built: 1983Median year apartment built: 1981Household type by relationship:
Households: 66,140
Male householders: 11,692 (1,916 living alone ), Female householders: 9,288 (2,142 living alone )11,976 spouses (11,900 opposite-sex spouses ), 1,450 unmarried partners , (1,381 opposite-sex unmarried partners ), 20,482 children (18,719 natural , 533 adopted , 1,230 stepchildren ), 1,542 grandchildren , 2,479 brothers or sisters , 2,344 parents , 0 foster children , 3,212 other relatives , 1,623 non-relatives In group quarters: 52
Size of family households: 6,661 2-persons , 2,143 3-persons , 3,084 4-persons , 2,257 5-persons , 975 6-persons , 1,119 7-or-more-persons .
Size of nonfamily households: 4,058 1-person , 602 2-persons , 81 3-persons .
8,673 married couples with children. single-parent households (1,120 men , 3,077 women ).
53.3% of residents of Dale City speak English at home. of residents speak Spanish at home (55% speak English very well , 26% speak English well , 14% speak English not well , 5% don't speak English at all ).of residents speak other Indo-European language at home (67% speak English very well , 24% speak English well , 7% speak English not well , 2% don't speak English at all ).of residents speak Asian or Pacific Island language at home (49% speak English very well , 27% speak English well , 22% speak English not well , 2% don't speak English at all ).of residents speak other language at home (66% speak English very well , 23% speak English well , 9% speak English not well , 2% don't speak English at all ).
Foreign born population: 20,827 (31.5%)of them are naturalized citizens )
Median number of rooms in houses and condos:
Median number of rooms in apartments
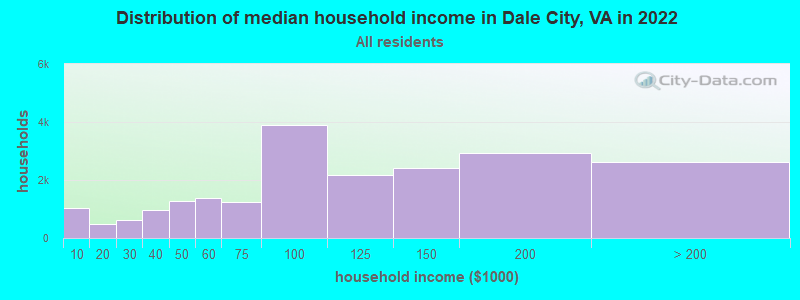
Dale City, VA household income distribution 1,026 Less than $10,000467 $10,000 to $19,999608 $20,000 to $29,999964 $30,000 to $39,9991,279 $40,000 to $49,9991,369 $50,000 to $59,9991,236 $60,000 to $74,9993,886 $75,000 to $99,9992,176 $100,000 to $124,9992,427 $125,000 to $149,9992,934 $150,000 to $199,9992,608 $200,000 or more
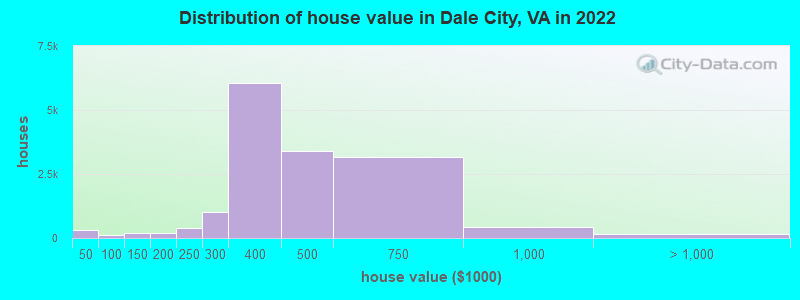
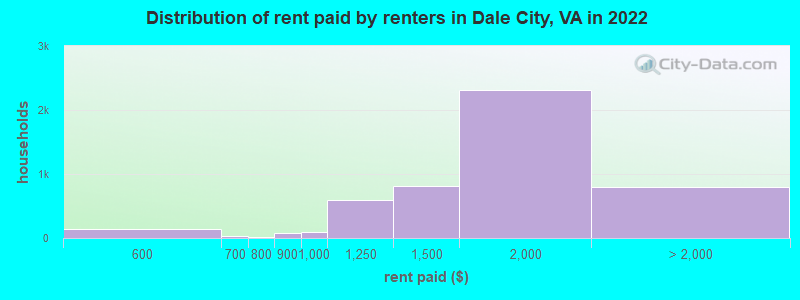
Home value of owner - occupied houses in 2022 in Dale City, VA 224 Less than $10,0006 $20,000 to $24,99912 $25,000 to $29,99935 $30,000 to $34,99920 $35,000 to $39,99932 $40,000 to $49,99956 $50,000 to $59,99917 $70,000 to $79,999138 $100,000 to $124,99960 $125,000 to $149,999131 $150,000 to $174,99959 $175,000 to $199,999378 $200,000 to $249,9991,034 $250,000 to $299,9996,062 $300,000 to $399,9993,396 $400,000 to $499,9993,155 $500,000 to $749,999415 $750,000 to $999,99950 $1,000,000 to $1,499,9996 $1,500,000 to $1,999,99999 $2,000,000 or moreRent paid by renters in 2022 in Dale City, VA 8 Less than $1008 $400 to $4492 $450 to $499135 $500 to $5498 $550 to $59910 $600 to $64928 $650 to $69910 $700 to $74911 $750 to $79973 $800 to $89992 $900 to $999590 $1,000 to $1,249818 $1,250 to $1,4992,319 $1,500 to $1,999429 $2,000 to $2,499198 $2,500 to $2,99922 $3,000 to $3,499143 No cash rent
Percentage of workers working in this county: 54.3%Number of people working at home: 5,899 (15.3% of all workers )
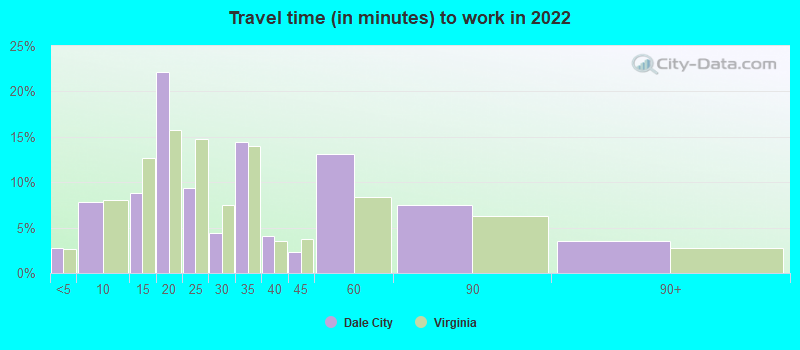
Travel time to work (commute)
Less than 5 minutes: 5055 to 9 minutes: 59110 to 14 minutes: 1,32815 to 19 minutes: 4,01520 to 24 minutes: 3,79125 to 29 minutes: 1,91030 to 34 minutes: 5,09735 to 39 minutes: 24940 to 44 minutes: 2,01945 to 59 minutes: 4,44560 to 89 minutes: 4,74090 or more minutes: 392
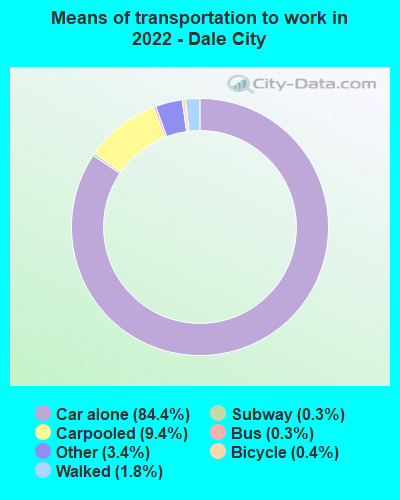
Means of transportation to work:
Drove a car alone: 5,389 (46.4%)Carpooled: 597 (5.1%)Bus : 13 (0.1%)Long-distance train or commuter rail : 28 (0.2%)Taxi: 313 (2.7%)Bicycle: 20 (0.2%)Walked: 107 (0.9%)Worked at home: 5,899 (50.7%)
Unemployment by race in 2022
Unemployment rate for White non-Hispanic residents 4.7% MalesUnemployment rate for Black residents 4.8% Males4.3% FemalesUnemployment rate for American Indian and Alaska Native residents 1.6% MalesUnemployment rate for Asian residents 7.9% Males1.5% FemalesUnemployment rate for other race residents 4.7% Males2.6% FemalesUnemployment rate for two or more race residents 2.4% Males2.6% FemalesUnemployment rate for Hispanic or Latino residents 3.4% Males4.1% Females
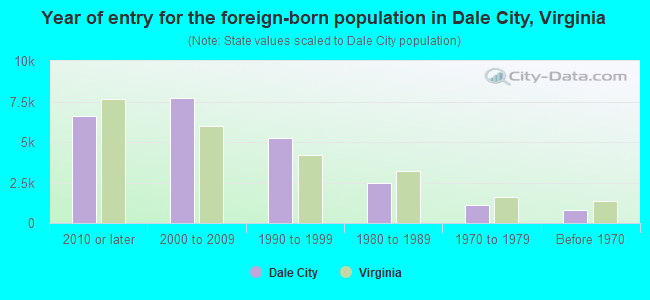
Year of entry for the foreign-born population in Dale City, Virginia
6,626 2010 or later 7,745 2000 to 2009 5,240 1990 to 1999 2,472 1980 to 1989 1,108 1970 to 1979 791 Before 1970
First ancestries reported:
American: 1,931 (4.6%)
English: 1,480 (3.5%)
Ghanaian: 1,206 (2.8%)
German: 781 (1.8%)
Afghan: 762 (1.8%)
Ethiopian: 709 (1.7%)
Italian: 680 (1.6%)
Irish: 679 (1.6%)
European: 539 (1.3%)
African: 519 (1.2%)
Nigerian: 383 (0.9%)
Sierra Leonean: 363 (0.9%)
Sudanese: 327 (0.8%)
Trinidadian and Tobagonian: 244 (0.6%)
Welsh: 240 (0.6%)
Egyptian: 226 (0.5%)
Jamaican: 193 (0.5%)
Polish: 160 (0.4%)
Romanian: 137 (0.3%)
Northern European: 115 (0.3%)
French: 113 (0.3%)
U.S. Virgin Islander: 109 (0.3%)
Portuguese: 107 (0.3%)
Moroccan: 99 (0.2%)
British: 82 (0.2%)
Iraqi: 79 (0.2%)
Scottish: 72 (0.2%)
Somali: 66 (0.2%)
Norwegian: 61 (0.1%)
French Canadian: 54 (0.1%)
Scotch-Irish: 49 (0.1%)
Dutch: 49 (0.1%)
Brazilian: 48 (0.1%)
Haitian: 47 (0.1%)
Iranian: 43 (0.1%)
Russian: 35 (0.08%)
Scandinavian: 34 (0.08%)
Palestinian: 31 (0.07%)
Bulgarian: 29 (0.07%)
Turkish: 29 (0.07%)
Hungarian: 26 (0.06%)
Liberian: 25 (0.06%)
Guyanese: 16 (0.04%)
Swiss: 16 (0.04%)
Slovak: 15 (0.04%)
Syrian: 14 (0.03%)
Danish: 13 (0.03%)
Eastern European: 9 (0.02%)
Canadian: 9 (0.02%)
Yugoslavian: 8 (0.02%)
Czechoslovakian: 7 (0.02%)
Barbadian: 7 (0.02%)
Swedish: 6 (0.01%)
Macedonian: 3 (0.01%)
Arab: 3 (0.01%)
West Indian: 3 (0.01%)
Most common places of birth for foreign-born residents (%): El Salvador Dale City:
26.3% (6,507)Virginia:
9.9% (107,534)
Afghanistan Dale City:
6.5% (1,615)Virginia:
1.8% (19,426)
Honduras Dale City:
5.2% (1,286)Virginia:
3.0% (32,892)
Ghana Dale City:
5.0% (1,231)Virginia:
1.6% (17,346)
Philippines Dale City:
4.7% (1,153)Virginia:
4.8% (52,629)
Bolivia Dale City:
4.7% (1,150)Virginia:
2.4% (25,722)
Peru Dale City:
4.6% (1,137)Virginia:
2.4% (26,366)
Pakistan Dale City:
4.4% (1,091)Virginia:
2.3% (24,582)
Mexico Dale City:
4.2% (1,031)Virginia:
5.3% (57,498)
Vietnam Dale City:
2.8% (690)Virginia:
4.2% (45,750)
Sierra Leone Dale City:
2.8% (680)Virginia:
0.6% (6,458)
Korea Dale City:
2.7% (679)Virginia:
4.9% (52,857)
Ethiopia Dale City:
2.1% (526)Virginia:
2.9% (32,082)
Guatemala Dale City:
2.0% (483)Virginia:
3.3% (35,938)
Sudan Dale City:
1.7% (410)Virginia:
0.4% (4,442)
Place of birth for U.S.-born residents:
This state: 25,430Other state: 18,446Northeast: 5,836Midwest: 2,976South: 7,371West: 2,263 90.3% of Dale City residents lived in the same house 1 years ago.
Out of people who lived in different houses, 30.5% lived in this county.
Out of people who lived in different counties, 64.8% lived in Virginia.
Dale City:
90.3%State average:
86.6%
Education attainment for males 25 years and older:
No schooling: 1,512Nursery to 4th grade: 4415th and 6th grade: 3507th and 8th grade: 4769th grade: 59510th grade: 011th grade: 5912th grade, no diploma: 617High school graduate (or equivalency): 6,984Less than 1 year of college: 1,672Some college more than 1 year, no degree: 1,462Associate degree: 1,142Bachelor's degree: 4,145Master's degree: 2,291Professional school degree: 123Doctorate degree: 319
Education attainment for females 25 years and older:
No schooling: 1,336Nursery to 4th grade: 4415th and 6th grade: 6057th and 8th grade: 3279th grade: 47110th grade: 27411th grade: 8612th grade, no diploma: 372High school graduate (or equivalency): 4,966Less than 1 year of college: 1,104Some college more than 1 year, no degree: 2,117Associate degree: 2,071Bachelor's degree: 3,669Master's degree: 2,370Professional school degree: 570Doctorate degree: 37
Housing units in structures:
One, detached: 14,718One, attached: 5,521Two: 713 or 4: 1705 to 9: 15210 to 19: 1,61120 to 49: 13850 or more: 299Mobile homes: 66Housing units lacking complete plumbing facilities in 2022: 1.7%Housing units lacking complete kitchen facilities in 2022: 0.9%House/condo owner moved in on average 12 years ago
Renter moved in on average 3 years ago
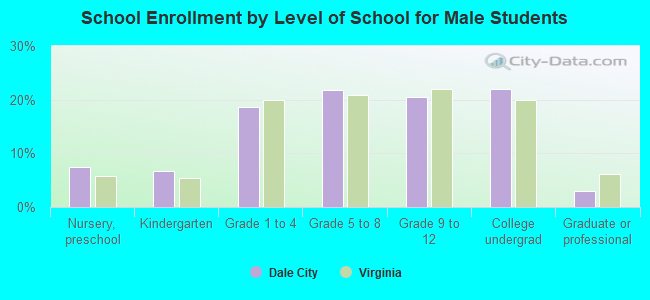
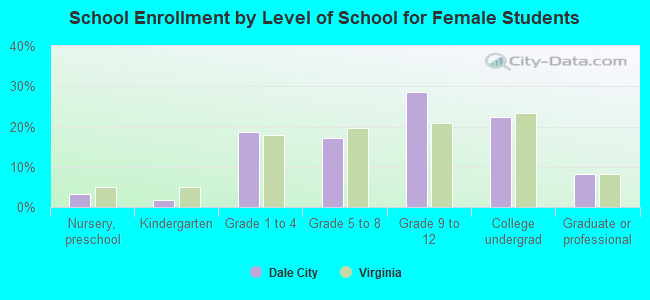
Private vs. public school enrollment:
Students in private schools in grades 1 to 8 (elementary and middle school): 488 Students in private schools in grades 9 to 12 (high school): 167 Students in private undergraduate colleges: 487