Coral Springs, FL (Florida) Houses and Residents
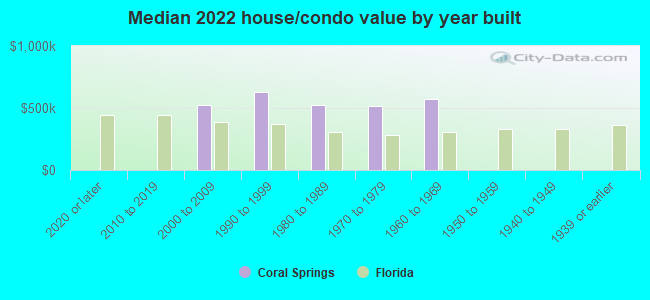
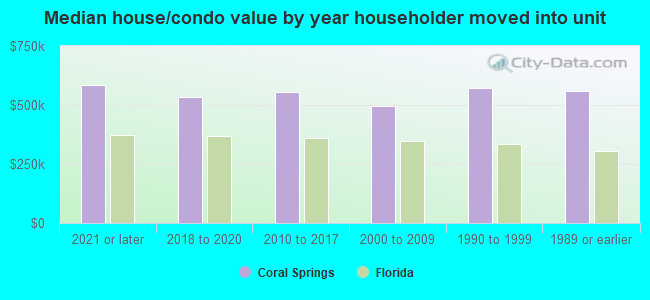
Estimated median house or condo value in 2022: $548,800 (it was $166,000 in 2000 )
Coral Springs:
$548,800Florida:
$354,100
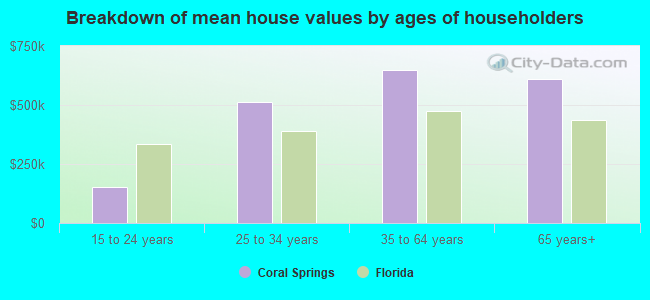
Lower value quartile - upper value quartile: $369,400 - $709,700Mean price in 2022: Detached houses: $680,942 Here:
$680,942State:
$500,941
Townhouses or other attached units: $373,966 Here:
$373,966State:
$370,869
In 2-unit structures: $1,662,502 Here:
$1,662,502State:
$423,188
In 3-to-4-unit structures: $266,378 Here:
$266,378State:
$309,944
In 5-or-more-unit structures: $222,439 Here:
$222,439State:
$447,145
Mobile homes: $399,444 Here:
$399,444State:
$113,202
Total population: 127,952 (Urban population: 117,482, Rural population: 0)
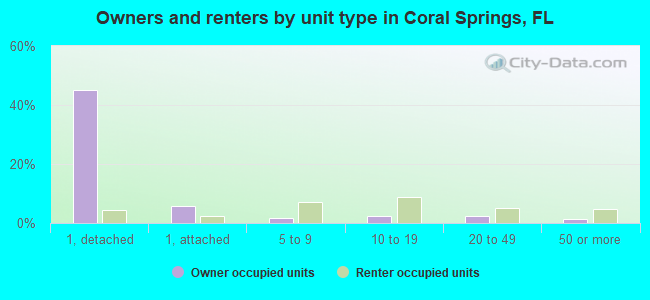
Houses: 46,470 (44,755 occupied: 23,517 owner occupied, 21,238 renter occupied )
% of renters here:
47%State:
33%
Housing density: 1,944 houses/condos per square mile
Median price asked for vacant for-sale houses and condos in 2022: $411,655.
Median contract rent in 2022: $1,752 (lower quartile is $1,448, upper quartile is over $2,000)
Median rent asked for vacant for-rent units in 2022: $1,978
Median gross rent in Coral Springs, FL in 2022: $1,882
Housing units in Coral Springs with a mortgage: 15,626 (1,907 second mortgage, 29 home equity loan, 1,671 both second mortgage and home equity loan )Houses without a mortgage: 465
Median household income for houses/condos with a mortgage: $121,956
Median household income for apartments without a mortgage: $67,062
Median monthly housing costs: $1,903
Data:
Median house or condo value ($)
Median house or condo value ($ change since 2000)
Median house or condo value ($) - White
Median house or condo value ($) - Black or African American
Median house or condo value ($) - Asian
Median house or condo value ($) - Hispanic or Latino
Median house or condo value ($) - American Indian and Alaska Native
Median house or condo value ($) - Multirace
Median house or condo value ($) - Other Race
Median price asked for mobile homes ($)
Household density (households per square mile)
Mean house or condo value by units in structure - 1, detached ($)
Mean house or condo value by units in structure - 1, attached ($)
Mean house or condo value by units in structure - 2 ($)
Mean house or condo value by units in structure by units in structure - 3 or 4 ($)
Mean house or condo value by units in structure - 5 or more ($)
Mean house or condo value by units in structure - Boat, RV, van, etc. ($)
Mean house or condo value by units in structure - Mobile home ($)
Median contract rent ($)
Median contract rent - Lower quartile ($)
Median contract rent - Upper quartile ($)
Median gross rent ($)
Urban houses (%)
Rural houses (%)
Houses occupied (%)
Houses occupied (% change since 2000)
Houses owner occupied (%)
Houses owner occupied (% change since 2000)
Houses renter occupied (%)
Houses renter occupied (% change since 2000)
Vacant housing units - For rent (%)
Vacant housing units - For rent (% change since 2000)
Vacant housing units - For sale only (%)
Vacant housing units - For sale only (% change since 2000)
Vacant housing units - Rented or sold, not occupied (%)
Vacant housing units - Rented or sold, not occupied (% change since 2000)
Vacant housing units - For seasonal, recreational, or occasional use (%)
Vacant housing units - For seasonal, recreational, or occasional use (% change since 2000)
Vacant housing units - For migrant workers (%)
Vacant housing units - For migrant workers (% change since 2000)
Vacant housing units - Other vacant (%)
Vacant housing units - Other vacant (% change since 2000)
Median monthly housing costs ($)
Median household income for houses/condos with a mortgage ($)
Median household income for houses/condos without a mortgage ($)
Median household income ($)
Median household income ($) - White
Median household income ($) - Black or African American
Median household income ($) - Asian
Median household income ($) - Hispanic or Latino
Median household income ($) - American Indian and Alaska Native
Median household income ($) - Multirace
Median household income ($) - Other Race
Mortgage status - with mortgage (%)
Mortgage status - with second mortgage (%)
Mortgage status - with home equity loan (%)
Mortgage status - with both second mortgage and home equity loan (%)
Mortgage status - without a mortgage (%)
Median year house/condo built
Median year apartment built
Household type by relationship - Male householder living alone (%)
Household type by relationship - Male householder not living alone (%)
Household type by relationship - Female householder living alone (%)
Household type by relationship - Female householder not living alone (%)
Household type by relationship - Opposite-Sex spouse (%)
Household type by relationship - Same-Sex spouse (%)
Household type by relationship - Opposite-Sex unmarried partner (%)
Household type by relationship - Same-Sex unmarried partner (%)
Household type by relationship - In group quarters (%)
Size of family households - 2-person household (%)
Size of family households - 3-person household (%)
Size of family households - 4-person household (%)
Size of family households - 5-person household (%)
Size of family households - 6-person household (%)
Size of family households - 7-or-more-person household (%)
Size of nonfamily households - 1-person household (%)
Size of nonfamily households - 2-person household (%)
Size of nonfamily households - 3-person household (%)
Size of nonfamily households - 4-person household (%)
Size of nonfamily households - 5-person household (%)
Size of nonfamily households - 6-person household (%)
Size of nonfamily households - 7-or-moreperson household (%)
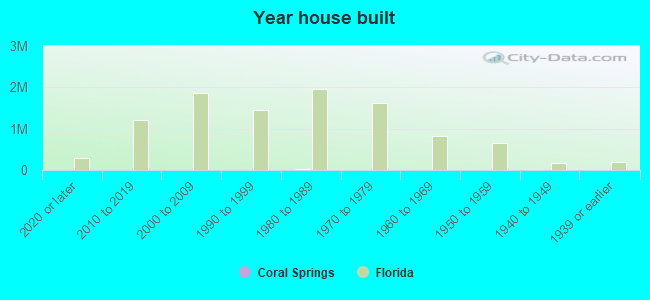
Year house built - Built 2010 or later (%)
Year house built - Built 2000 to 2009 (%)
Year house built - Built 1990 to 1999 (%)
Year house built - Built 1980 to 1989 (%)
Year house built - Built 1970 to 1979 (%)
Year house built - Built 1960 to 1969 (%)
Year house built - Built 1950 to 1959 (%)
Year house built - Built 1940 to 1949 (%)
Year house built - Built 1939 or earlier (%)
Median number of rooms in houses and condos
Median number of rooms in apartments
Median number of bedrooms in owner occupied houses
Mean number of bedrooms in owner occupied houses
Median number of bedrooms in renter occupied houses
Mean number of bedrooms in renter occupied houses
Median number of vehichles in owner occupied houses
Mean number of vehichles in owner occupied houses
Median number of vehichles in renter occupied houses
Mean number of vehichles in renter occupied houses
Rooms in owner-occupied houses - 1 room (%)
Rooms in owner-occupied houses - 2 rooms (%)
Rooms in owner-occupied houses - 3 rooms (%)
Rooms in owner-occupied houses - 4 rooms (%)
Rooms in owner-occupied houses - 5 rooms (%)
Rooms in owner-occupied houses - 6 rooms (%)
Rooms in owner-occupied houses - 7 rooms (%)
Rooms in owner-occupied houses - 8 rooms (%)
Rooms in owner-occupied houses - 9+ rooms (%)
Rooms in renter-occupied houses - 1 room (%)
Rooms in renter-occupied houses - 2 rooms (%)
Rooms in renter-occupied houses - 3 rooms (%)
Rooms in renter-occupied houses - 4 rooms (%)
Rooms in renter-occupied houses - 5 rooms (%)
Rooms in renter-occupied houses - 6 rooms (%)
Rooms in renter-occupied houses - 7 rooms (%)
Rooms in renter-occupied houses - 8 rooms (%)
Rooms in renter-occupied houses - 9+ rooms (%)
Bedrooms in owner-occupied houses - no bedrooms (%)
Bedrooms in owner-occupied houses - 1 bedroom (%)
Bedrooms in owner-occupied houses - 2 bedrooms (%)
Bedrooms in owner-occupied houses - 3 bedrooms (%)
Bedrooms in owner-occupied houses - 4 bedrooms (%)
Bedrooms in owner-occupied houses - 5+ bedrooms (%)
Bedrooms in renter-occupied houses - no bedrooms (%)
Bedrooms in renter-occupied houses - 1 bedroom (%)
Bedrooms in renter-occupied houses - 2 bedrooms (%)
Bedrooms in renter-occupied houses - 3 bedrooms (%)
Bedrooms in renter-occupied houses - 4 bedrooms (%)
Bedrooms in renter-occupied houses - 5+ bedrooms (%)
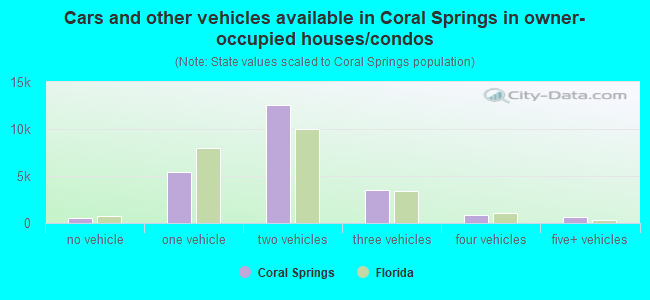
Vehicles available in owner-occupied houses - no vehicle available (%)
Vehicles available in owner-occupied houses - 1 vehicle available(%)
Vehicles available in owner-occupied houses - 2 Vehicles available (%)
Vehicles available in owner-occupied houses - 3 Vehicles available (%)
Vehicles available in owner-occupied houses - 4 Vehicles available (%)
Vehicles available in owner-occupied houses - 5+ Vehicles available (%)
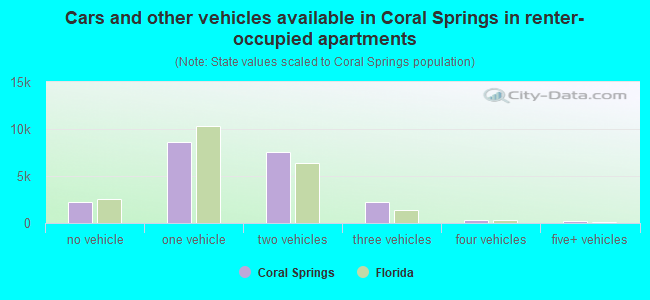
Vehicles available in renter-occupied houses - no vehicle available (%)
Vehicles available in renter-occupied houses - 1 vehicle available (%)
Vehicles available in renter-occupied houses - 2 Vehicles available (%)
Vehicles available in renter-occupied houses - 3 Vehicles available (%)
Vehicles available in renter-occupied houses - 4 Vehicles available (%)
Vehicles available in renter-occupied houses - 5+ Vehicles available (%)
Housing units in structures - 1, detached (%)
Housing units in structures - 1, attached (%)
Housing units in structures - 2 (%)
Housing units in structures - 3 or 4 (%)
Housing units in structures - 5 to 9 (%)
Housing units in structures - 10 to 19 (%)
Housing units in structures - 20 to 49 (%)
Housing units in structures - 50 or more (%)
Housing units in structures - Mobile home (%)
Housing units in structures - Boat, RV, van, etc. (%)
Housing units in structures - Owners - 1, detached (%)
Housing units in structures - Owners - 1, attached (%)
Housing units in structures - Owners - 2 (%)
Housing units in structures - Owners - 3 or 4 (%)
Housing units in structures - Owners - 5 to 9 (%)
Housing units in structures - Owners - 10 to 19 (%)
Housing units in structures - Owners - 20 to 49 (%)
Housing units in structures - Owners - 50 or more (%)
Housing units in structures - Owners - Mobile home (%)
Housing units in structures - Owners - Boat, RV, van, etc. (%)
Housing units in structures - Renters - 1, detached (%)
Housing units in structures - Renters - 1, attached (%)
Housing units in structures - Renters - 2 (%)
Housing units in structures - Renters - 3 or 4 (%)
Housing units in structures - Renters - 5 to 9 (%)
Housing units in structures - Renters - 10 to 19 (%)
Housing units in structures - Renters - 20 to 49 (%)
Housing units in structures - Renters - 50 or more (%)
Housing units in structures - Renters - Mobile home (%)
Housing units in structures - Renters - Boat, RV, van, etc. (%)
House/condo owner moved in on average (years ago)
Renter moved in on average (years ago)
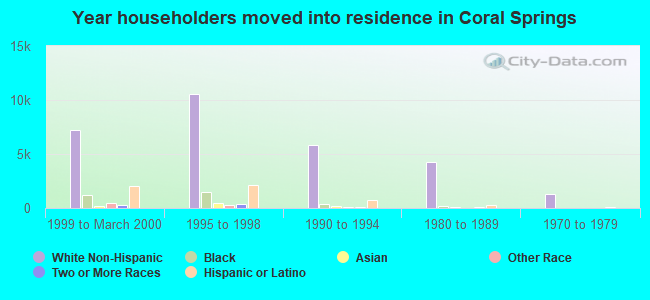
Year householder moved into unit - Moved in 1999 to March 2000 (%)
Year householder moved into unit - Moved in 1999 to March 2000 (%) - White
Year householder moved into unit - Moved in 1999 to March 2000 (%) - Black or African American
Year householder moved into unit - Moved in 1999 to March 2000 (%) - Asian
Year householder moved into unit - Moved in 1999 to March 2000 (%) - Hispanic or Latino
Year householder moved into unit - Moved in 1999 to March 2000 (%) - American Indian and Alaska Native
Year householder moved into unit - Moved in 1999 to March 2000 (%) - Multirace
Year householder moved into unit - Moved in 1999 to March 2000 (%) - Other Race
Year householder moved into unit - Moved in 1995 to 1998 (%)
Year householder moved into unit - Moved in 1995 to 1998 (%) - White
Year householder moved into unit - Moved in 1995 to 1998 (%) - Black or African American
Year householder moved into unit - Moved in 1995 to 1998 (%) - Asian
Year householder moved into unit - Moved in 1995 to 1998 (%) - Hispanic or Latino
Year householder moved into unit - Moved in 1995 to 1998 (%) - American Indian and Alaska Native
Year householder moved into unit - Moved in 1995 to 1998 (%) - Multirace
Year householder moved into unit - Moved in 1995 to 1998 (%) - Other Race
Year householder moved into unit - Moved in 1990 to 1994 (%)
Year householder moved into unit - Moved in 1990 to 1994 (%) - White
Year householder moved into unit - Moved in 1990 to 1994 (%) - Black or African American
Year householder moved into unit - Moved in 1990 to 1994 (%) - Asian
Year householder moved into unit - Moved in 1990 to 1994 (%) - Hispanic or Latino
Year householder moved into unit - Moved in 1990 to 1994 (%) - American Indian and Alaska Native
Year householder moved into unit - Moved in 1990 to 1994 (%) - Multirace
Year householder moved into unit - Moved in 1990 to 1994 (%) - Other Race
Year householder moved into unit - Moved in 1980 to 1989 (%)
Year householder moved into unit - Moved in 1980 to 1989 (%) - White
Year householder moved into unit - Moved in 1980 to 1989 (%) - Black or African American
Year householder moved into unit - Moved in 1980 to 1989 (%) - Asian
Year householder moved into unit - Moved in 1980 to 1989 (%) - Hispanic or Latino
Year householder moved into unit - Moved in 1980 to 1989 (%) - American Indian and Alaska Native
Year householder moved into unit - Moved in 1980 to 1989 (%) - Multirace
Year householder moved into unit - Moved in 1980 to 1989 (%) - Other Race
Year householder moved into unit - Moved in 1970 to 1979 (%)
Year householder moved into unit - Moved in 1970 to 1979 (%) - White
Year householder moved into unit - Moved in 1970 to 1979 (%) - Black or African American
Year householder moved into unit - Moved in 1970 to 1979 (%) - Asian
Year householder moved into unit - Moved in 1970 to 1979 (%) - Hispanic or Latino
Year householder moved into unit - Moved in 1970 to 1979 (%) - American Indian and Alaska Native
Year householder moved into unit - Moved in 1970 to 1979 (%) - Multirace
Year householder moved into unit - Moved in 1970 to 1979 (%) - Other Race
Year householder moved into unit - Moved in 1969 or earlier (%)
Year householder moved into unit - Moved in 1969 or earlier (%) - White
Year householder moved into unit - Moved in 1969 or earlier (%) - Black or African American
Year householder moved into unit - Moved in 1969 or earlier (%) - Asian
Year householder moved into unit - Moved in 1969 or earlier (%) - Hispanic or Latino
Year householder moved into unit - Moved in 1969 or earlier (%) - American Indian and Alaska Native
Year householder moved into unit - Moved in 1969 or earlier (%) - Multirace
Year householder moved into unit - Moved in 1969 or earlier (%) - Other Race
Housing units lacking complete plumbing facilities (%)
Housing units lacking complete kitchen facilities (%)
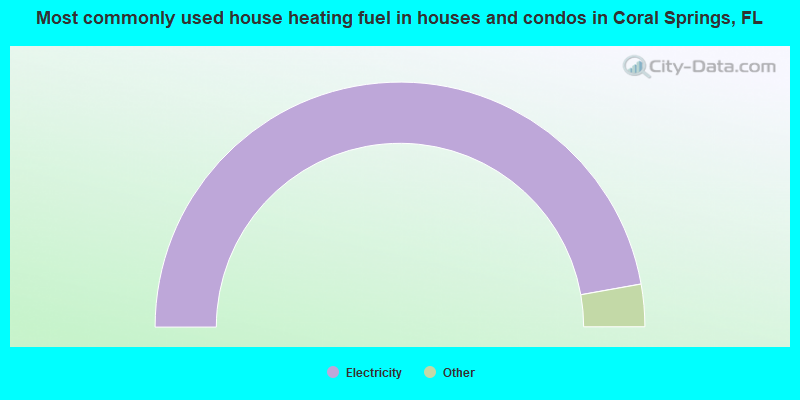
House heating fuel used in houses and condos - Utility gas (%)
House heating fuel used in houses and condos - Bottled, tank, or LP gas (%)
House heating fuel used in houses and condos - Electricity (%)
House heating fuel used in houses and condos - Fuel oil, kerosene, etc. (%)
House heating fuel used in houses and condos - Coal or coke (%)
House heating fuel used in houses and condos - Wood (%)
House heating fuel used in houses and condos - Solar energy (%)
House heating fuel used in houses and condos - Other fuel (%)
House heating fuel used in houses and condos - No fuel used (%)
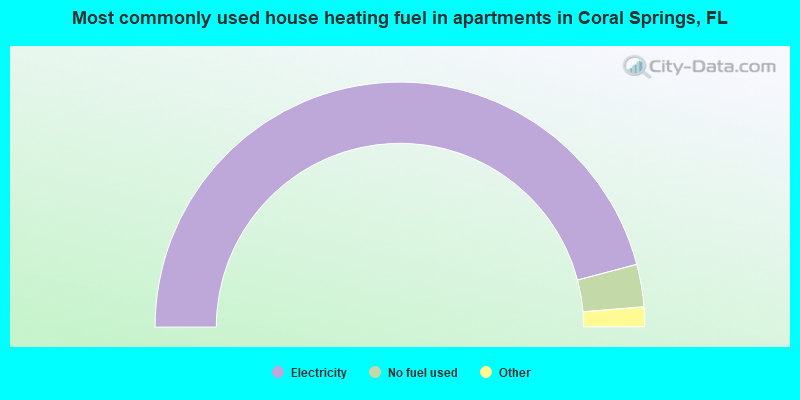
House heating fuel used in apartments - Utility gas (%)
House heating fuel used in apartments - Bottled, tank, or LP gas (%)
House heating fuel used in apartments - Electricity (%)
House heating fuel used in apartments - Fuel oil, kerosene, etc. (%)
House heating fuel used in apartments - Coal or coke (%)
House heating fuel used in apartments - Wood (%)
House heating fuel used in apartments - Solar energy (%)
House heating fuel used in apartments - Other fuel (%)
House heating fuel used in apartments - No fuel used (%)
Median year house/condo built: 1986Median year apartment built: 1989Household type by relationship:
Households: 133,365
Male householders: 19,613 (2,328 living alone ), Female householders: 25,142 (4,111 living alone )25,265 spouses (25,091 opposite-sex spouses ), 2,735 unmarried partners , (2,675 opposite-sex unmarried partners ), 44,549 children (42,164 natural , 866 adopted , 1,519 stepchildren ), 3,557 grandchildren , 2,794 brothers or sisters , 4,371 parents , 236 foster children , 2,745 other relatives , 2,120 non-relatives In group quarters: 238
Size of family households: 12,465 2-persons , 10,154 3-persons , 7,554 4-persons , 2,695 5-persons , 1,744 6-persons , 642 7-or-more-persons .
Size of nonfamily households: 6,439 1-person , 3,062 2-persons .
23,529 married couples with children. single-parent households (1,386 men , 6,817 women ).
62.4% of residents of Coral Springs speak English at home. of residents speak Spanish at home (62% speak English very well , 19% speak English well , 13% speak English not well , 6% don't speak English at all ).of residents speak other Indo-European language at home (69% speak English very well , 21% speak English well , 8% speak English not well , 2% don't speak English at all ).of residents speak Asian or Pacific Island language at home (53% speak English very well , 24% speak English well , 18% speak English not well , 5% don't speak English at all ).of residents speak other language at home (83% speak English very well , 16% speak English well , 1% speak English not well ).
Foreign born population: 47,843 (35.9%)of them are naturalized citizens )
Median number of rooms in houses and condos:
Median number of rooms in apartments
Owner-occupied Renter-occupied
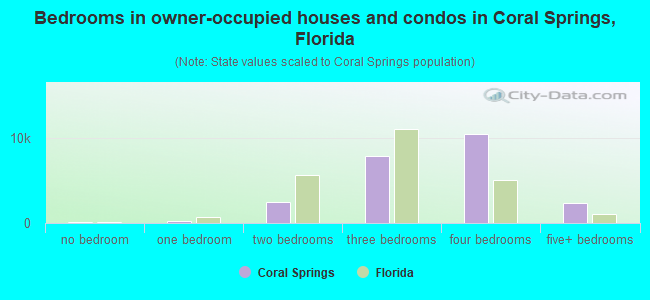
Bedrooms in owner-occupied houses and condos in Coral Springs, Florida
92 no bedroom 237 1 bedroom 2,419 2 bedrooms 7,892 3 bedrooms 10,492 4 bedrooms 2,385 5+ bedrooms
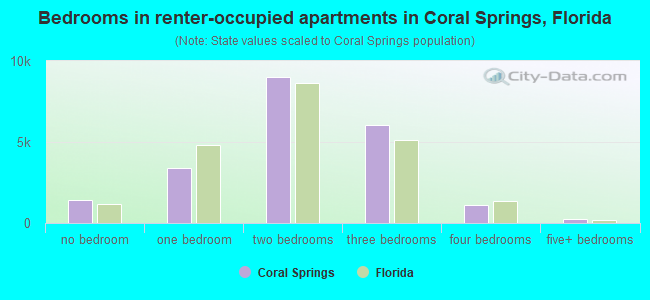
Bedrooms in renter-occupied apartments in Coral Springs, Florida
1,421 no bedroom 3,371 1 bedroom 9,032 2 bedrooms 6,058 3 bedrooms 1,098 4 bedrooms 258 5+ bedrooms
Owner-occupied Renter-occupied
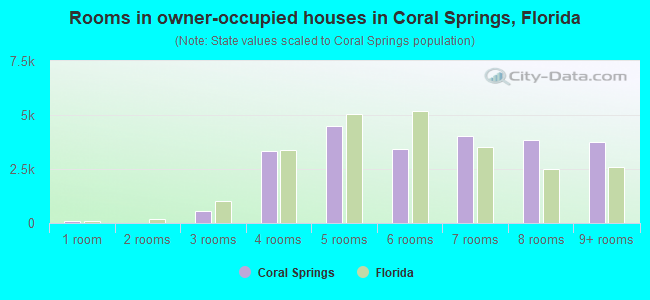
Rooms in owner-occupied houses in Coral Springs, Florida
92 1 room 0 2 rooms 535 3 rooms 3,329 4 rooms 4,500 5 rooms 3,427 6 rooms 4,044 7 rooms 3,848 8 rooms 3,742 9+ rooms
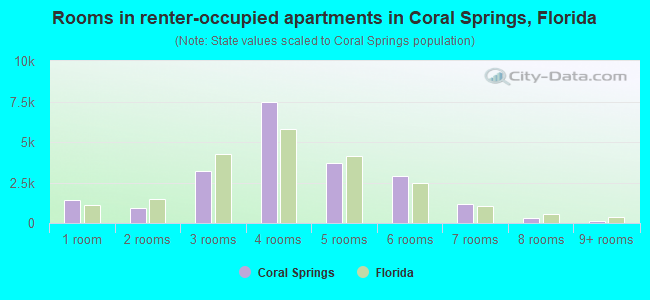
Rooms in renter-occupied apartments in Coral Springs, Florida
1,421 1 room 935 2 rooms 3,215 3 rooms 7,446 4 rooms 3,711 5 rooms 2,878 6 rooms 1,160 7 rooms 320 8 rooms 152 9+ rooms
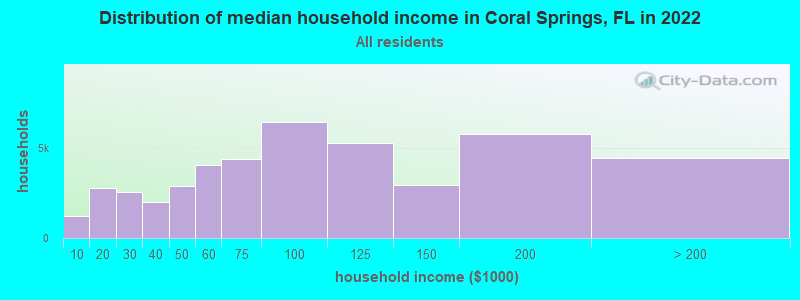
Coral Springs, FL household income distribution 1,202 Less than $10,0002,792 $10,000 to $19,9992,548 $20,000 to $29,9991,999 $30,000 to $39,9992,900 $40,000 to $49,9994,065 $50,000 to $59,9994,370 $60,000 to $74,9996,439 $75,000 to $99,9995,267 $100,000 to $124,9992,965 $125,000 to $149,9995,785 $150,000 to $199,9994,423 $200,000 or more
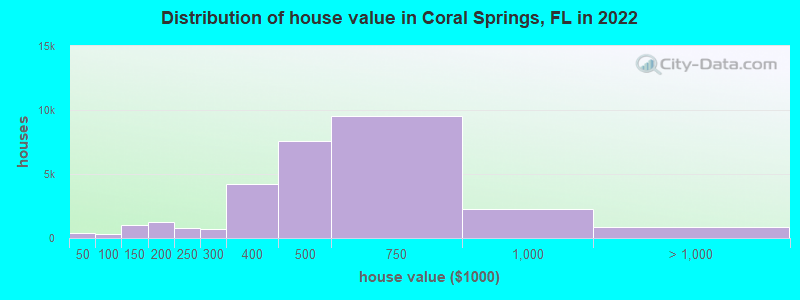
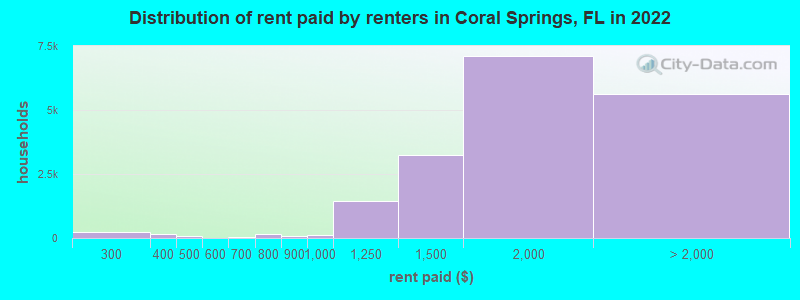
Home value of owner - occupied houses in 2022 in Coral Springs, FL 155 Less than $10,0005 $10,000 to $14,99910 $15,000 to $19,99918 $20,000 to $24,99933 $25,000 to $29,99925 $30,000 to $34,99934 $35,000 to $39,999126 $40,000 to $49,99922 $50,000 to $59,9995 $60,000 to $69,99950 $70,000 to $79,99927 $80,000 to $89,99943 $90,000 to $99,999369 $100,000 to $124,999607 $125,000 to $149,999619 $150,000 to $174,999665 $175,000 to $199,999781 $200,000 to $249,999699 $250,000 to $299,9994,244 $300,000 to $399,9997,571 $400,000 to $499,9999,556 $500,000 to $749,9992,276 $750,000 to $999,999631 $1,000,000 to $1,499,99934 $1,500,000 to $1,999,999167 $2,000,000 or moreRent paid by renters in 2022 in Coral Springs, FL 35 Less than $10055 $150 to $19934 $200 to $249180 $250 to $29961 $300 to $34995 $350 to $39955 $400 to $4495 $450 to $49919 $500 to $54910 $600 to $64919 $650 to $699135 $700 to $74917 $750 to $79996 $800 to $899120 $900 to $9991,447 $1,000 to $1,2493,239 $1,250 to $1,4997,097 $1,500 to $1,9993,314 $2,000 to $2,4991,253 $2,500 to $2,999682 $3,000 to $3,499182 $3,500 or more191 No cash rent
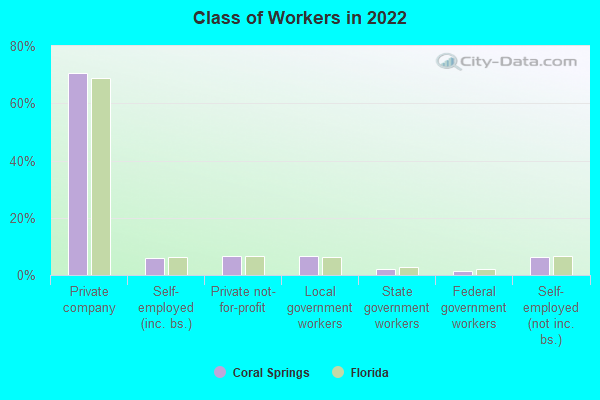
Percentage of workers working in this county: 81.2%Number of people working at home: 10,658 (15.6% of all workers )
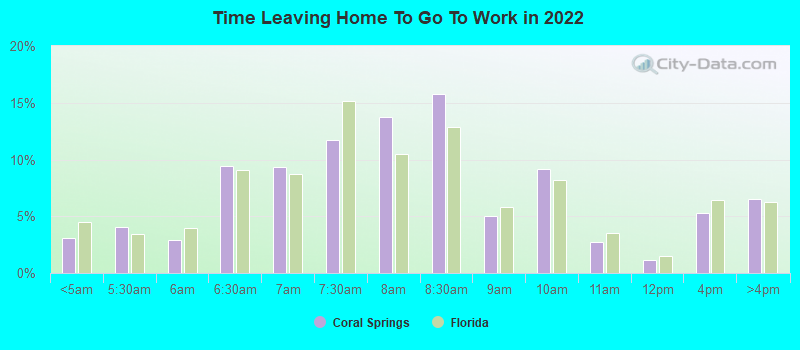
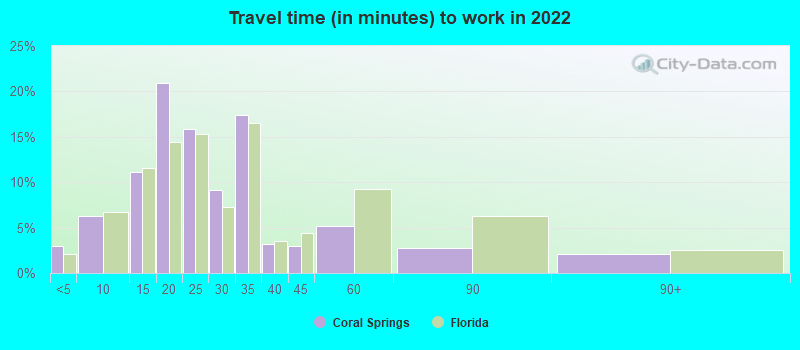
Travel time to work (commute)
Less than 5 minutes: 1,5605 to 9 minutes: 2,22010 to 14 minutes: 5,16415 to 19 minutes: 8,72420 to 24 minutes: 5,74525 to 29 minutes: 3,72230 to 34 minutes: 10,10635 to 39 minutes: 2,71640 to 44 minutes: 3,28145 to 59 minutes: 4,44860 to 89 minutes: 3,96390 or more minutes: 1,610
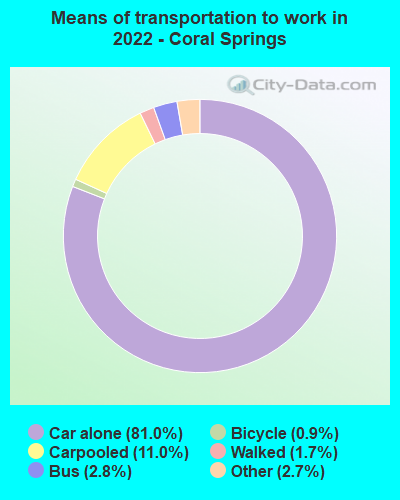
Means of transportation to work:
Drove a car alone: 29,040 (62.7%)Carpooled: 4,491 (9.7%)Bus : 1,076 (2.3%)Taxi: 1,027 (2.2%)Bicycle: 373 (0.8%)Walked: 698 (1.5%)Worked at home: 10,658 (23.0%)
Unemployment by race in 2022
Unemployment rate for White non-Hispanic residents 3.3% Males1.9% FemalesUnemployment rate for Black residents 11.3% Males7.5% FemalesUnemployment rate for Asian residents 1.6% Males2.6% FemalesUnemployment rate for other race residents 7.4% Males3.5% FemalesUnemployment rate for two or more race residents 1.0% Males2.5% FemalesUnemployment rate for Hispanic or Latino residents 5.6% Males0.9% Females
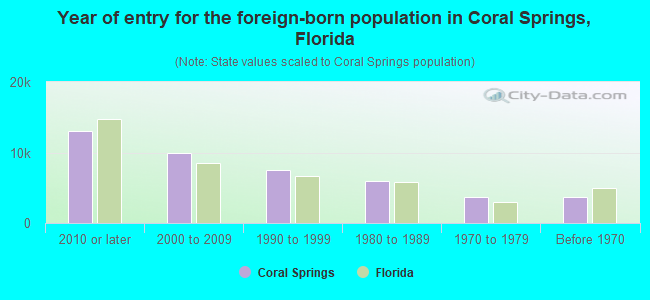
Year of entry for the foreign-born population in Coral Springs, Florida
12,988 2010 or later 9,950 2000 to 2009 7,522 1990 to 1999 5,921 1980 to 1989 3,713 1970 to 1979 3,647 Before 1970
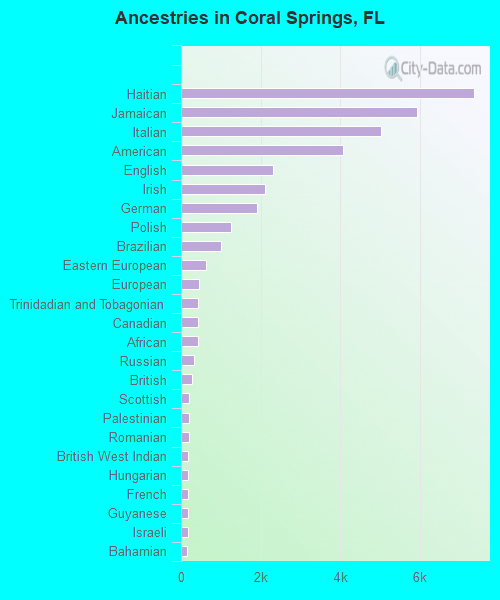
First ancestries reported:
Haitian: 7,372 (9.3%)
Jamaican: 5,927 (7.5%)
Italian: 5,031 (6.3%)
American: 4,082 (5.1%)
English: 2,305 (2.9%)
Irish: 2,105 (2.7%)
German: 1,906 (2.4%)
Polish: 1,254 (1.6%)
Brazilian: 1,006 (1.3%)
Eastern European: 620 (0.8%)
European: 454 (0.6%)
Trinidadian and Tobagonian: 439 (0.6%)
Canadian: 424 (0.5%)
African: 415 (0.5%)
Russian: 321 (0.4%)
British: 264 (0.3%)
Scottish: 209 (0.3%)
Palestinian: 198 (0.2%)
Romanian: 197 (0.2%)
British West Indian: 186 (0.2%)
Hungarian: 175 (0.2%)
French: 173 (0.2%)
Guyanese: 165 (0.2%)
Israeli: 164 (0.2%)
Bahamian: 154 (0.2%)
Egyptian: 151 (0.2%)
Greek: 151 (0.2%)
Ukrainian: 150 (0.2%)
Dutch: 137 (0.2%)
Austrian: 129 (0.2%)
Iranian: 125 (0.2%)
Scandinavian: 123 (0.2%)
Portuguese: 116 (0.1%)
Nigerian: 115 (0.1%)
Lebanese: 95 (0.1%)
Scotch-Irish: 94 (0.1%)
Swedish: 92 (0.1%)
West Indian: 74 (0.09%)
French Canadian: 67 (0.08%)
Belgian: 61 (0.08%)
Finnish: 54 (0.07%)
Northern European: 51 (0.06%)
South African: 47 (0.06%)
Barbadian: 43 (0.05%)
Belizean: 43 (0.05%)
Lithuanian: 38 (0.05%)
Ghanaian: 35 (0.04%)
Danish: 35 (0.04%)
Norwegian: 30 (0.04%)
Welsh: 29 (0.04%)
Czech: 27 (0.03%)
Armenian: 27 (0.03%)
Turkish: 24 (0.03%)
Czechoslovakian: 23 (0.03%)
Syrian: 21 (0.03%)
Arab: 19 (0.02%)
Bulgarian: 18 (0.02%)
Moroccan: 17 (0.02%)
Swiss: 17 (0.02%)
Zimbabwean: 16 (0.02%)
Slovak: 14 (0.02%)
Most common places of birth for foreign-born residents (%): Jamaica Coral Springs:
12.4% (5,380)Florida:
5.0% (227,319)
Colombia Coral Springs:
12.2% (5,263)Florida:
6.5% (298,669)
Haiti Coral Springs:
12.1% (5,250)Florida:
7.5% (342,375)
Venezuela Coral Springs:
8.7% (3,787)Florida:
5.7% (262,042)
Peru Coral Springs:
6.4% (2,754)Florida:
2.1% (96,693)
India Coral Springs:
5.0% (2,167)Florida:
2.1% (94,349)
Brazil Coral Springs:
3.8% (1,660)Florida:
2.7% (122,906)
Dominican Republic Coral Springs:
3.4% (1,484)Florida:
3.0% (137,727)
Cuba Coral Springs:
3.1% (1,349)Florida:
22.0% (1,006,576)
Mexico Coral Springs:
2.7% (1,185)Florida:
5.6% (257,152)
Trinidad and Tobago Coral Springs:
2.7% (1,163)Florida:
1.0% (43,642)
China, excluding Hong Kong and Taiwan Coral Springs:
2.2% (963)Florida:
1.2% (56,071)
Canada Coral Springs:
2.2% (937)Florida:
2.4% (109,132)
Ecuador Coral Springs:
1.8% (778)Florida:
1.2% (54,585)
Honduras Coral Springs:
1.8% (762)Florida:
2.3% (107,160)
Place of birth for U.S.-born residents:
This state: 45,440Other state: 37,381Northeast: 22,322Midwest: 6,366South: 6,182West: 2,511 87.6% of Coral Springs residents lived in the same house 1 years ago.
Out of people who lived in different houses, 37.6% lived in this county.
Out of people who lived in different counties, 48.1% lived in Florida.
Coral Springs:
87.6%State average:
86.3%
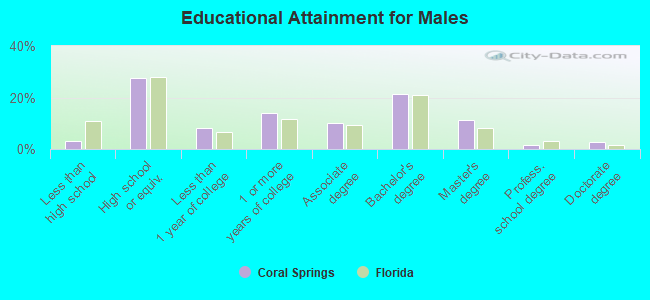
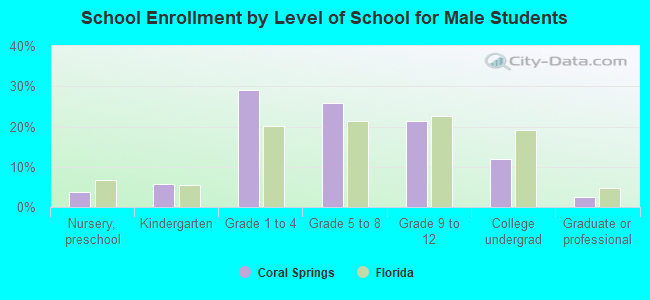
Education attainment for males 25 years and older:
No schooling: 568Nursery to 4th grade: 2265th and 6th grade: 457th and 8th grade: 09th grade: 4110th grade: 7511th grade: 15412th grade, no diploma: 116High school graduate (or equivalency): 11,087Less than 1 year of college: 3,284Some college more than 1 year, no degree: 5,565Associate degree: 4,109Bachelor's degree: 8,692Master's degree: 4,592Professional school degree: 660Doctorate degree: 1,127
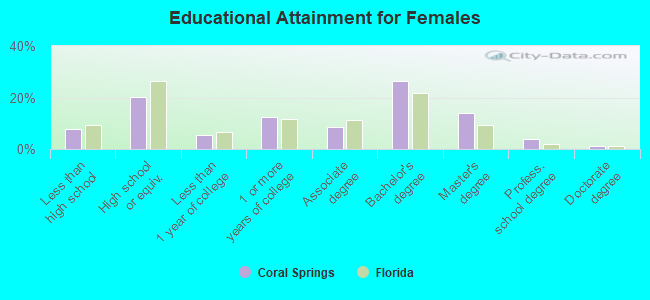
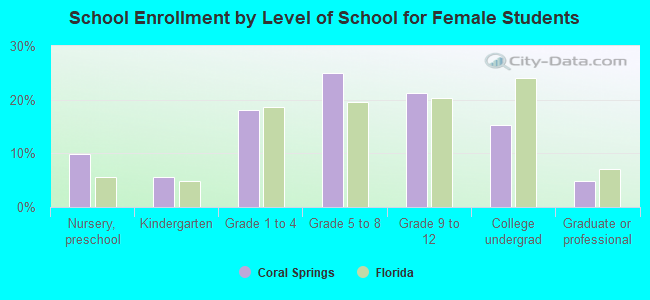
Education attainment for females 25 years and older:
No schooling: 970Nursery to 4th grade: 905th and 6th grade: 8897th and 8th grade: 4549th grade: 36610th grade: 40311th grade: 6012th grade, no diploma: 392High school graduate (or equivalency): 9,390Less than 1 year of college: 2,609Some college more than 1 year, no degree: 5,799Associate degree: 4,081Bachelor's degree: 12,368Master's degree: 6,613Professional school degree: 1,800Doctorate degree: 560
Housing units in structures:
One, detached: 20,630One, attached: 4,276Two: 1,0883 or 4: 3,1115 to 9: 4,59210 to 19: 4,92420 to 49: 3,90650 or more: 3,893Boats, RVs, vans, etc.: 50Housing units lacking complete plumbing facilities in 2022: 0.1%Housing units lacking complete kitchen facilities in 2022: 0.6%House/condo owner moved in on average 11 years ago
Renter moved in on average 2 years ago
Private vs. public school enrollment:
Students in private schools in grades 1 to 8 (elementary and middle school): 1,799 Students in private schools in grades 9 to 12 (high school): 1,039 Students in private undergraduate colleges: 1,668