Coldspring, TX (Texas) Houses and Residents
| Coldspring: | $213,146 |
| Texas: | $275,400 |
Mean price in 2022:
Detached houses: $272,480
Here: $272,480 State: $369,058 Mobile homes: $93,586
Here: $93,586 State: $124,413
Total population: 890 (Urban population: 0, Rural population: 749 (4 farm, 745 nonfarm))
Houses: 576 (502 occupied: 296 owner occupied, 213 renter occupied)
| % of renters here: | 42% |
| State: | 38% |
Housing density: 313 houses/condos per square mile
Median price asked for vacant for-sale houses and condos in 2022: $1,163,212.
Median contract rent in 2022: $622 (lower quartile is $357, upper quartile is $846)
Median rent asked for vacant for-rent units in 2022: $3,854
Median gross rent in Coldspring, TX in 2022: $772
Housing units in Coldspring with a mortgage: 116 (0 second mortgage, 0 home equity loan, 0 both second mortgage and home equity loan)
Houses without a mortgage: 0
Median household income for houses/condos with a mortgage: $79,144
Median household income for apartments without a mortgage: $48,311
Median monthly housing costs: $816
Compare current foreclosures near Coldspring, TX:
| Photo | Address | Area | Beds / Baths | Price | Details |
|---|---|---|---|---|---|

|
#1
Anthony Ln
Coldspring, TX 77331
|
1,600 sq. feet
|
3 baths 3 beds |
show details | |

|
#2
Dove Creek Dr
Coldspring, TX 77331
|
2,176 sq. feet
|
- baths - beds |
show details | |

|
#3
S Mcmurrey Rd
Coldspring, TX 77331
|
- sq. feet
|
- baths - beds |
show details | |

|
#4
Southwood Shores Dr
Coldspring, TX 77331
|
- sq. feet
|
- baths - beds |
show details | |

|
#5
Edgewater Dr
Livingston, TX 77351
|
2,510 sq. feet
|
2 baths 3 beds |
$149,900
|
show details |

|
#6
Alpine St
Coldspring, TX 77331
|
- sq. feet
|
- baths - beds |
show details | |

|
#7
Southwood Shores Dr
Coldspring, TX 77331
|
- sq. feet
|
- baths - beds |
show details | |

|
#8
Hypoint Cir
Coldspring, TX 77331
|
- sq. feet
|
- baths - beds |
show details | |

|
#9
Willow Crest Cir
Livingston, TX 77351
|
2,280 sq. feet
|
2 baths 4 beds |
show details | |

|
#10
E North St
Livingston, TX 77351
|
1,444 sq. feet
|
2 baths 3 beds |
show details |
| Photo | Address | Area | Beds / Baths | Price | Details |
|---|---|---|---|---|---|

|
#11
St Lucia Lane
Pointblank, TX 77364
|
1,680 sq. feet
|
2 baths 3 beds |
show details | |

|
#12
Cedar Lane Loop
Willis, TX 77378
|
1,990 sq. feet
|
2 baths 3 beds |
show details | |

|
#13
Water View Dr
Livingston, TX 77351
|
2,157 sq. feet
|
2 baths 3 beds |
show details | |

|
#14
Eagle Lk
Livingston, TX 77351
|
- sq. feet
|
- baths 2 beds |
show details | |

|
#15
Spring Gardens Dr
Oakhurst, TX 77359
|
2,686 sq. feet
|
2 baths 4 beds |
show details | |

|
#16
Everitt Rd
Cleveland, TX 77328
|
2,500 sq. feet
|
2 baths 3 beds |
show details | |

|
#17
Lakeview Dr
Shepherd, TX 77371
|
1,993 sq. feet
|
2 baths 3 beds |
show details | |

|
#18
Mustang Rd
Cleveland, TX 77328
|
1,200 sq. feet
|
- baths 3 beds |
show details | |

|
#19
Fm 223 Rd
Shepherd, TX 77371
|
1,972 sq. feet
|
2 baths - beds |
show details | |

|
#20
Brittany Ln
Cleveland, TX 77328
|
1,400 sq. feet
|
1 baths - beds |
show details |
| Photo | Address | Area | Beds / Baths | Price | Details |
|---|---|---|---|---|---|

|
#21
N Shady Oaks Dr
Pointblank, TX 77364
|
1,372 sq. feet
|
1 baths - beds |
show details | |

|
#22
Walter Dr
Cleveland, TX 77328
|
- sq. feet
|
1 baths 2 beds |
show details | |

|
#23
Devin Rd
Cleveland, TX 77328
|
1,008 sq. feet
|
- baths 3 beds |
show details | |

|
#24
Seth Blvd
Cleveland, TX 77328
|
1,200 sq. feet
|
- baths 3 beds |
show details | |

|
#25
Brown Rd
Willis, TX 77378
|
2,944 sq. feet
|
2 baths - beds |
show details | |

|
#26
Rainbow Dr # 7483
Livingston, TX 77399
|
- sq. feet
|
- baths - beds |
show details | |

|
#27
Rainbow Dr
Livingston, TX 77399
|
- sq. feet
|
- baths - beds |
show details | |

|
#28
Wood Grove Way
Willis, TX 77378
|
- sq. feet
|
- baths - beds |
show details | |

|
#29
Cherokee Ln
Onalaska, TX 77360
|
- sq. feet
|
- baths - beds |
show details | |

|
#30
Rainbow Dr # 4623
Livingston, TX 77399
|
- sq. feet
|
- baths - beds |
show details |
| Photo | Address | Area | Beds / Baths | Price | Details |
|---|---|---|---|---|---|

|
#31
Rainbow Dr # 6279
Livingston, TX 77399
|
- sq. feet
|
- baths - beds |
show details | |

|
#32
Butler # 503
Onalaska, TX 77360
|
- sq. feet
|
- baths - beds |
show details | |

|
#33
Rainbow Dr # 15179
Livingston, TX 77399
|
- sq. feet
|
- baths - beds |
show details | |

|
#34
Wood Grove Way
Willis, TX 77378
|
- sq. feet
|
- baths - beds |
show details | |

|
#35
Rainbow Dr # 13172
Livingston, TX 77399
|
- sq. feet
|
- baths - beds |
show details | |

|
#36
Rainbow Dr # 6584
Livingston, TX 77399
|
- sq. feet
|
- baths - beds |
show details | |

|
#37
Thomas Dr
Cleveland, TX 77328
|
- sq. feet
|
- baths - beds |
show details | |

|
#38
Mule Deer Cir
Onalaska, TX 77360
|
- sq. feet
|
- baths - beds |
show details | |

|
#39
Quiet Springs Trl
Willis, TX 77378
|
- sq. feet
|
- baths - beds |
show details | |

|
#40
Forest Grove Dr
Willis, TX 77378
|
- sq. feet
|
- baths - beds |
show details |
| Photo | Address | Area | Beds / Baths | Price | Details |
|---|---|---|---|---|---|

|
#41
Jefferson Davis
Livingston, TX 77351
|
- sq. feet
|
- baths - beds |
show details | |

|
#42
Forest Grove Dr
Willis, TX 77378
|
- sq. feet
|
- baths - beds |
show details | |

|
#43
Forest Grove Dr
Willis, TX 77378
|
- sq. feet
|
- baths - beds |
show details | |

|
#44
Trails End Dr
Cleveland, TX 77328
|
1,400 sq. feet
|
- baths - beds |
show details | |

|
#45
Forest Grove Dr
Willis, TX 77378
|
- sq. feet
|
- baths - beds |
show details | |

|
#46
Forest Grove Dr
Willis, TX 77378
|
- sq. feet
|
- baths - beds |
show details | |

|
#47
Wood Grove Way
Willis, TX 77378
|
- sq. feet
|
- baths - beds |
show details | |

|
#48
Old Israel Rd
Livingston, TX 77351
|
- sq. feet
|
- baths - beds |
show details | |

|
#49
Holiday Vlgs
Pointblank, TX 77364
|
- sq. feet
|
- baths - beds |
show details | |

|
Check over 1 million property listings on Foreclosure.com!
|
browse all offers | |||

Latest news about housing in Coldspring, TX collected exclusively by city-data.com from local newspapers, TV, and radio stations

 | Vizcaya vs. Wolf Ranch (8 replies) |
| Best Lake for a Vacation Home? (10 replies) |
| What TX lake you would wish to have a house at and why? (27 replies) |
| Questions about River Oaks (18 replies) |
| Grand Central Park development aka Camp Strake (6 replies) |
| Looking 4 Quality Home Builders in Southeast TX (12 replies) |

Median year apartment built: 1996
Household type by relationship:
Households: 1,253- Male householders: 138 (43 living alone), Female householders: 357 (149 living alone)
136 spouses (136 opposite-sex spouses), 22 unmarried partners, (22 opposite-sex unmarried partners), 248 children (243 natural, 3 adopted, 2 stepchildren), 82 grandchildren, 75 brothers or sisters, 28 parents, 0 foster children, 49 other relatives, 43 non-relatives
- In group quarters: 70
Size of family households: 154 2-persons, 55 3-persons, 50 4-persons, 3 5-persons, 14 6-persons, 11 7-or-more-persons.
Size of nonfamily households: 203 1-person, 6 2-persons, 14 4-persons.
93 married couples with children.
56 single-parent households (21 men, 35 women).
92.7% of residents of Coldspring speak English at home.
6.7% of residents speak Spanish at home (84% speak English very well, 7% speak English well, 8% speak English not well).
0.8% of residents speak other Indo-European language at home (20% speak English very well, 80% speak English well).
Foreign born population: 25 (2.0%)
(8.0% of them are naturalized citizens)
| Here: | 5.3 |
| State: | 6.3 |
| Here: | 4.2 |
| State: | 4.0 |

- Bedrooms in owner-occupied houses and condos in Coldspring, Texas
- 2no bedroom
- 121 bedroom
- 1162 bedrooms
- 1383 bedrooms
- 134 bedrooms
- 165+ bedrooms

- Bedrooms in renter-occupied apartments in Coldspring, Texas
- 7no bedroom
- 471 bedroom
- 1232 bedrooms
- 373 bedrooms
- 04 bedrooms
- 05+ bedrooms

- Cars and other vehicles available in Coldspring in owner-occupied houses/condos
- 2no vehicle
- 831 vehicle
- 1522 vehicles
- 443 vehicles
- 104 vehicles
- 55+ vehicles

- Cars and other vehicles available in Coldspring in renter-occupied apartments
- 34no vehicle
- 1381 vehicle
- 342 vehicles
- 73 vehicles
- 04 vehicles
- 05+ vehicles

- Rooms in owner-occupied houses in Coldspring, Texas
- 21 room
- 02 rooms
- 603 rooms
- 404 rooms
- 575 rooms
- 686 rooms
- 397 rooms
- 78 rooms
- 239+ rooms

- Rooms in renter-occupied apartments in Coldspring, Texas
- 71 room
- 222 rooms
- 383 rooms
- 504 rooms
- 515 rooms
- 156 rooms
- 207 rooms
- 118 rooms
- 09+ rooms


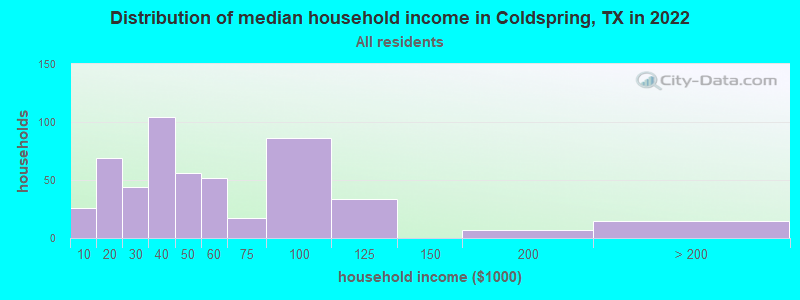
Coldspring, TX household income distribution

- 26Less than $10,000
- 69$10,000 to $19,999
- 44$20,000 to $29,999
- 104$30,000 to $39,999
- 56$40,000 to $49,999
- 52$50,000 to $59,999
- 17$60,000 to $74,999
- 86$75,000 to $99,999
- 34$100,000 to $124,999
- 7$150,000 to $199,999
- 15$200,000 or more
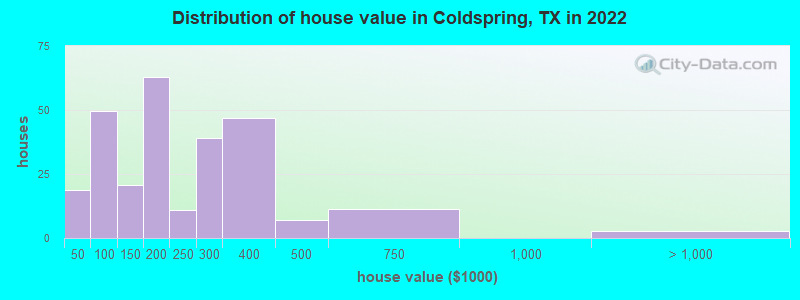
Home value of owner - occupied houses in 2022 in Coldspring, TX
-
- 5Less than $10,000
- 10$10,000 to $14,999
- 3$25,000 to $29,999
- 26$50,000 to $59,999
- 1$60,000 to $69,999
- 13$70,000 to $79,999
- 7$90,000 to $99,999
- 10$100,000 to $124,999
- 10$125,000 to $149,999
- 9$150,000 to $174,999
- 53$175,000 to $199,999
- 11$200,000 to $249,999
- 39$250,000 to $299,999
- 46$300,000 to $399,999
- 7$400,000 to $499,999
- 11$500,000 to $749,999
- 2$1,000,000 to $1,499,999
Rent paid by renters in 2022 in Coldspring, TX
-
- 9$100 to $149
- 20$150 to $199
- 2$200 to $249
- 3$250 to $299
- 10$300 to $349
- 8$350 to $399
- 11$500 to $549
- 19$550 to $599
- 42$600 to $649
- 4$650 to $699
- 6$750 to $799
- 35$800 to $899
- 9$900 to $999
- 7$1,000 to $1,249
- 13No cash rent


Percentage of workers working in this county: 53.8%
Number of people working at home: 12 (2.7% of all workers)
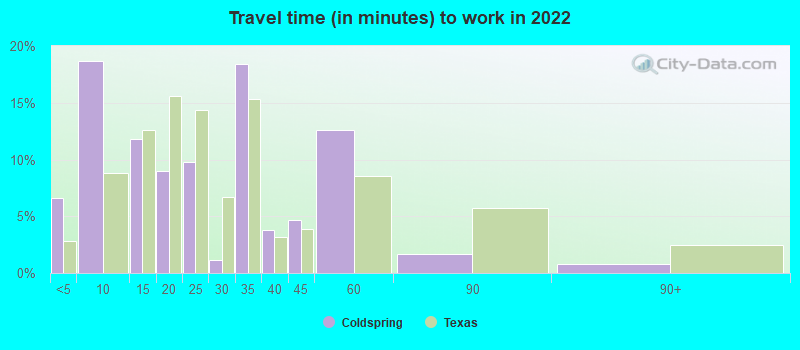
Travel time to work (commute)
- Less than 5 minutes: 50
- 5 to 9 minutes: 33
- 10 to 14 minutes: 33
- 15 to 19 minutes: 34
- 20 to 24 minutes: 17
- 25 to 29 minutes: 38
- 30 to 34 minutes: 53
- 35 to 39 minutes: 0
- 40 to 44 minutes: 27
- 45 to 59 minutes: 41
- 60 to 89 minutes: 63
- 90 or more minutes: 33
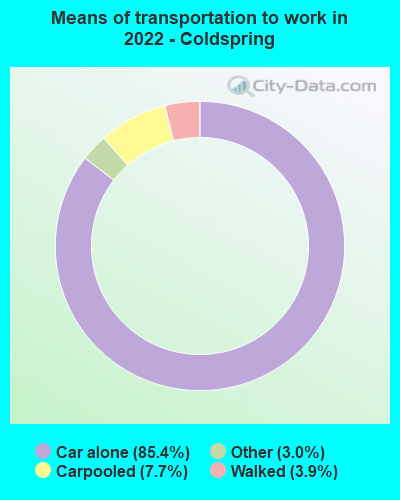
Means of transportation to work:
- Drove a car alone: 936 (79.3%)
- Carpooled: 82 (6.9%)
- Taxi: 38 (3.2%)
- Walked: 42 (3.6%)
- Worked at home: 14 (1.2%)

- Unemployment by race in 2022
- Unemployment rate for White non-Hispanic residents
- 19.2%Females
- Unemployment rate for Black residents
- 5.5%Males
- Unemployment rate for two or more race residents
- 38.6%Males
- Unemployment rate for Hispanic or Latino residents
- 100.0%Males

- Year of entry for the foreign-born population in Coldspring, Texas
- 252010 or later
- 22000 to 2009
- 01990 to 1999
- 21980 to 1989
- 31970 to 1979
- 3Before 1970

First ancestries reported:
- American: 135 (26.9%)
- Dutch: 27 (5.4%)
- Irish: 24 (4.8%)
- Czech: 13 (2.6%)
- Scotch-Irish: 12 (2.4%)
- English: 10 (2.0%)
- German: 9 (1.8%)
- Norwegian: 7 (1.4%)
- Polish: 7 (1.4%)
- Swiss: 6 (1.2%)
Most common places of birth for foreign-born residents (%):
| Coldspring: | 64.0% (16) |
| Texas: | 1.8% (87,382) |
| Coldspring: | 32.0% (8) |
| Texas: | 48.4% (2,411,723) |
| Coldspring: | 8.0% (2) |
| Texas: | 0.0% (1,899) |
Place of birth for U.S.-born residents:
- This state: 898
- Other state: 317
- Northeast: 35
- Midwest: 59
- South: 177
- West: 42
85.1% of Coldspring residents lived in the same house 1 years ago.
Out of people who lived in different houses, 35.3% lived in this county.
Out of people who lived in different counties, 75.7% lived in Texas.
| Coldspring: | 85.1% |
| State average: | 85.7% |
Education attainment for males 25 years and older:
- No schooling: 13
- Nursery to 4th grade: 0
- 5th and 6th grade: 4
- 7th and 8th grade: 10
- 9th grade: 13
- 10th grade: 6
- 11th grade: 0
- 12th grade, no diploma: 9
- High school graduate (or equivalency): 106
- Less than 1 year of college: 20
- Some college more than 1 year, no degree: 40
- Associate degree: 26
- Bachelor's degree: 58
- Master's degree: 0
- Professional school degree: 10
- Doctorate degree: 0

Education attainment for females 25 years and older:
- No schooling: 0
- Nursery to 4th grade: 8
- 5th and 6th grade: 4
- 7th and 8th grade: 1
- 9th grade: 10
- 10th grade: 14
- 11th grade: 9
- 12th grade, no diploma: 4
- High school graduate (or equivalency): 188
- Less than 1 year of college: 73
- Some college more than 1 year, no degree: 128
- Associate degree: 18
- Bachelor's degree: 97
- Master's degree: 23
- Professional school degree: 9
- Doctorate degree: 2


Housing units in structures:
- One, detached: 350
- Two: 24
- 3 or 4: 36
- 5 to 9: 40
- 10 to 19: 14
- 20 to 49: 19
- Mobile homes: 89
Median worth of mobile homes: $63,329
Housing units lacking complete kitchen facilities in 2022: 4.3%
House/condo owner moved in on average 12 years ago
Renter moved in on average 1 years ago

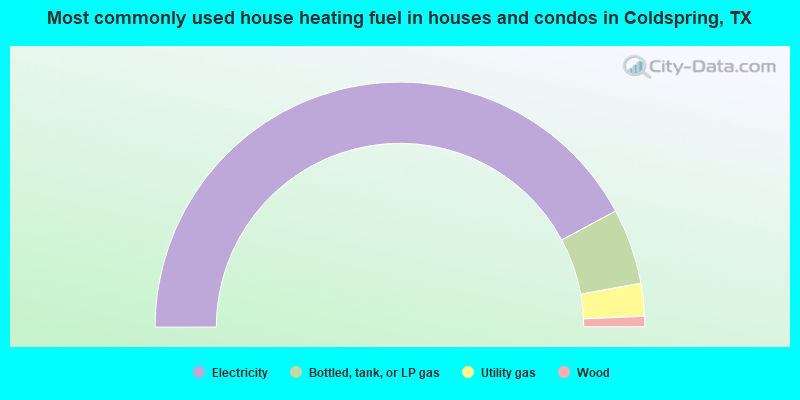
- 84.3%Electricity
- 10.0%Bottled, tank, or LP gas
- 4.3%Utility gas
- 1.4%Wood
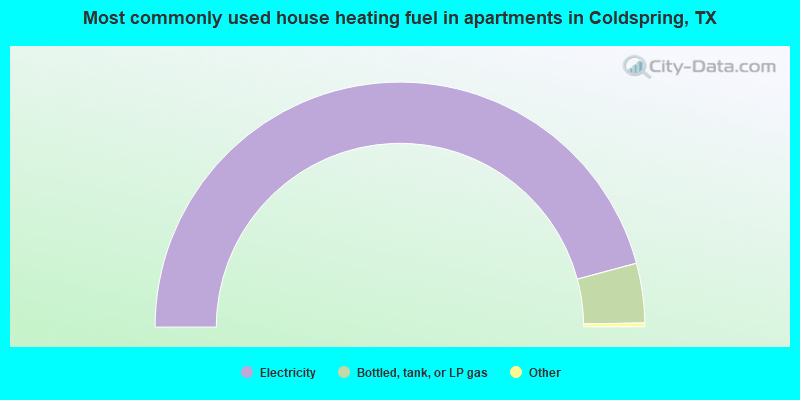
- 92.1%Electricity
- 7.9%Bottled, tank, or LP gas
Private vs. public school enrollment:
| Here: | 1.3% |
| Texas: | 8.8% |
| Here: | 0.0% |
| Texas: | 8.0% |
| Here: | 9.1% |
| Texas: | 16.2% |


