Clarksburg, MD (Maryland) Houses and Residents
| Clarksburg: | $629,744 |
| Maryland: | $398,100 |
Mean price in 2022:
Detached houses: $750,170
Here: $750,170 State: $526,819 Townhouses or other attached units: $430,319
Here: $430,319 State: $328,305 In 2-unit structures: $117,517
Here: $117,517 State: $346,599 In 5-or-more-unit structures: $271,184
Here: $271,184 State: $350,378
Total population: 13,766 (Urban population: 376, Rural population: 1,515 (47 farm, 1,468 nonfarm))
Houses: 9,012 (8,815 occupied: 7,873 owner occupied, 1,008 renter occupied)
| % of renters here: | 11% |
| State: | 32% |
Housing density: 652 houses/condos per square mile
Median price asked for vacant for-sale houses and condos in 2022: $468,281.
Median contract rent in 2022: $1,947 (lower quartile is $1,563, upper quartile is over $2,000)
Median rent asked for vacant for-rent units in 2022: $2,370
Median gross rent in Clarksburg, MD in 2022: over $2,000
Housing units in Clarksburg with a mortgage: 6,764 (415 second mortgage, 4 home equity loan, 321 both second mortgage and home equity loan)
Houses without a mortgage: 20
Median household income for houses/condos with a mortgage: $172,873
Median household income for apartments without a mortgage: $138,013
Median monthly housing costs: $2,564
Compare current foreclosures near Clarksburg, MD:
| Photo | Address | Area | Beds / Baths | Price | Details |
|---|---|---|---|---|---|

|
#1
Blue Sky Dr
Clarksburg, MD 20871
|
2,824 sq. feet
|
4 baths - beds |
show details | |

|
#2
Comus Rd
Clarksburg, MD 20871
|
2,909 sq. feet
|
3 baths - beds |
show details | |

|
#3
Bright Sky Dr
Clarksburg, MD 20871
|
2,680 sq. feet
|
4 baths - beds |
show details | |

|
#4
Moneyworth Way
Clarksburg, MD 20871
|
1,800 sq. feet
|
2 baths - beds |
show details | |

|
#5
Fair Garden Ln
Clarksburg, MD 20871
|
4,094 sq. feet
|
3 baths - beds |
show details | |

|
#6
Regina Dr
Clarksburg, MD 20871
|
1,900 sq. feet
|
2 baths - beds |
show details | |

|
#7
Cypress Spring Rd
Clarksburg, MD 20871
|
4,126 sq. feet
|
2 baths - beds |
show details | |

|
#8
Murphy Grove Ter
Clarksburg, MD 20871
|
2,836 sq. feet
|
2 baths - beds |
show details | |

|
#9
Houser Dr
Clarksburg, MD 20871
|
2,886 sq. feet
|
2 baths - beds |
show details | |

|
#10
Sycamore Farm Dr
Clarksburg, MD 20871
|
2,100 sq. feet
|
3 baths - beds |
show details |
| Photo | Address | Area | Beds / Baths | Price | Details |
|---|---|---|---|---|---|

|
#11
Frederick Rd
Clarksburg, MD 20871
|
2,724 sq. feet
|
2 baths - beds |
show details | |

|
#12
Elm Forest Ct Unit H
Clarksburg, MD 20871
|
- sq. feet
|
- baths - beds |
show details | |

|
#13
Catawba Hill Dr
Clarksburg, MD 20871
|
- sq. feet
|
- baths - beds |
show details | |

|
#14
Spicebush Dr
Clarksburg, MD 20871
|
- sq. feet
|
- baths - beds |
show details | |

|
#15
Regina Ter
Clarksburg, MD 20871
|
- sq. feet
|
- baths - beds |
show details | |

|
#16
Spicebush Dr
Clarksburg, MD 20871
|
- sq. feet
|
- baths - beds |
show details | |

|
#17
Dovekie Ave
Clarksburg, MD 20871
|
- sq. feet
|
- baths - beds |
show details | |

|
#18
Country Squire Way
Clarksburg, MD 20871
|
- sq. feet
|
- baths - beds |
show details | |

|
#19
Horseshoe Bend Cir
Clarksburg, MD 20871
|
- sq. feet
|
- baths - beds |
show details | |

|
#20
Glacier Lily Dr
Clarksburg, MD 20871
|
- sq. feet
|
- baths - beds |
show details |
| Photo | Address | Area | Beds / Baths | Price | Details |
|---|---|---|---|---|---|

|
#21
Moorhen St
Clarksburg, MD 20871
|
- sq. feet
|
- baths - beds |
show details | |

|
#22
Brooke Knolls Rd
Gaithersburg, MD 20882
|
1,704 sq. feet
|
3 baths 4 beds |
$659,900
|
show details |

|
#23
S Leisure World Blvd # 29-1d
Silver Spring, MD 20906
|
990 sq. feet
|
1 baths 1 beds |
$129,900
|
show details |

|
#24
Mills Choice Rd Apt 4
Montgomery Village, MD 20886
|
842 sq. feet
|
1 baths 1 beds |
$149,900
|
show details |

|
#25
Frederick Rd
Clarksburg, MD 20871
|
- sq. feet
|
- baths - beds |
show details | |

|
#26
Forest Haven Way # 10u
Clarksburg, MD 20871
|
- sq. feet
|
- baths - beds |
show details | |

|
#27
Brink Rd
Gaithersburg, MD 20882
|
1,758 sq. feet
|
1 baths 2 beds |
show details | |

|
#28
Riverbend Sq Unit 200
Sterling, VA 20165
|
1,138 sq. feet
|
2 baths 2 beds |
show details | |

|
#29
Flower Hill Way
Gaithersburg, MD 20879
|
1,782 sq. feet
|
3 baths 4 beds |
show details | |

|
#30
Eagle Point Sq
Leesburg, VA 20176
|
2,863 sq. feet
|
3 baths 3 beds |
show details |
| Photo | Address | Area | Beds / Baths | Price | Details |
|---|---|---|---|---|---|

|
#31
Talbott St
Rockville, MD 20852
|
799 sq. feet
|
1 baths 2 beds |
show details | |

|
#32
Chiswick Ct # 37-A
Silver Spring, MD 20906
|
1,513 sq. feet
|
2 baths 2 beds |
show details | |

|
#33
Foxhall Ct
Frederick, MD 21703
|
- sq. feet
|
2 baths 3 beds |
show details | |

|
#34
Wye Creek Dr
Frederick, MD 21703
|
2,277 sq. feet
|
2 baths 5 beds |
show details | |

|
#35
Heron Landing Drive
Sterling, VA 20166
|
2,596 sq. feet
|
3 baths 3 beds |
show details | |

|
#36
Lakeland Dr
Sterling, VA 20164
|
2,143 sq. feet
|
2 baths 3 beds |
show details | |

|
#37
Hopi Dr
Ashburn, VA 20147
|
1,760 sq. feet
|
2 baths 3 beds |
show details | |

|
#38
Brassie Pl Apt 201
Montgomery Village, MD 20886
|
1,054 sq. feet
|
2 baths 2 beds |
show details | |

|
#39
Wedgewood Manor Way
Reston, VA 20194
|
1,933 sq. feet
|
4 baths 4 beds |
show details | |

|
#40
Harbour Town Dr
Silver Spring, MD 20905
|
5,292 sq. feet
|
4 baths 5 beds |
show details |
| Photo | Address | Area | Beds / Baths | Price | Details |
|---|---|---|---|---|---|

|
#41
Park Grove Ter
Ashburn, VA 20147
|
2,100 sq. feet
|
3 baths 3 beds |
show details | |

|
#42
E Beech Rd
Sterling, VA 20164
|
1,394 sq. feet
|
2 baths 4 beds |
show details | |

|
#43
Thornhurst Dr
Olney, MD 20832
|
3,676 sq. feet
|
5 baths - beds |
show details | |

|
#44
Sprigg St N
Frederick, MD 21704
|
3,688 sq. feet
|
3 baths - beds |
show details | |

|
#45
Manor Dr
Mount Airy, MD 21771
|
1,176 sq. feet
|
2 baths - beds |
show details | |

|
#46
Whites Ferry Rd
Dickerson, MD 20842
|
3,024 sq. feet
|
4 baths - beds |
show details | |

|
#47
Millwood Rd
Mount Airy, MD 21771
|
1,871 sq. feet
|
2 baths - beds |
show details | |

|
#48
Muirfield Dr
Ijamsville, MD 21754
|
4,282 sq. feet
|
4 baths - beds |
show details | |

|
#49
Brent Rd
Rockville, MD 20850
|
672 sq. feet
|
1 baths - beds |
show details | |

|
Check over 1 million property listings on Foreclosure.com!
|
browse all offers | |||

Latest news about housing in Clarksburg, MD collected exclusively by city-data.com from local newspapers, TV, and radio stations

 | Detached garages for new homes in Clarksburg - why? (1 reply) |
| Clarksburg, MD Townhouse for Rent (0 replies) |
| General Population of Clarksburg, MD (9 replies) |
| 'Affordable' ($300K-$400K) NEW TH/SF homes in Montgomery County ? (10 replies) |
| Looking to buy a house in MoCo--areas to avoid? (4 replies) |
| Buying home in Clarksburg (4 replies) |
Median year apartment built: 2013
Household type by relationship:
Households: 28,219- Male householders: 4,697 (371 living alone), Female householders: 4,012 (637 living alone)
6,147 spouses (6,135 opposite-sex spouses), 393 unmarried partners, (393 opposite-sex unmarried partners), 10,420 children (10,225 natural, 58 adopted, 136 stepchildren), 214 grandchildren, 116 brothers or sisters, 1,382 parents, 0 foster children, 304 other relatives, 499 non-relatives
- In group quarters: 30
Size of family households: 1,783 2-persons, 2,052 3-persons, 2,183 4-persons, 973 5-persons, 268 6-persons, 17 7-or-more-persons.
Size of nonfamily households: 1,152 1-person, 208 2-persons, 5 3-persons, 5 4-persons, 10 6-persons.
6,657 married couples with children.
1,413 single-parent households (195 men, 1,218 women).
51.3% of residents of Clarksburg speak English at home.
7.9% of residents speak Spanish at home (74% speak English very well, 15% speak English well, 8% speak English not well, 3% don't speak English at all).
12.7% of residents speak other Indo-European language at home (70% speak English very well, 18% speak English well, 11% speak English not well, 1% don't speak English at all).
23.0% of residents speak Asian or Pacific Island language at home (66% speak English very well, 22% speak English well, 10% speak English not well, 2% don't speak English at all).
3.7% of residents speak other language at home (73% speak English very well, 12% speak English well, 7% speak English not well, 8% don't speak English at all).
Foreign born population: 10,936 (38.8%)
(63.7% of them are naturalized citizens)
| Here: | 7.4 |
| State: | 7.3 |
| Here: | 5.1 |
| State: | 4.2 |
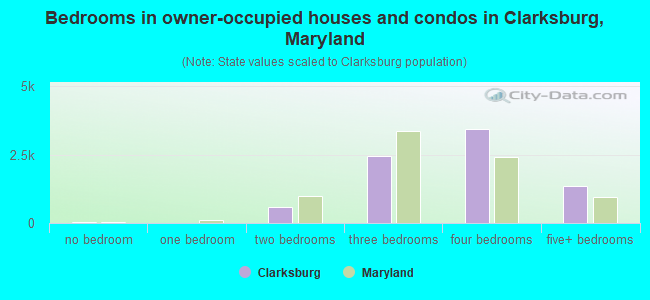
- Bedrooms in owner-occupied houses and condos in Clarksburg, Maryland
- 37no bedroom
- 151 bedroom
- 5952 bedrooms
- 2,4393 bedrooms
- 3,4434 bedrooms
- 1,3455+ bedrooms
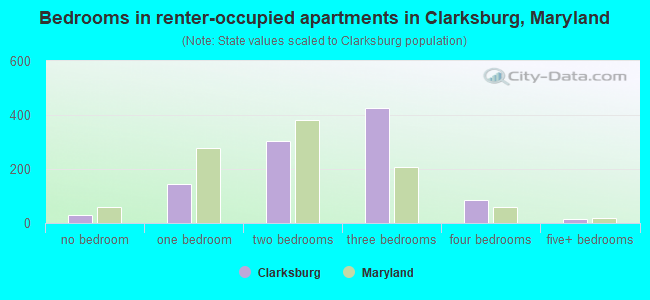
- Bedrooms in renter-occupied apartments in Clarksburg, Maryland
- 28no bedroom
- 1451 bedroom
- 3052 bedrooms
- 4273 bedrooms
- 874 bedrooms
- 165+ bedrooms
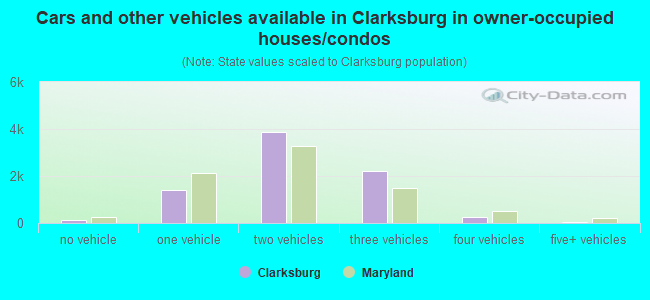
- Cars and other vehicles available in Clarksburg in owner-occupied houses/condos
- 134no vehicle
- 1,3951 vehicle
- 3,8562 vehicles
- 2,2093 vehicles
- 2434 vehicles
- 375+ vehicles
- Cars and other vehicles available in Clarksburg in renter-occupied apartments
- 89no vehicle
- 4361 vehicle
- 3412 vehicles
- 1063 vehicles
- 204 vehicles
- 165+ vehicles
- Rooms in owner-occupied houses in Clarksburg, Maryland
- 121 room
- 02 rooms
- 3053 rooms
- 5194 rooms
- 1,0225 rooms
- 1,0316 rooms
- 1,0147 rooms
- 8978 rooms
- 3,0759+ rooms
- Rooms in renter-occupied apartments in Clarksburg, Maryland
- 281 room
- 672 rooms
- 1033 rooms
- 1974 rooms
- 1715 rooms
- 1256 rooms
- 807 rooms
- 698 rooms
- 1699+ rooms
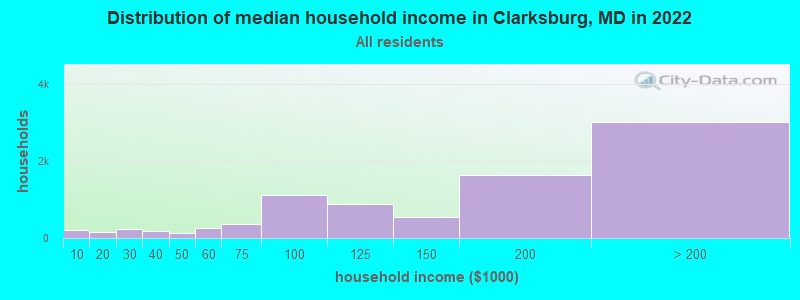
Clarksburg, MD household income distribution

- 217Less than $10,000
- 154$10,000 to $19,999
- 222$20,000 to $29,999
- 190$30,000 to $39,999
- 130$40,000 to $49,999
- 264$50,000 to $59,999
- 353$60,000 to $74,999
- 1,106$75,000 to $99,999
- 887$100,000 to $124,999
- 538$125,000 to $149,999
- 1,641$150,000 to $199,999
- 3,017$200,000 or more
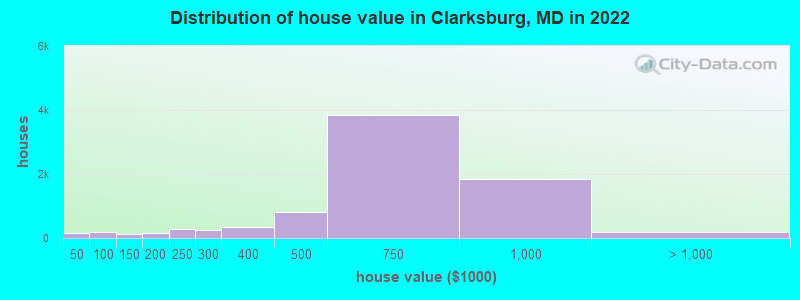
Home value of owner - occupied houses in 2022 in Clarksburg, MD
-
- 81Less than $10,000
- 4$10,000 to $14,999
- 17$20,000 to $24,999
- 41$40,000 to $49,999
- 11$50,000 to $59,999
- 103$60,000 to $69,999
- 18$70,000 to $79,999
- 8$100,000 to $124,999
- 113$125,000 to $149,999
- 30$150,000 to $174,999
- 112$175,000 to $199,999
- 267$200,000 to $249,999
- 247$250,000 to $299,999
- 347$300,000 to $399,999
- 810$400,000 to $499,999
- 3,840$500,000 to $749,999
- 1,842$750,000 to $999,999
- 167$1,000,000 to $1,499,999
- 21$1,500,000 to $1,999,999
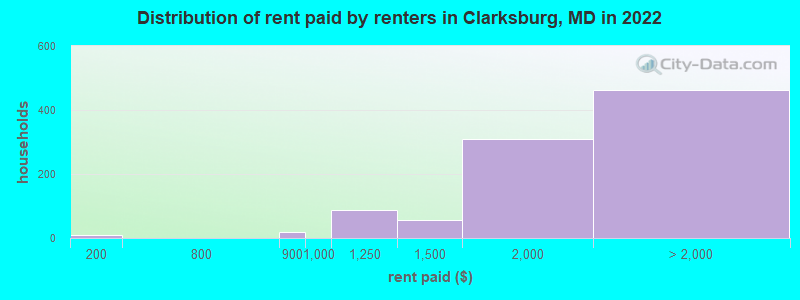
Rent paid by renters in 2022 in Clarksburg, MD
-
- 9$100 to $149
- 17$800 to $899
- 88$1,000 to $1,249
- 57$1,250 to $1,499
- 309$1,500 to $1,999
- 232$2,000 to $2,499
- 150$2,500 to $2,999
- 23$3,000 to $3,499
- 57No cash rent
Percentage of workers working in this county: 84.8%
Number of people working at home: 4,224 (29.6% of all workers)
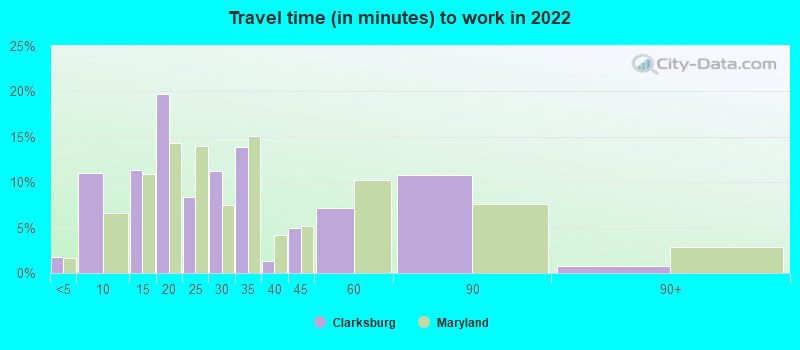
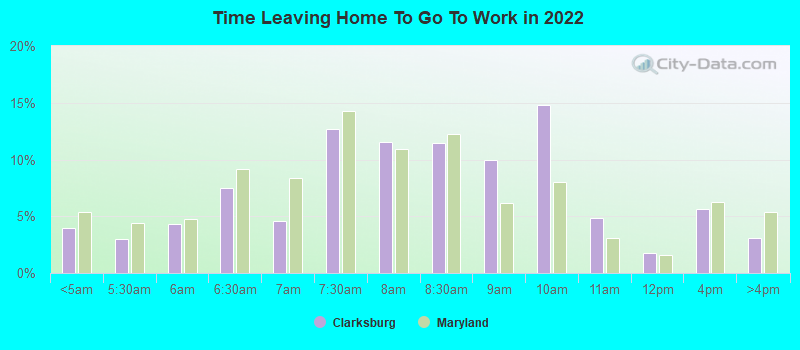
Travel time to work (commute)
- Less than 5 minutes: 76
- 5 to 9 minutes: 428
- 10 to 14 minutes: 722
- 15 to 19 minutes: 1,022
- 20 to 24 minutes: 1,273
- 25 to 29 minutes: 999
- 30 to 34 minutes: 1,734
- 35 to 39 minutes: 435
- 40 to 44 minutes: 1,102
- 45 to 59 minutes: 958
- 60 to 89 minutes: 964
- 90 or more minutes: 331
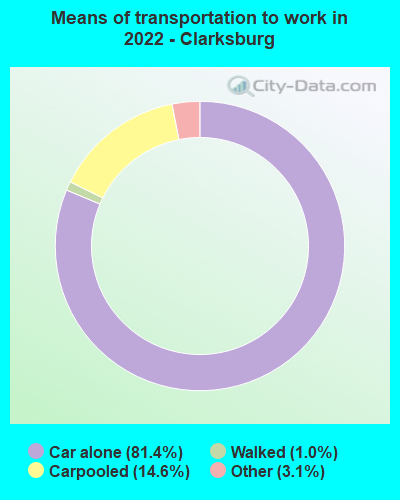
Means of transportation to work:
- Drove a car alone: 2,594 (38.2%)
- Carpooled: 495 (7.3%)
- Taxi: 104 (1.5%)
- Walked: 27 (0.4%)
- Worked at home: 4,224 (62.2%)
- Unemployment by race in 2022
- Unemployment rate for White non-Hispanic residents
- 1.5%Males
- 6.0%Females
- Unemployment rate for Black residents
- 1.9%Males
- 10.0%Females
- Unemployment rate for Asian residents
- 4.1%Males
- 1.0%Females
- Unemployment rate for other race residents
- 11.0%Females
- Unemployment rate for two or more race residents
- 4.6%Males
- Unemployment rate for Hispanic or Latino residents
- 5.6%Females
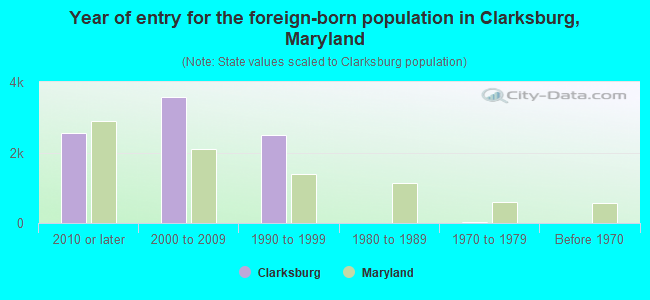
- Year of entry for the foreign-born population in Clarksburg, Maryland
- 2,5552010 or later
- 3,5772000 to 2009
- 2,4991990 to 1999
- 41980 to 1989
- 241970 to 1979
- 14Before 1970
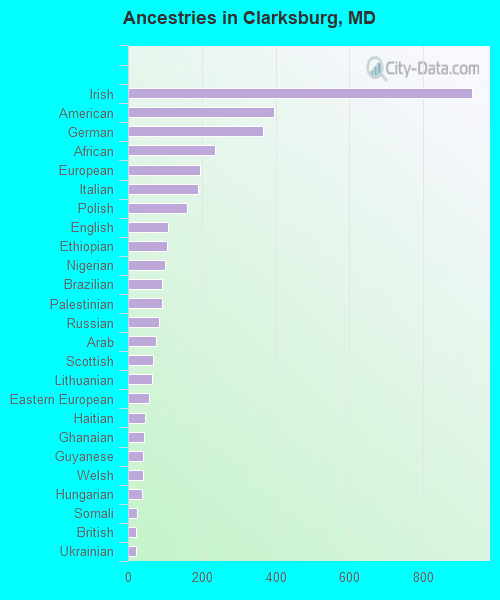
First ancestries reported:
- Irish: 932 (5.0%)
- American: 395 (2.1%)
- German: 367 (2.0%)
- African: 236 (1.3%)
- European: 194 (1.0%)
- Italian: 191 (1.0%)
- Polish: 161 (0.9%)
- English: 109 (0.6%)
- Ethiopian: 107 (0.6%)
- Nigerian: 99 (0.5%)
- Brazilian: 93 (0.5%)
- Palestinian: 92 (0.5%)
- Russian: 84 (0.5%)
- Arab: 77 (0.4%)
- Scottish: 68 (0.4%)
- Lithuanian: 66 (0.4%)
- Eastern European: 56 (0.3%)
- Haitian: 47 (0.3%)
- Ghanaian: 43 (0.2%)
- Guyanese: 40 (0.2%)
- Welsh: 40 (0.2%)
- Hungarian: 37 (0.2%)
- Somali: 24 (0.1%)
- British: 22 (0.1%)
- Ukrainian: 22 (0.1%)
- Estonian: 21 (0.1%)
- Iranian: 19 (0.1%)
- Northern European: 19 (0.1%)
- Belgian: 16 (0.09%)
- Canadian: 10 (0.05%)
- Bulgarian: 10 (0.05%)
- Norwegian: 8 (0.04%)
- Israeli: 6 (0.03%)
- Czechoslovakian: 5 (0.03%)
- Serbian: 2 (0.01%)
Most common places of birth for foreign-born residents (%):
| Clarksburg: | 27.0% (2,949) |
| Maryland: | 6.4% (61,725) |
| Clarksburg: | 9.3% (1,018) |
| Maryland: | 4.6% (44,742) |
| Clarksburg: | 9.2% (1,011) |
| Maryland: | 3.4% (32,635) |
| Clarksburg: | 6.7% (730) |
| Maryland: | 1.1% (10,205) |
| Clarksburg: | 4.1% (443) |
| Maryland: | 4.4% (42,350) |
| Clarksburg: | 3.7% (409) |
| Maryland: | 1.9% (18,716) |
| Clarksburg: | 3.3% (356) |
| Maryland: | 3.8% (36,698) |
| Clarksburg: | 3.0% (331) |
| Maryland: | 12.0% (115,412) |
| Clarksburg: | 2.6% (287) |
| Maryland: | 2.5% (24,026) |
| Clarksburg: | 2.3% (252) |
| Maryland: | 0.4% (3,410) |
| Clarksburg: | 2.2% (246) |
| Maryland: | 2.5% (23,969) |
| Clarksburg: | 1.5% (169) |
| Maryland: | 0.9% (8,520) |
| Clarksburg: | 1.5% (166) |
| Maryland: | 4.6% (44,825) |
Place of birth for U.S.-born residents:
- This state: 9,573
- Other state: 7,510
- Northeast: 1,942
- Midwest: 1,038
- South: 3,986
- West: 585
92.4% of Clarksburg residents lived in the same house 1 years ago.
Out of people who lived in different houses, 40.0% lived in this county.
Out of people who lived in different counties, 53.1% lived in Maryland.
| Clarksburg: | 92.4% |
| State average: | 88.5% |
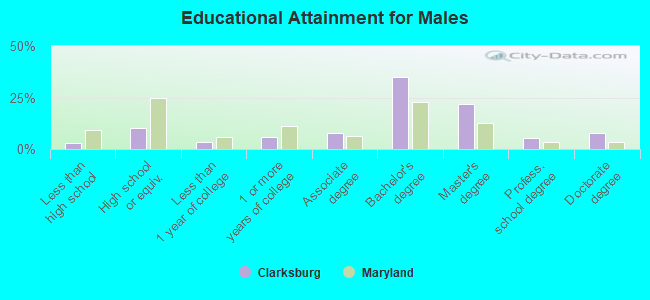
Education attainment for males 25 years and older:
- No schooling: 88
- Nursery to 4th grade: 38
- 5th and 6th grade: 11
- 7th and 8th grade: 0
- 9th grade: 9
- 10th grade: 56
- 11th grade: 27
- 12th grade, no diploma: 23
- High school graduate (or equivalency): 885
- Less than 1 year of college: 272
- Some college more than 1 year, no degree: 521
- Associate degree: 656
- Bachelor's degree: 2,998
- Master's degree: 1,895
- Professional school degree: 472
- Doctorate degree: 654
Education attainment for females 25 years and older:
- No schooling: 271
- Nursery to 4th grade: 119
- 5th and 6th grade: 39
- 7th and 8th grade: 0
- 9th grade: 0
- 10th grade: 10
- 11th grade: 68
- 12th grade, no diploma: 213
- High school graduate (or equivalency): 1,264
- Less than 1 year of college: 261
- Some college more than 1 year, no degree: 571
- Associate degree: 484
- Bachelor's degree: 3,682
- Master's degree: 2,048
- Professional school degree: 404
- Doctorate degree: 522

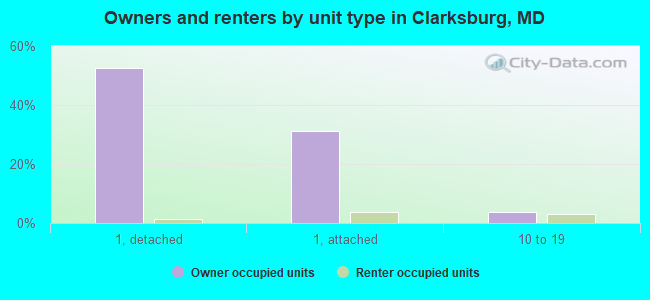
Housing units in structures:
- One, detached: 4,912
- One, attached: 3,122
- Two: 42
- 3 or 4: 55
- 5 to 9: 73
- 10 to 19: 563
- 20 to 49: 34
- 50 or more: 207
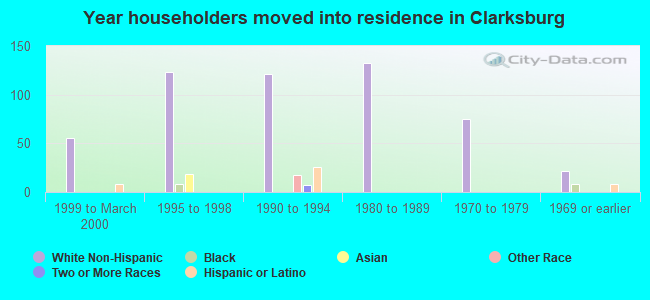
House/condo owner moved in on average 7 years ago
Renter moved in on average 3 years ago
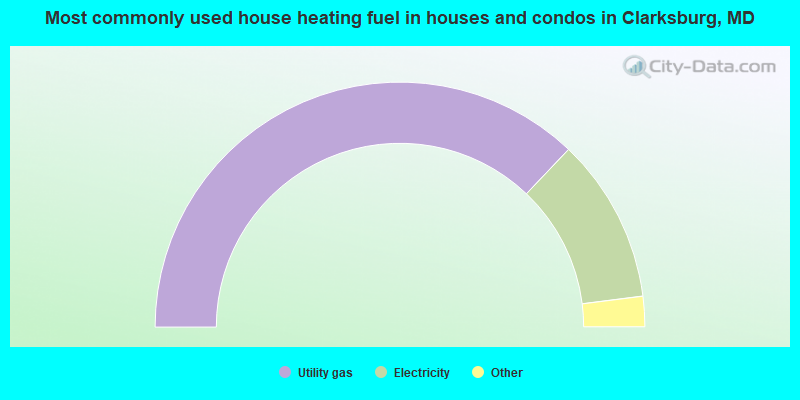
- 74.2%Utility gas
- 21.8%Electricity
- 2.5%Fuel oil, kerosene, etc.
- 1.3%Bottled, tank, or LP gas
- 0.2%No fuel used
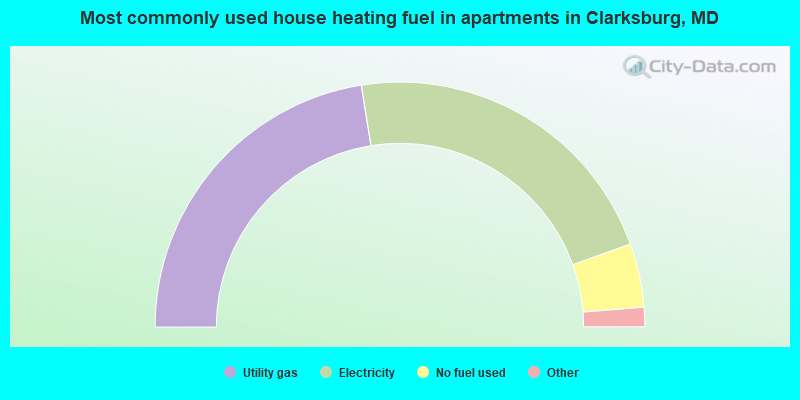
- 45.1%Utility gas
- 44.2%Electricity
- 8.4%No fuel used
- 1.2%Bottled, tank, or LP gas
- 1.1%Fuel oil, kerosene, etc.
Private vs. public school enrollment:
| Here: | 12.3% |
| Maryland: | 15.2% |
| Here: | 6.8% |
| Maryland: | 14.4% |
| Here: | 30.5% |
| Maryland: | 20.2% |