Cincinnati, OH (Ohio) Houses and Residents
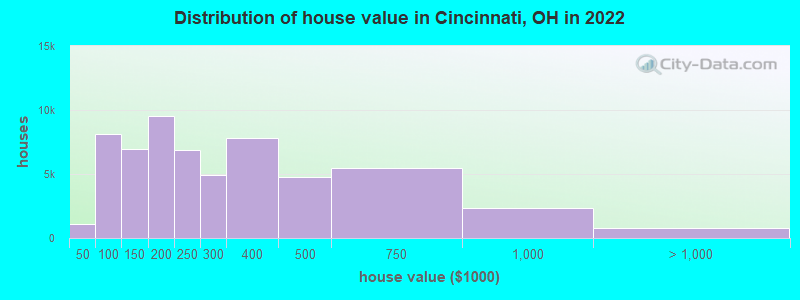
Estimated median house or condo value in 2022: $227,800 (it was $93,200 in 2000 )
Cincinnati:
$227,800Ohio:
$204,100
Lower value quartile - upper value quartile: $142,600 - $384,700Mean price in 2022: Detached houses: $340,197 Here:
$340,197State:
$254,366
Townhouses or other attached units: $305,276 Here:
$305,276State:
$225,733
In 2-unit structures: $156,045 Here:
$156,045State:
$144,384
In 3-to-4-unit structures: $272,318 Here:
$272,318State:
$203,002
In 5-or-more-unit structures: $306,048 Here:
$306,048State:
$211,593
Total population: 298,165 (All urban)
Houses: 161,545 (145,749 occupied: 58,387 owner occupied, 87,362 renter occupied )
% of renters here:
60%State:
33%
Housing density: 2,072 houses/condos per square mile
Median price asked for vacant for-sale houses and condos in 2022: $233,096.
Median contract rent in 2022: $777 (lower quartile is $577, upper quartile is $1,029)
Median rent asked for vacant for-rent units in 2022: $689
Median gross rent in Cincinnati, OH in 2022: $929
Housing units in Cincinnati with a mortgage: 39,601 (4,172 second mortgage, 248 home equity loan, 3,392 both second mortgage and home equity loan )Houses without a mortgage: 1,163
Median household income for houses/condos with a mortgage: $107,176
Median household income for apartments without a mortgage: $63,977
Median monthly housing costs: $990
Data:
Median house or condo value ($)
Median house or condo value ($ change since 2000)
Median house or condo value ($) - White
Median house or condo value ($) - Black or African American
Median house or condo value ($) - Asian
Median house or condo value ($) - Hispanic or Latino
Median house or condo value ($) - American Indian and Alaska Native
Median house or condo value ($) - Multirace
Median house or condo value ($) - Other Race
Median price asked for mobile homes ($)
Household density (households per square mile)
Mean house or condo value by units in structure - 1, detached ($)
Mean house or condo value by units in structure - 1, attached ($)
Mean house or condo value by units in structure - 2 ($)
Mean house or condo value by units in structure by units in structure - 3 or 4 ($)
Mean house or condo value by units in structure - 5 or more ($)
Mean house or condo value by units in structure - Boat, RV, van, etc. ($)
Mean house or condo value by units in structure - Mobile home ($)
Median contract rent ($)
Median contract rent - Lower quartile ($)
Median contract rent - Upper quartile ($)
Median gross rent ($)
Urban houses (%)
Rural houses (%)
Houses occupied (%)
Houses occupied (% change since 2000)
Houses owner occupied (%)
Houses owner occupied (% change since 2000)
Houses renter occupied (%)
Houses renter occupied (% change since 2000)
Vacant housing units - For rent (%)
Vacant housing units - For rent (% change since 2000)
Vacant housing units - For sale only (%)
Vacant housing units - For sale only (% change since 2000)
Vacant housing units - Rented or sold, not occupied (%)
Vacant housing units - Rented or sold, not occupied (% change since 2000)
Vacant housing units - For seasonal, recreational, or occasional use (%)
Vacant housing units - For seasonal, recreational, or occasional use (% change since 2000)
Vacant housing units - For migrant workers (%)
Vacant housing units - For migrant workers (% change since 2000)
Vacant housing units - Other vacant (%)
Vacant housing units - Other vacant (% change since 2000)
Median monthly housing costs ($)
Median household income for houses/condos with a mortgage ($)
Median household income for houses/condos without a mortgage ($)
Median household income ($)
Median household income ($) - White
Median household income ($) - Black or African American
Median household income ($) - Asian
Median household income ($) - Hispanic or Latino
Median household income ($) - American Indian and Alaska Native
Median household income ($) - Multirace
Median household income ($) - Other Race
Mortgage status - with mortgage (%)
Mortgage status - with second mortgage (%)
Mortgage status - with home equity loan (%)
Mortgage status - with both second mortgage and home equity loan (%)
Mortgage status - without a mortgage (%)
Median year house/condo built
Median year apartment built
Household type by relationship - Male householder living alone (%)
Household type by relationship - Male householder not living alone (%)
Household type by relationship - Female householder living alone (%)
Household type by relationship - Female householder not living alone (%)
Household type by relationship - Opposite-Sex spouse (%)
Household type by relationship - Same-Sex spouse (%)
Household type by relationship - Opposite-Sex unmarried partner (%)
Household type by relationship - Same-Sex unmarried partner (%)
Household type by relationship - In group quarters (%)
Size of family households - 2-person household (%)
Size of family households - 3-person household (%)
Size of family households - 4-person household (%)
Size of family households - 5-person household (%)
Size of family households - 6-person household (%)
Size of family households - 7-or-more-person household (%)
Size of nonfamily households - 1-person household (%)
Size of nonfamily households - 2-person household (%)
Size of nonfamily households - 3-person household (%)
Size of nonfamily households - 4-person household (%)
Size of nonfamily households - 5-person household (%)
Size of nonfamily households - 6-person household (%)
Size of nonfamily households - 7-or-moreperson household (%)
Year house built - Built 2010 or later (%)
Year house built - Built 2000 to 2009 (%)
Year house built - Built 1990 to 1999 (%)
Year house built - Built 1980 to 1989 (%)
Year house built - Built 1970 to 1979 (%)
Year house built - Built 1960 to 1969 (%)
Year house built - Built 1950 to 1959 (%)
Year house built - Built 1940 to 1949 (%)
Year house built - Built 1939 or earlier (%)
Median number of rooms in houses and condos
Median number of rooms in apartments
Median number of bedrooms in owner occupied houses
Mean number of bedrooms in owner occupied houses
Median number of bedrooms in renter occupied houses
Mean number of bedrooms in renter occupied houses
Median number of vehichles in owner occupied houses
Mean number of vehichles in owner occupied houses
Median number of vehichles in renter occupied houses
Mean number of vehichles in renter occupied houses
Rooms in owner-occupied houses - 1 room (%)
Rooms in owner-occupied houses - 2 rooms (%)
Rooms in owner-occupied houses - 3 rooms (%)
Rooms in owner-occupied houses - 4 rooms (%)
Rooms in owner-occupied houses - 5 rooms (%)
Rooms in owner-occupied houses - 6 rooms (%)
Rooms in owner-occupied houses - 7 rooms (%)
Rooms in owner-occupied houses - 8 rooms (%)
Rooms in owner-occupied houses - 9+ rooms (%)
Rooms in renter-occupied houses - 1 room (%)
Rooms in renter-occupied houses - 2 rooms (%)
Rooms in renter-occupied houses - 3 rooms (%)
Rooms in renter-occupied houses - 4 rooms (%)
Rooms in renter-occupied houses - 5 rooms (%)
Rooms in renter-occupied houses - 6 rooms (%)
Rooms in renter-occupied houses - 7 rooms (%)
Rooms in renter-occupied houses - 8 rooms (%)
Rooms in renter-occupied houses - 9+ rooms (%)
Bedrooms in owner-occupied houses - no bedrooms (%)
Bedrooms in owner-occupied houses - 1 bedroom (%)
Bedrooms in owner-occupied houses - 2 bedrooms (%)
Bedrooms in owner-occupied houses - 3 bedrooms (%)
Bedrooms in owner-occupied houses - 4 bedrooms (%)
Bedrooms in owner-occupied houses - 5+ bedrooms (%)
Bedrooms in renter-occupied houses - no bedrooms (%)
Bedrooms in renter-occupied houses - 1 bedroom (%)
Bedrooms in renter-occupied houses - 2 bedrooms (%)
Bedrooms in renter-occupied houses - 3 bedrooms (%)
Bedrooms in renter-occupied houses - 4 bedrooms (%)
Bedrooms in renter-occupied houses - 5+ bedrooms (%)
Vehicles available in owner-occupied houses - no vehicle available (%)
Vehicles available in owner-occupied houses - 1 vehicle available(%)
Vehicles available in owner-occupied houses - 2 Vehicles available (%)
Vehicles available in owner-occupied houses - 3 Vehicles available (%)
Vehicles available in owner-occupied houses - 4 Vehicles available (%)
Vehicles available in owner-occupied houses - 5+ Vehicles available (%)
Vehicles available in renter-occupied houses - no vehicle available (%)
Vehicles available in renter-occupied houses - 1 vehicle available (%)
Vehicles available in renter-occupied houses - 2 Vehicles available (%)
Vehicles available in renter-occupied houses - 3 Vehicles available (%)
Vehicles available in renter-occupied houses - 4 Vehicles available (%)
Vehicles available in renter-occupied houses - 5+ Vehicles available (%)
Housing units in structures - 1, detached (%)
Housing units in structures - 1, attached (%)
Housing units in structures - 2 (%)
Housing units in structures - 3 or 4 (%)
Housing units in structures - 5 to 9 (%)
Housing units in structures - 10 to 19 (%)
Housing units in structures - 20 to 49 (%)
Housing units in structures - 50 or more (%)
Housing units in structures - Mobile home (%)
Housing units in structures - Boat, RV, van, etc. (%)
Housing units in structures - Owners - 1, detached (%)
Housing units in structures - Owners - 1, attached (%)
Housing units in structures - Owners - 2 (%)
Housing units in structures - Owners - 3 or 4 (%)
Housing units in structures - Owners - 5 to 9 (%)
Housing units in structures - Owners - 10 to 19 (%)
Housing units in structures - Owners - 20 to 49 (%)
Housing units in structures - Owners - 50 or more (%)
Housing units in structures - Owners - Mobile home (%)
Housing units in structures - Owners - Boat, RV, van, etc. (%)
Housing units in structures - Renters - 1, detached (%)
Housing units in structures - Renters - 1, attached (%)
Housing units in structures - Renters - 2 (%)
Housing units in structures - Renters - 3 or 4 (%)
Housing units in structures - Renters - 5 to 9 (%)
Housing units in structures - Renters - 10 to 19 (%)
Housing units in structures - Renters - 20 to 49 (%)
Housing units in structures - Renters - 50 or more (%)
Housing units in structures - Renters - Mobile home (%)
Housing units in structures - Renters - Boat, RV, van, etc. (%)
House/condo owner moved in on average (years ago)
Renter moved in on average (years ago)
Year householder moved into unit - Moved in 1999 to March 2000 (%)
Year householder moved into unit - Moved in 1999 to March 2000 (%) - White
Year householder moved into unit - Moved in 1999 to March 2000 (%) - Black or African American
Year householder moved into unit - Moved in 1999 to March 2000 (%) - Asian
Year householder moved into unit - Moved in 1999 to March 2000 (%) - Hispanic or Latino
Year householder moved into unit - Moved in 1999 to March 2000 (%) - American Indian and Alaska Native
Year householder moved into unit - Moved in 1999 to March 2000 (%) - Multirace
Year householder moved into unit - Moved in 1999 to March 2000 (%) - Other Race
Year householder moved into unit - Moved in 1995 to 1998 (%)
Year householder moved into unit - Moved in 1995 to 1998 (%) - White
Year householder moved into unit - Moved in 1995 to 1998 (%) - Black or African American
Year householder moved into unit - Moved in 1995 to 1998 (%) - Asian
Year householder moved into unit - Moved in 1995 to 1998 (%) - Hispanic or Latino
Year householder moved into unit - Moved in 1995 to 1998 (%) - American Indian and Alaska Native
Year householder moved into unit - Moved in 1995 to 1998 (%) - Multirace
Year householder moved into unit - Moved in 1995 to 1998 (%) - Other Race
Year householder moved into unit - Moved in 1990 to 1994 (%)
Year householder moved into unit - Moved in 1990 to 1994 (%) - White
Year householder moved into unit - Moved in 1990 to 1994 (%) - Black or African American
Year householder moved into unit - Moved in 1990 to 1994 (%) - Asian
Year householder moved into unit - Moved in 1990 to 1994 (%) - Hispanic or Latino
Year householder moved into unit - Moved in 1990 to 1994 (%) - American Indian and Alaska Native
Year householder moved into unit - Moved in 1990 to 1994 (%) - Multirace
Year householder moved into unit - Moved in 1990 to 1994 (%) - Other Race
Year householder moved into unit - Moved in 1980 to 1989 (%)
Year householder moved into unit - Moved in 1980 to 1989 (%) - White
Year householder moved into unit - Moved in 1980 to 1989 (%) - Black or African American
Year householder moved into unit - Moved in 1980 to 1989 (%) - Asian
Year householder moved into unit - Moved in 1980 to 1989 (%) - Hispanic or Latino
Year householder moved into unit - Moved in 1980 to 1989 (%) - American Indian and Alaska Native
Year householder moved into unit - Moved in 1980 to 1989 (%) - Multirace
Year householder moved into unit - Moved in 1980 to 1989 (%) - Other Race
Year householder moved into unit - Moved in 1970 to 1979 (%)
Year householder moved into unit - Moved in 1970 to 1979 (%) - White
Year householder moved into unit - Moved in 1970 to 1979 (%) - Black or African American
Year householder moved into unit - Moved in 1970 to 1979 (%) - Asian
Year householder moved into unit - Moved in 1970 to 1979 (%) - Hispanic or Latino
Year householder moved into unit - Moved in 1970 to 1979 (%) - American Indian and Alaska Native
Year householder moved into unit - Moved in 1970 to 1979 (%) - Multirace
Year householder moved into unit - Moved in 1970 to 1979 (%) - Other Race
Year householder moved into unit - Moved in 1969 or earlier (%)
Year householder moved into unit - Moved in 1969 or earlier (%) - White
Year householder moved into unit - Moved in 1969 or earlier (%) - Black or African American
Year householder moved into unit - Moved in 1969 or earlier (%) - Asian
Year householder moved into unit - Moved in 1969 or earlier (%) - Hispanic or Latino
Year householder moved into unit - Moved in 1969 or earlier (%) - American Indian and Alaska Native
Year householder moved into unit - Moved in 1969 or earlier (%) - Multirace
Year householder moved into unit - Moved in 1969 or earlier (%) - Other Race
Housing units lacking complete plumbing facilities (%)
Housing units lacking complete kitchen facilities (%)
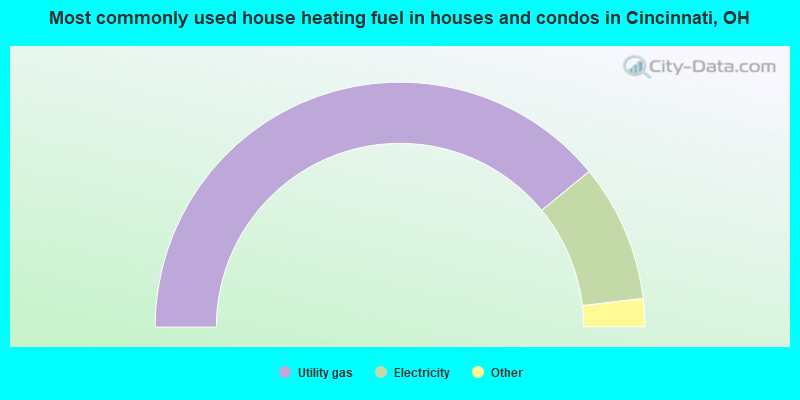
House heating fuel used in houses and condos - Utility gas (%)
House heating fuel used in houses and condos - Bottled, tank, or LP gas (%)
House heating fuel used in houses and condos - Electricity (%)
House heating fuel used in houses and condos - Fuel oil, kerosene, etc. (%)
House heating fuel used in houses and condos - Coal or coke (%)
House heating fuel used in houses and condos - Wood (%)
House heating fuel used in houses and condos - Solar energy (%)
House heating fuel used in houses and condos - Other fuel (%)
House heating fuel used in houses and condos - No fuel used (%)
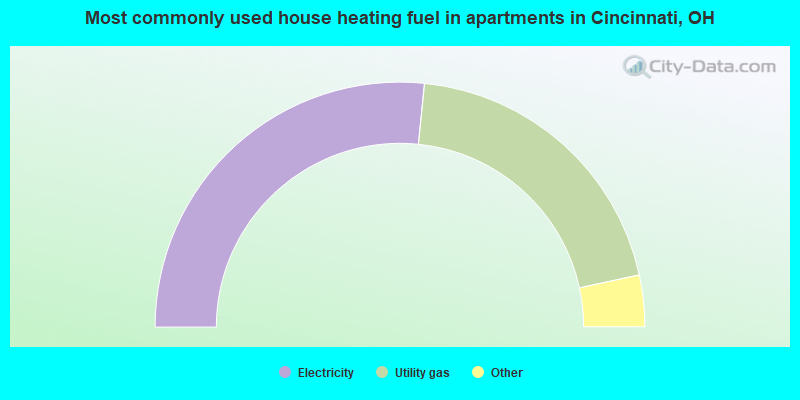
House heating fuel used in apartments - Utility gas (%)
House heating fuel used in apartments - Bottled, tank, or LP gas (%)
House heating fuel used in apartments - Electricity (%)
House heating fuel used in apartments - Fuel oil, kerosene, etc. (%)
House heating fuel used in apartments - Coal or coke (%)
House heating fuel used in apartments - Wood (%)
House heating fuel used in apartments - Solar energy (%)
House heating fuel used in apartments - Other fuel (%)
House heating fuel used in apartments - No fuel used (%)
Latest news about housing in Cincinnati, OH collected exclusively by city-data.com from local newspapers, TV, and radio stations
Median year house/condo built: 1938Median year apartment built: 1966Household type by relationship:
Households: 309,536
Male householders: 62,250 (29,741 living alone ), Female householders: 83,499 (34,651 living alone )33,771 spouses (33,007 opposite-sex spouses ), 15,770 unmarried partners , (15,069 opposite-sex unmarried partners ), 67,562 children (63,725 natural , 2,021 adopted , 1,816 stepchildren ), 8,898 grandchildren , 2,085 brothers or sisters , 1,012 parents , 943 foster children , 3,860 other relatives , 15,928 non-relatives In group quarters: 13,958
Size of family households: 31,168 2-persons , 14,075 3-persons , 9,314 4-persons , 4,782 5-persons , 1,354 6-persons , 987 7-or-more-persons .
Size of nonfamily households: 64,392 1-person , 15,377 2-persons , 1,654 3-persons , 1,234 4-persons , 1,187 5-persons , 184 6-persons , 41 7-or-more-persons .
24,149 married couples with children. single-parent households (3,097 men , 23,945 women ).
90.9% of residents of Cincinnati speak English at home. of residents speak Spanish at home (51% speak English very well , 14% speak English well , 24% speak English not well , 10% don't speak English at all ).of residents speak other Indo-European language at home (60% speak English very well , 28% speak English well , 12% speak English not well , 1% don't speak English at all ).of residents speak Asian or Pacific Island language at home (70% speak English very well , 20% speak English well , 8% speak English not well , 1% don't speak English at all ).of residents speak other language at home (60% speak English very well , 27% speak English well , 11% speak English not well , 2% don't speak English at all ).
Foreign born population: 19,140 (6.2%)of them are naturalized citizens )
Median number of rooms in houses and condos:
Median number of rooms in apartments
Owner-occupied Renter-occupied
Bedrooms in owner-occupied houses and condos in Cincinnati, Ohio
198 no bedroom 2,600 1 bedroom 16,208 2 bedrooms 23,268 3 bedrooms 10,732 4 bedrooms 5,381 5+ bedrooms
Bedrooms in renter-occupied apartments in Cincinnati, Ohio
5,984 no bedroom 38,789 1 bedroom 27,065 2 bedrooms 10,421 3 bedrooms 3,493 4 bedrooms 1,610 5+ bedrooms
Owner-occupied Renter-occupied
Cars and other vehicles available in Cincinnati in owner-occupied houses/condos
2,424 no vehicle 18,929 1 vehicle 24,969 2 vehicles 8,048 3 vehicles 2,285 4 vehicles 1,732 5+ vehicles
Cars and other vehicles available in Cincinnati in renter-occupied apartments
24,663 no vehicle 44,120 1 vehicle 13,930 2 vehicles 2,883 3 vehicles 682 4 vehicles 1,084 5+ vehicles
Owner-occupied Renter-occupied
Rooms in owner-occupied houses in Cincinnati, Ohio
198 1 room 101 2 rooms 1,862 3 rooms 5,772 4 rooms 10,034 5 rooms 12,372 6 rooms 9,474 7 rooms 7,878 8 rooms 10,696 9+ rooms
Rooms in renter-occupied apartments in Cincinnati, Ohio
4,153 1 room 7,878 2 rooms 24,745 3 rooms 25,178 4 rooms 11,682 5 rooms 6,220 6 rooms 3,464 7 rooms 2,671 8 rooms 1,371 9+ rooms
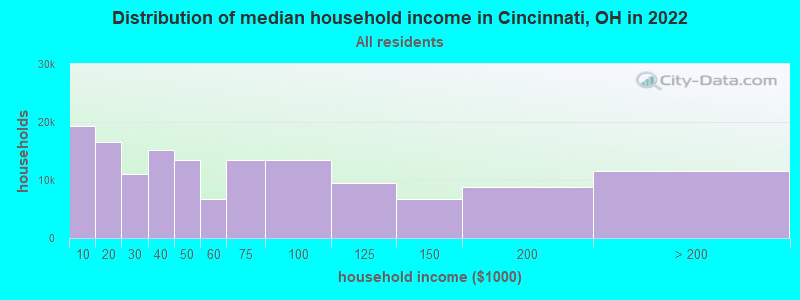
Cincinnati, OH household income distribution 19,328 Less than $10,00016,603 $10,000 to $19,99911,064 $20,000 to $29,99915,135 $30,000 to $39,99913,504 $40,000 to $49,9996,708 $50,000 to $59,99913,447 $60,000 to $74,99913,389 $75,000 to $99,9999,500 $100,000 to $124,9996,720 $125,000 to $149,9998,864 $150,000 to $199,99911,487 $200,000 or more
Home value of owner - occupied houses in 2022 in Cincinnati, OH 142 Less than $10,00065 $10,000 to $14,999117 $15,000 to $19,999204 $20,000 to $24,999172 $30,000 to $34,99936 $35,000 to $39,999340 $40,000 to $49,9991,028 $50,000 to $59,9991,075 $60,000 to $69,9992,527 $70,000 to $79,9991,234 $80,000 to $89,9991,887 $90,000 to $99,9992,914 $100,000 to $124,9994,056 $125,000 to $149,9995,510 $150,000 to $174,9994,052 $175,000 to $199,9996,897 $200,000 to $249,9994,883 $250,000 to $299,9997,851 $300,000 to $399,9994,745 $400,000 to $499,9995,507 $500,000 to $749,9992,369 $750,000 to $999,999745 $1,000,000 to $1,499,99931 $2,000,000 or moreRent paid by renters in 2022 in Cincinnati, OH 1,349 Less than $100455 $100 to $1491,466 $150 to $1992,963 $200 to $2491,166 $250 to $2991,499 $300 to $349963 $350 to $3991,241 $400 to $4492,579 $450 to $4995,252 $500 to $5494,334 $550 to $5993,551 $600 to $6495,164 $650 to $6996,942 $700 to $7496,748 $750 to $7999,711 $800 to $8997,437 $900 to $9998,091 $1,000 to $1,2494,972 $1,250 to $1,4996,008 $1,500 to $1,9991,612 $2,000 to $2,499720 $2,500 to $2,999516 $3,000 to $3,499275 $3,500 or more2,348 No cash rent
Percentage of workers working in this county: 83.9%Number of people working at home: 24,152 (15.2% of all workers )
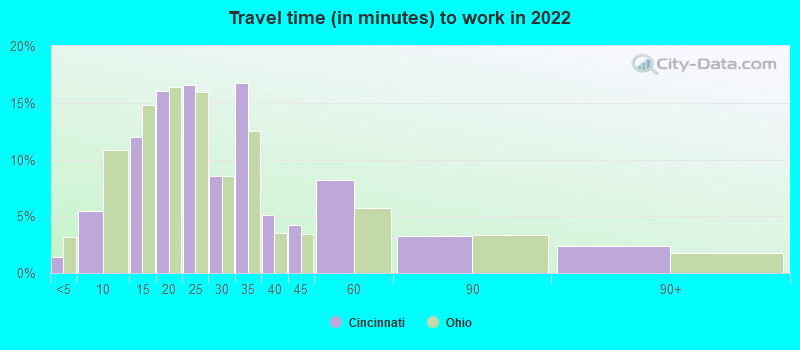
Travel time to work (commute)
Less than 5 minutes: 2,6375 to 9 minutes: 10,07910 to 14 minutes: 21,78415 to 19 minutes: 29,27320 to 24 minutes: 23,29925 to 29 minutes: 12,11430 to 34 minutes: 18,44635 to 39 minutes: 5,26540 to 44 minutes: 1,96345 to 59 minutes: 3,41860 to 89 minutes: 3,50690 or more minutes: 3,125
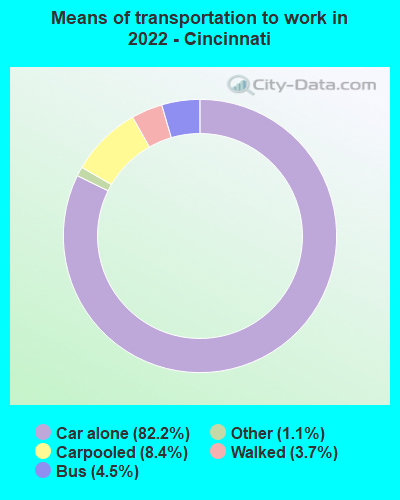
Means of transportation to work:
Drove a car alone: 180,382 (74.0%)Carpooled: 18,357 (7.5%)Bus : 9,984 (4.1%)Taxi: 2,338 (1.0%)Bicycle: 157 (0.1%)Walked: 8,225 (3.4%)Worked at home: 24,152 (9.9%)
Unemployment by race in 2022
Unemployment rate for White non-Hispanic residents 3.4% Males1.7% FemalesUnemployment rate for Black residents 6.8% Males9.7% FemalesUnemployment rate for American Indian and Alaska Native residents 1.9% Males34.6% FemalesUnemployment rate for Asian residents 3.6% Males9.6% FemalesUnemployment rate for other race residents 1.9% Males6.2% FemalesUnemployment rate for two or more race residents 5.5% Males14.5% FemalesUnemployment rate for Hispanic or Latino residents 2.8% Males18.3% Females
Year of entry for the foreign-born population in Cincinnati, Ohio
12,096 2010 or later 4,519 2000 to 2009 2,554 1990 to 1999 1,910 1980 to 1989 1,120 1970 to 1979 1,894 Before 1970
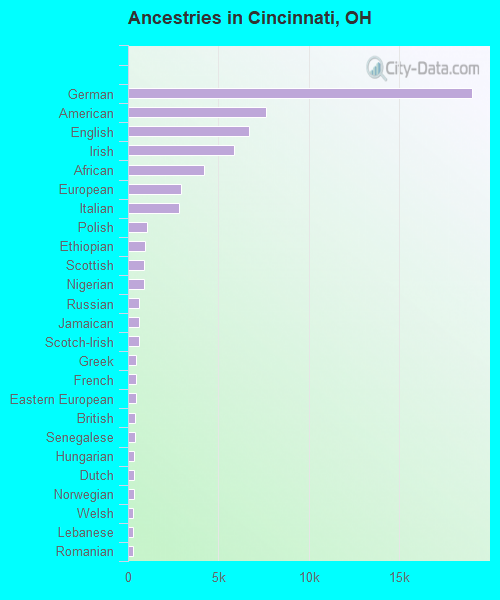
First ancestries reported:
German: 19,018 (11.4%)
American: 7,629 (4.6%)
English: 6,675 (4.0%)
Irish: 5,878 (3.5%)
African: 4,217 (2.5%)
European: 2,937 (1.8%)
Italian: 2,798 (1.7%)
Polish: 1,065 (0.6%)
Ethiopian: 966 (0.6%)
Scottish: 884 (0.5%)
Nigerian: 878 (0.5%)
Russian: 628 (0.4%)
Jamaican: 609 (0.4%)
Scotch-Irish: 594 (0.4%)
Greek: 467 (0.3%)
French: 465 (0.3%)
Eastern European: 463 (0.3%)
British: 401 (0.2%)
Senegalese: 383 (0.2%)
Hungarian: 343 (0.2%)
Dutch: 319 (0.2%)
Norwegian: 308 (0.2%)
Welsh: 270 (0.2%)
Lebanese: 255 (0.2%)
Romanian: 252 (0.2%)
Ukrainian: 251 (0.2%)
Egyptian: 203 (0.1%)
Haitian: 202 (0.1%)
Ghanaian: 200 (0.1%)
French Canadian: 193 (0.1%)
Ugandan: 192 (0.1%)
Iranian: 186 (0.1%)
Slovak: 185 (0.1%)
Northern European: 169 (0.1%)
Turkish: 151 (0.09%)
Canadian: 142 (0.09%)
Lithuanian: 141 (0.08%)
Kenyan: 140 (0.08%)
Afghan: 133 (0.08%)
Brazilian: 121 (0.07%)
Slovene: 118 (0.07%)
Croatian: 117 (0.07%)
Swedish: 116 (0.07%)
Finnish: 99 (0.06%)
Portuguese: 93 (0.06%)
Bulgarian: 88 (0.05%)
Scandinavian: 87 (0.05%)
Sudanese: 81 (0.05%)
Albanian: 73 (0.04%)
Moroccan: 71 (0.04%)
Danish: 69 (0.04%)
Armenian: 65 (0.04%)
Slavic: 56 (0.03%)
Arab: 55 (0.03%)
Czech: 47 (0.03%)
South African: 44 (0.03%)
Zimbabwean: 40 (0.02%)
Belgian: 39 (0.02%)
Serbian: 36 (0.02%)
Macedonian: 35 (0.02%)
Jordanian: 35 (0.02%)
Sierra Leonean: 34 (0.02%)
Swiss: 33 (0.02%)
Palestinian: 29 (0.02%)
Czechoslovakian: 27 (0.02%)
Austrian: 26 (0.02%)
Yugoslavian: 23 (0.01%)
Celtic: 21 (0.01%)
Cajun: 20 (0.01%)
Barbadian: 19 (0.01%)
Australian: 17 (0.01%)
Guyanese: 16 (0.01%)
Icelander: 16 (0.01%)
Israeli: 14 (0.01%)
Alsatian: 12 (0.01%)
Luxembourger: 9 (0.01%)
Most common places of birth for foreign-born residents (%): Guatemala Cincinnati:
8.7% (1,860)Ohio:
1.6% (9,312)
India Cincinnati:
6.2% (1,336)Ohio:
11.6% (66,525)
Ivory Coast Cincinnati:
6.2% (1,327)Ohio:
0.3% (1,682)
China, excluding Hong Kong and Taiwan Cincinnati:
5.2% (1,110)Ohio:
6.2% (35,703)
Mexico Cincinnati:
4.7% (998)Ohio:
7.8% (44,796)
Ethiopia Cincinnati:
4.3% (918)Ohio:
1.5% (8,380)
Jamaica Cincinnati:
4.0% (860)Ohio:
0.7% (4,187)
Nigeria Cincinnati:
3.0% (638)Ohio:
1.2% (7,029)
Other Western Africa Cincinnati:
2.9% (617)Ohio:
0.9% (5,331)
Africa, n.e.c. Cincinnati:
2.7% (584)Ohio:
1.1% (6,096)
Korea Cincinnati:
2.6% (557)Ohio:
2.0% (11,398)
Honduras Cincinnati:
2.5% (537)Ohio:
1.0% (5,553)
Senegal Cincinnati:
2.1% (447)Ohio:
0.5% (3,061)
Other Eastern Africa Cincinnati:
1.9% (416)Ohio:
0.5% (3,042)
Vietnam Cincinnati:
1.9% (406)Ohio:
1.9% (10,960)
Canada Cincinnati:
1.9% (398)Ohio:
2.6% (14,988)
Algeria Cincinnati:
1.7% (372)Ohio:
0.4% (2,052)
Philippines Cincinnati:
1.6% (337)Ohio:
3.1% (17,818)
Place of birth for U.S.-born residents:
This state: 214,517Other state: 72,818Northeast: 13,897Midwest: 17,833South: 34,851West: 6,237 81.8% of Cincinnati residents lived in the same house 1 years ago.
Out of people who lived in different houses, 36.4% lived in this county.
Out of people who lived in different counties, 49.1% lived in Ohio.
Cincinnati:
81.8%State average:
87.8%
Education attainment for males 25 years and older:
No schooling: 1,444Nursery to 4th grade: 2585th and 6th grade: 3777th and 8th grade: 9619th grade: 99410th grade: 2,01411th grade: 1,49612th grade, no diploma: 1,911High school graduate (or equivalency): 22,047Less than 1 year of college: 4,620Some college more than 1 year, no degree: 11,025Associate degree: 6,325Bachelor's degree: 22,745Master's degree: 10,462Professional school degree: 4,198Doctorate degree: 2,629
Education attainment for females 25 years and older:
No schooling: 1,219Nursery to 4th grade: 1835th and 6th grade: 1547th and 8th grade: 1,1539th grade: 68610th grade: 1,93211th grade: 3,71912th grade, no diploma: 2,166High school graduate (or equivalency): 29,368Less than 1 year of college: 5,950Some college more than 1 year, no degree: 12,093Associate degree: 7,981Bachelor's degree: 23,090Master's degree: 12,443Professional school degree: 5,090Doctorate degree: 2,170
Housing units in structures:
One, detached: 63,277One, attached: 8,874Two: 12,7213 or 4: 17,1255 to 9: 10,06410 to 19: 18,53720 to 49: 11,49550 or more: 19,103Mobile homes: 349Housing units lacking complete plumbing facilities in 2022: 3.0%Housing units lacking complete kitchen facilities in 2022: 2.5%House/condo owner moved in on average 11 years ago
Renter moved in on average 2 years ago
Private vs. public school enrollment:
Students in private schools in grades 1 to 8 (elementary and middle school): 6,950 Students in private schools in grades 9 to 12 (high school): 3,883 Students in private undergraduate colleges: 4,430