Ceres, CA (California) Houses and Residents
| Ceres: | $416,322 |
| California: | $715,900 |
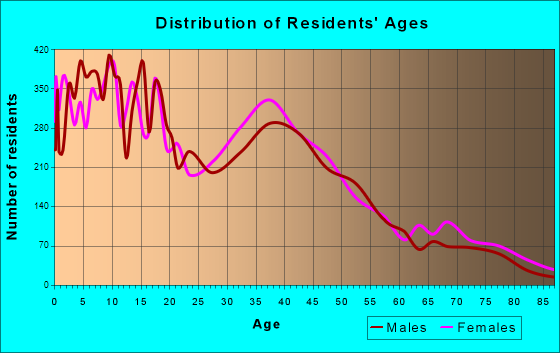
Total population: 47,343 (Urban population: 34,420, Rural population: 114 (all nonfarm))
Houses: 14,082 (13,649 occupied: 8,641 owner occupied, 5,012 renter occupied)
| % of renters here: | 37% |
| State: | 44% |
Housing density: 2,030 houses/condos per square mile
Median price asked for vacant for-sale houses and condos in 2022: $315,334.
Median contract rent in 2022: $1,298 (lower quartile is $902, upper quartile is $1,602)
Median rent asked for vacant for-rent units in 2022: $1,375
Median gross rent in Ceres, CA in 2022: $1,573
Housing units in Ceres with a mortgage: 5,767 (297 second mortgage, 5 home equity loan, 229 both second mortgage and home equity loan)
Houses without a mortgage: 0
Median household income for houses/condos with a mortgage: $92,293
Median household income for apartments without a mortgage: $75,469
Median monthly housing costs: $1,509
Compare current foreclosures in Ceres, CA:
| Photo | Address | Area | Beds / Baths | Price | Details |
|---|---|---|---|---|---|

|
#1
Attika St
Ceres, CA 95307
|
2,924 sq. feet
|
2 baths 4 beds |
show details | |

|
#2
Pleasant Ave
Ceres, CA 95307
|
1,484 sq. feet
|
2 baths 4 beds |
show details | |

|
#3
Gene Rd
Ceres, CA 95307
|
1,006 sq. feet
|
1 baths 2 beds |
show details | |

|
#4
Joy Ave
Ceres, CA 95307
|
1,520 sq. feet
|
1 baths 3 beds |
show details | |

|
#5
Avenida Real
Ceres, CA 95307
|
1,691 sq. feet
|
2 baths 3 beds |
show details | |

|
#6
Sanko Ave
Ceres, CA 95307
|
1,490 sq. feet
|
2 baths 3 beds |
show details | |

|
#7
Allacante Dr
Ceres, CA 95307
|
1,440 sq. feet
|
2 baths 4 beds |
show details | |

|
#8
Poppy Ln
Ceres, CA 95307
|
1,235 sq. feet
|
2 baths 3 beds |
show details | |

|
#9
Poppy Ln
Ceres, CA 95307
|
1,296 sq. feet
|
2 baths 3 beds |
show details | |

|
#10
Vanessa Ct
Ceres, CA 95307
|
1,850 sq. feet
|
2 baths 4 beds |
show details |
| Photo | Address | Area | Beds / Baths | Price | Details |
|---|---|---|---|---|---|

|
#11
Don Pedro Ct
Ceres, CA 95307
|
1,856 sq. feet
|
2 baths 3 beds |
show details | |

|
#12
Sagittarius Ave
Ceres, CA 95307
|
1,360 sq. feet
|
2 baths 3 beds |
show details | |

|
#13
Mcneil Dr
Ceres, CA 95307
|
2,379 sq. feet
|
3 baths 4 beds |
show details | |

|
#14
Sungate Dr
Ceres, CA 95307
|
1,916 sq. feet
|
3 baths 4 beds |
show details | |

|
#15
Malik Ave
Ceres, CA 95307
|
1,614 sq. feet
|
2 baths 4 beds |
show details | |

|
#16
Kinser Rd
Ceres, CA 95307
|
1,166 sq. feet
|
2 baths 2 beds |
show details | |

|
#17
Bavil Dr
Ceres, CA 95307
|
1,296 sq. feet
|
2 baths 3 beds |
show details | |

|
#18
Lunar Dr
Ceres, CA 95307
|
1,092 sq. feet
|
2 baths 3 beds |
show details | |

|
#19
Nimrood Dr
Ceres, CA 95307
|
1,358 sq. feet
|
2 baths 4 beds |
show details | |

|
#20
Waynesboro Dr
Ceres, CA 95307
|
1,797 sq. feet
|
2 baths 3 beds |
show details |
| Photo | Address | Area | Beds / Baths | Price | Details |
|---|---|---|---|---|---|

|
#21
Flower Garden Ct
Ceres, CA 95307
|
1,558 sq. feet
|
2 baths 3 beds |
show details | |

|
#22
Suffolk Dr
Ceres, CA 95307
|
1,606 sq. feet
|
2 baths 4 beds |
show details | |

|
#23
Mauna Loa Dr
Ceres, CA 95307
|
1,590 sq. feet
|
2 baths 3 beds |
show details | |

|
#24
Senimi Cir
Ceres, CA 95307
|
2,432 sq. feet
|
2 baths 3 beds |
show details | |

|
#25
Belleza Dr
Ceres, CA 95307
|
2,212 sq. feet
|
3 baths 4 beds |
show details | |

|
#26
Podocarpus Dr
Ceres, CA 95307
|
2,143 sq. feet
|
2 baths 4 beds |
show details | |

|
#27
Podocarpus Dr
Ceres, CA 95307
|
1,969 sq. feet
|
2 baths 4 beds |
show details | |

|
#28
Oasis Ave
Ceres, CA 95307
|
1,152 sq. feet
|
2 baths 3 beds |
show details | |

|
#29
Georgeann Pl
Ceres, CA 95307
|
1,701 sq. feet
|
2 baths 4 beds |
show details | |

|
#30
Moonlight Dr
Ceres, CA 95307
|
1,271 sq. feet
|
2 baths 3 beds |
show details |
| Photo | Address | Area | Beds / Baths | Price | Details |
|---|---|---|---|---|---|

|
#31
Faith Home Rd
Ceres, CA 95307
|
- sq. feet
|
3 baths 5 beds |
show details | |

|
#32
Boothe Rd
Ceres, CA 95307
|
- sq. feet
|
- baths - beds |
show details | |

|
#33
Fowler Rd Spc
Ceres, CA 95307
|
- sq. feet
|
- baths - beds |
show details | |

|
#34
7th St Apt C
Ceres, CA 95307
|
- sq. feet
|
- baths - beds |
show details | |

|
#35
Foote Rd
Ceres, CA 95307
|
- sq. feet
|
- baths - beds |
show details | |

|
#36
Dupre Dr
Ceres, CA 95307
|
- sq. feet
|
- baths - beds |
show details | |

|
#37
Blaker Rd Apt 303
Ceres, CA 95307
|
- sq. feet
|
- baths - beds |
show details | |

|
#38
Travesia Ln
Ceres, CA 95307
|
- sq. feet
|
- baths - beds |
show details | |

|
#39
Lindsay Way
Ceres, CA 95307
|
- sq. feet
|
- baths - beds |
show details | |

|
#40
Central Ave
Ceres, CA 95307
|
- sq. feet
|
- baths - beds |
show details |
| Photo | Address | Area | Beds / Baths | Price | Details |
|---|---|---|---|---|---|

|
#41
Rockefeller Dr
Ceres, CA 95307
|
- sq. feet
|
- baths - beds |
show details | |

|
#42
Giant Oak Ln
Ceres, CA 95307
|
- sq. feet
|
- baths - beds |
show details | |

|
#43
Starke Dr
Ceres, CA 95307
|
- sq. feet
|
- baths - beds |
show details | |

|
#44
Spruce Ave
Ceres, CA 95307
|
- sq. feet
|
- baths - beds |
show details | |

|
Check over 1 million property listings on Foreclosure.com!
|
browse all offers | |||

Latest news about housing in Ceres, CA collected exclusively by city-data.com from local newspapers, TV, and radio stations

 | The Bay Area Soiled/Homeless/Infested/Trashed Containment Thread (1266 replies) |
| Denver to Modesto area (39 replies) |
| Cheapest place to rent anywhere in CA (42 replies) |
| Starting a Job In Ceres - Where to Live (18 replies) |
| Dublin, Pleasanton, Tracey or Livermore? (33 replies) |
| CalPERS to post pensioner's names and pension amounts online (184 replies) |
Median year apartment built: 1985
Household type by relationship:
Households: 49,112- Male householders: 6,845 (1,261 living alone), Female householders: 6,684 (985 living alone)
7,042 spouses (6,998 opposite-sex spouses), 947 unmarried partners, (931 opposite-sex unmarried partners), 18,250 children (17,492 natural, 121 adopted, 636 stepchildren), 2,156 grandchildren, 1,448 brothers or sisters, 1,496 parents, 0 foster children, 2,208 other relatives, 1,372 non-relatives
- In group quarters: 658
Size of family households: 3,029 2-persons, 1,850 3-persons, 2,376 4-persons, 1,496 5-persons, 1,005 6-persons, 1,060 7-or-more-persons.
Size of nonfamily households: 2,239 1-person, 486 2-persons, 47 3-persons, 8 4-persons, 62 5-persons.
8,070 married couples with children.
3,098 single-parent households (629 men, 2,469 women).
41.0% of residents of Ceres speak English at home.
48.8% of residents speak Spanish at home (60% speak English very well, 11% speak English well, 21% speak English not well, 8% don't speak English at all).
6.3% of residents speak other Indo-European language at home (38% speak English very well, 31% speak English well, 22% speak English not well, 10% don't speak English at all).
2.5% of residents speak Asian or Pacific Island language at home (46% speak English very well, 24% speak English well, 18% speak English not well, 12% don't speak English at all).
1.4% of residents speak other language at home (70% speak English very well, 20% speak English well, 9% speak English not well).
Foreign born population: 13,848 (28.2%)
(44.2% of them are naturalized citizens)
| Here: | 6.0 |
| State: | 6.0 |
| Here: | 4.8 |
| State: | 3.9 |

- Bedrooms in owner-occupied houses and condos in Ceres, California
- 39no bedroom
- 1991 bedroom
- 8192 bedrooms
- 4,6673 bedrooms
- 2,3954 bedrooms
- 5225+ bedrooms

- Bedrooms in renter-occupied apartments in Ceres, California
- 84no bedroom
- 5851 bedroom
- 1,3342 bedrooms
- 2,1163 bedrooms
- 7884 bedrooms
- 1055+ bedrooms

- Cars and other vehicles available in Ceres in owner-occupied houses/condos
- 384no vehicle
- 1,5941 vehicle
- 2,9442 vehicles
- 2,1863 vehicles
- 1,0144 vehicles
- 5205+ vehicles

- Cars and other vehicles available in Ceres in renter-occupied apartments
- 277no vehicle
- 1,6461 vehicle
- 1,8792 vehicles
- 7573 vehicles
- 3884 vehicles
- 665+ vehicles

- Rooms in owner-occupied houses in Ceres, California
- 301 room
- 1072 rooms
- 1563 rooms
- 7764 rooms
- 2,1775 rooms
- 2,8956 rooms
- 1,3407 rooms
- 7398 rooms
- 4219+ rooms

- Rooms in renter-occupied apartments in Ceres, California
- 841 room
- 1022 rooms
- 6343 rooms
- 1,1354 rooms
- 1,5825 rooms
- 8386 rooms
- 3717 rooms
- 2078 rooms
- 609+ rooms


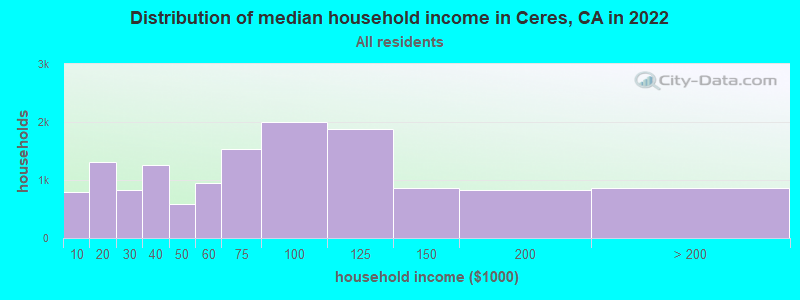
Ceres, CA household income distribution

- 797Less than $10,000
- 1,302$10,000 to $19,999
- 832$20,000 to $29,999
- 1,251$30,000 to $39,999
- 582$40,000 to $49,999
- 953$50,000 to $59,999
- 1,541$60,000 to $74,999
- 2,003$75,000 to $99,999
- 1,878$100,000 to $124,999
- 864$125,000 to $149,999
- 830$150,000 to $199,999
- 870$200,000 or more
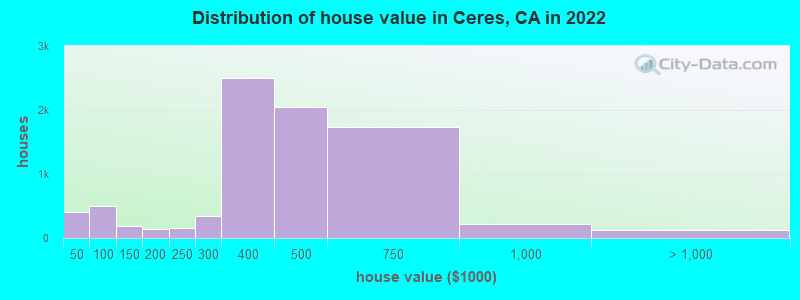
Home value of owner - occupied houses in 2022 in Ceres, CA
-
- 202Less than $10,000
- 36$10,000 to $14,999
- 33$15,000 to $19,999
- 58$20,000 to $24,999
- 20$25,000 to $29,999
- 33$30,000 to $34,999
- 29$35,000 to $39,999
- 4$50,000 to $59,999
- 100$70,000 to $79,999
- 230$80,000 to $89,999
- 167$90,000 to $99,999
- 184$100,000 to $124,999
- 8$125,000 to $149,999
- 116$150,000 to $174,999
- 29$175,000 to $199,999
- 158$200,000 to $249,999
- 335$250,000 to $299,999
- 2,504$300,000 to $399,999
- 2,052$400,000 to $499,999
- 1,737$500,000 to $749,999
- 218$750,000 to $999,999
- 93$1,000,000 to $1,499,999
- 30$2,000,000 or more
Rent paid by renters in 2022 in Ceres, CA
-
- 31Less than $100
- 37$100 to $149
- 84$200 to $249
- 46$250 to $299
- 19$300 to $349
- 14$350 to $399
- 29$400 to $449
- 45$450 to $499
- 42$500 to $549
- 171$550 to $599
- 21$600 to $649
- 56$650 to $699
- 122$700 to $749
- 47$750 to $799
- 217$800 to $899
- 356$900 to $999
- 640$1,000 to $1,249
- 1,115$1,250 to $1,499
- 1,138$1,500 to $1,999
- 197$2,000 to $2,499
- 41$2,500 to $2,999
- 57$3,500 or more
- 163No cash rent


Percentage of workers working in this county: 75.2%
Number of people working at home: 761 (4.0% of all workers)
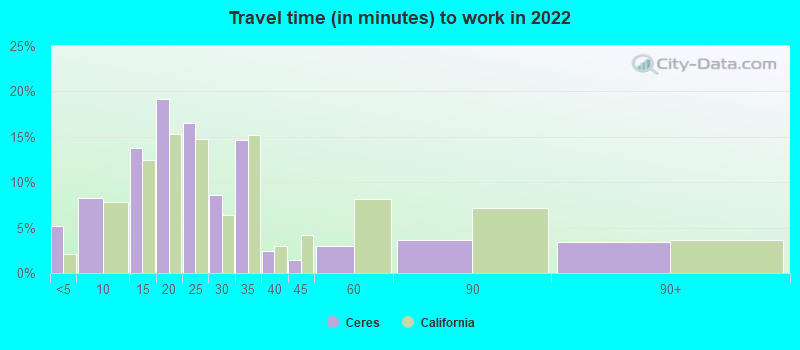
Travel time to work (commute)
- Less than 5 minutes: 488
- 5 to 9 minutes: 1,588
- 10 to 14 minutes: 2,188
- 15 to 19 minutes: 3,029
- 20 to 24 minutes: 2,469
- 25 to 29 minutes: 1,709
- 30 to 34 minutes: 2,005
- 35 to 39 minutes: 479
- 40 to 44 minutes: 455
- 45 to 59 minutes: 1,221
- 60 to 89 minutes: 883
- 90 or more minutes: 1,825
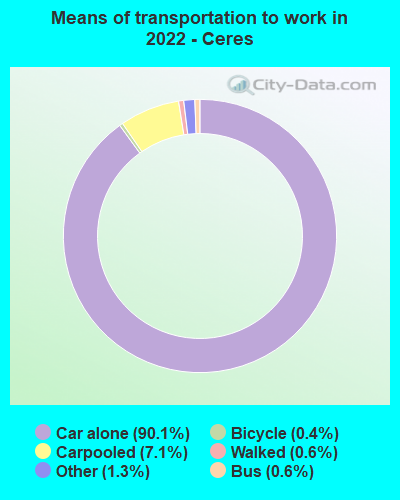
Means of transportation to work:
- Drove a car alone: 11,582 (82.8%)
- Carpooled: 1,096 (7.8%)
- Bus: 124 (0.9%)
- Taxi: 179 (1.3%)
- Bicycle: 45 (0.3%)
- Walked: 95 (0.7%)
- Worked at home: 761 (5.4%)

- Unemployment by race in 2022
- Unemployment rate for White non-Hispanic residents
- 12.4%Males
- 8.6%Females
- Unemployment rate for Black residents
- 28.5%Males
- 20.7%Females
- Unemployment rate for American Indian and Alaska Native residents
- 18.3%Males
- 38.2%Females
- Unemployment rate for Asian residents
- 12.3%Males
- 2.6%Females
- Unemployment rate for other race residents
- 4.0%Males
- 7.2%Females
- Unemployment rate for two or more race residents
- 8.9%Males
- 11.9%Females
- Unemployment rate for Hispanic or Latino residents
- 5.5%Males
- 10.3%Females

- Year of entry for the foreign-born population in Ceres, California
- 2,0312010 or later
- 3,5322000 to 2009
- 3,8841990 to 1999
- 2,0851980 to 1989
- 1,6891970 to 1979
- 801Before 1970

First ancestries reported:
- American: 679 (2.0%)
- English: 656 (1.9%)
- Portuguese: 458 (1.3%)
- German: 437 (1.3%)
- Italian: 312 (0.9%)
- Irish: 258 (0.7%)
- European: 126 (0.4%)
- Assyrian: 68 (0.2%)
- Danish: 61 (0.2%)
- French Canadian: 59 (0.2%)
- French: 57 (0.2%)
- Russian: 55 (0.2%)
- Ghanaian: 54 (0.2%)
- Scottish: 51 (0.1%)
- Dutch: 50 (0.1%)
- African: 49 (0.1%)
- Northern European: 45 (0.1%)
- Scotch-Irish: 44 (0.1%)
- Greek: 31 (0.09%)
- Norwegian: 30 (0.09%)
- Scandinavian: 18 (0.05%)
- Welsh: 17 (0.05%)
- Eastern European: 16 (0.05%)
- Pennsylvania German: 16 (0.05%)
- Canadian: 15 (0.04%)
- Jamaican: 14 (0.04%)
- Swedish: 13 (0.04%)
- Ukrainian: 10 (0.03%)
- British: 8 (0.02%)
Most common places of birth for foreign-born residents (%):
| Ceres: | 71.1% (9,527) |
| California: | 37.2% (3,881,193) |
| Ceres: | 9.4% (1,261) |
| California: | 5.2% (539,184) |
| Ceres: | 2.1% (285) |
| California: | 0.5% (51,974) |
| Ceres: | 1.7% (227) |
| California: | 0.6% (65,335) |
| Ceres: | 1.5% (206) |
| California: | 7.8% (818,297) |
Place of birth for U.S.-born residents:
- This state: 31,305
- Other state: 3,590
- Northeast: 353
- Midwest: 942
- South: 1,436
- West: 847
89.4% of Ceres residents lived in the same house 1 years ago.
Out of people who lived in different houses, 41.5% lived in this county.
Out of people who lived in different counties, 63.5% lived in California.
| Ceres: | 89.4% |
| State average: | 88.9% |
Education attainment for males 25 years and older:
- No schooling: 1,155
- Nursery to 4th grade: 247
- 5th and 6th grade: 1,065
- 7th and 8th grade: 602
- 9th grade: 313
- 10th grade: 136
- 11th grade: 317
- 12th grade, no diploma: 394
- High school graduate (or equivalency): 5,985
- Less than 1 year of college: 890
- Some college more than 1 year, no degree: 2,381
- Associate degree: 1,014
- Bachelor's degree: 936
- Master's degree: 272
- Professional school degree: 111
- Doctorate degree: 2

Education attainment for females 25 years and older:
- No schooling: 921
- Nursery to 4th grade: 157
- 5th and 6th grade: 894
- 7th and 8th grade: 291
- 9th grade: 156
- 10th grade: 138
- 11th grade: 322
- 12th grade, no diploma: 560
- High school graduate (or equivalency): 4,713
- Less than 1 year of college: 1,171
- Some college more than 1 year, no degree: 2,088
- Associate degree: 1,129
- Bachelor's degree: 1,520
- Master's degree: 350
- Professional school degree: 28
- Doctorate degree: 45

Housing units in structures:
- One, detached: 10,984
- One, attached: 440
- Two: 139
- 3 or 4: 346
- 5 to 9: 243
- 10 to 19: 193
- 20 to 49: 87
- 50 or more: 710
- Mobile homes: 827
- Boats, RVs, vans, etc.: 110
Median worth of mobile homes: $105,459
Housing units lacking complete kitchen facilities in 2022: 1.6%
House/condo owner moved in on average 11 years ago
Renter moved in on average 6 years ago

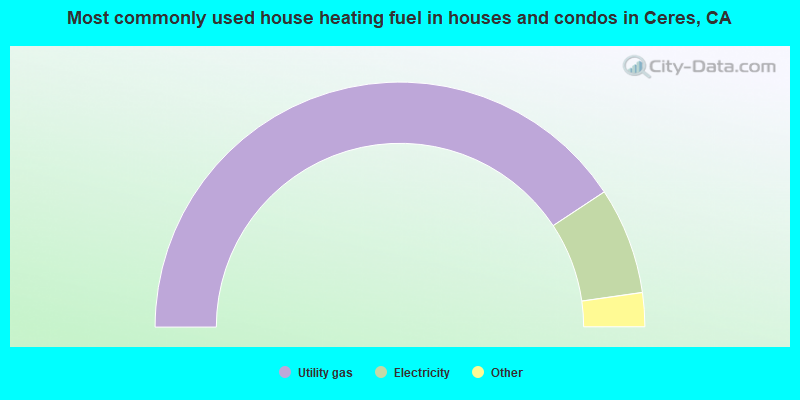
- 81.4%Utility gas
- 14.1%Electricity
- 2.1%Solar energy
- 1.4%Bottled, tank, or LP gas
- 0.6%Wood
- 0.3%No fuel used
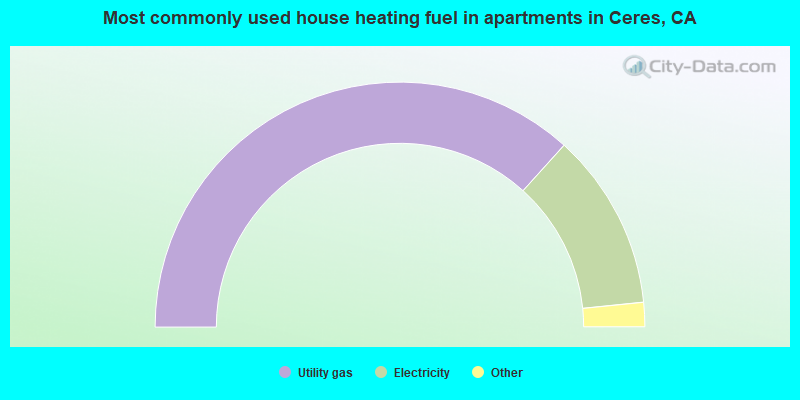
- 73.4%Utility gas
- 23.4%Electricity
- 2.6%No fuel used
- 0.4%Bottled, tank, or LP gas
- 0.1%Solar energy
Private vs. public school enrollment:
| Here: | 6.4% |
| California: | 10.5% |
| Here: | 8.5% |
| California: | 8.5% |
| Here: | 6.9% |
| California: | 15.9% |


