Central Point, OR (Oregon) Houses and Residents
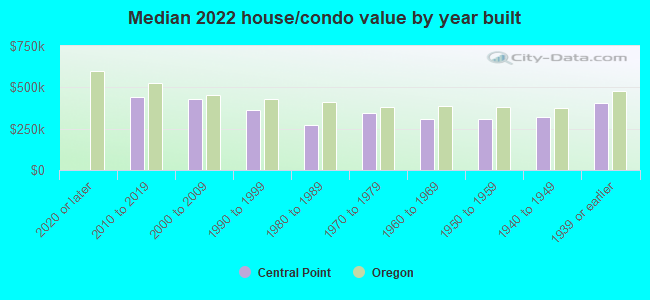
Estimated median house or condo value in 2022: $373,049 (it was $121,800 in 2000 )
Central Point:
$373,049Oregon:
$475,600
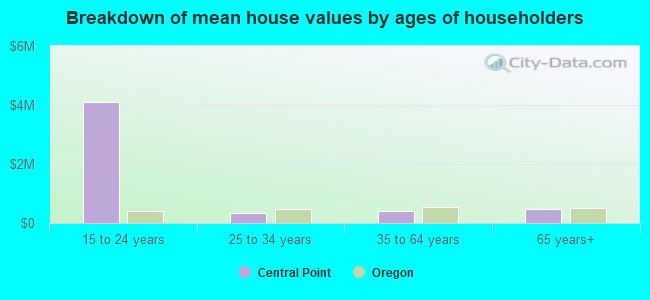
Lower value quartile - upper value quartile: $307,140 - $465,382Mean price in 2022: Detached houses: $426,015 Here:
$426,015State:
$562,872
Townhouses or other attached units: $309,534 Here:
$309,534State:
$463,029
Mobile homes: $111,548 Here:
$111,548State:
$214,044
Total population: 17,724 (Urban population: 12,438, Rural population: 0)
Houses: 7,727 (7,511 occupied: 5,238 owner occupied, 2,378 renter occupied )
% of renters here:
31%State:
37%
Housing density: 2,520 houses/condos per square mile
Median price asked for vacant for-sale houses and condos in 2022 in this county: $473,144.
Median contract rent in 2022: $1,181 (lower quartile is $944, upper quartile is $1,660)
Median rent asked for vacant for-rent units in 2022: $5,632
Median gross rent in Central Point, OR in 2022: $1,273
Housing units in Central Point with a mortgage: 3,837 (413 second mortgage, 0 home equity loan, 366 both second mortgage and home equity loan )Houses without a mortgage: 0
Median household income for houses/condos with a mortgage: $100,144
Median household income for apartments without a mortgage: $75,706
Median monthly housing costs: $1,356
Data:
Median house or condo value ($)
Median house or condo value ($ change since 2000)
Median house or condo value ($) - White
Median house or condo value ($) - Black or African American
Median house or condo value ($) - Asian
Median house or condo value ($) - Hispanic or Latino
Median house or condo value ($) - American Indian and Alaska Native
Median house or condo value ($) - Multirace
Median house or condo value ($) - Other Race
Median price asked for mobile homes ($)
Household density (households per square mile)
Mean house or condo value by units in structure - 1, detached ($)
Mean house or condo value by units in structure - 1, attached ($)
Mean house or condo value by units in structure - 2 ($)
Mean house or condo value by units in structure by units in structure - 3 or 4 ($)
Mean house or condo value by units in structure - 5 or more ($)
Mean house or condo value by units in structure - Boat, RV, van, etc. ($)
Mean house or condo value by units in structure - Mobile home ($)
Median contract rent ($)
Median contract rent - Lower quartile ($)
Median contract rent - Upper quartile ($)
Median gross rent ($)
Urban houses (%)
Rural houses (%)
Houses occupied (%)
Houses occupied (% change since 2000)
Houses owner occupied (%)
Houses owner occupied (% change since 2000)
Houses renter occupied (%)
Houses renter occupied (% change since 2000)
Vacant housing units - For rent (%)
Vacant housing units - For rent (% change since 2000)
Vacant housing units - For sale only (%)
Vacant housing units - For sale only (% change since 2000)
Vacant housing units - Rented or sold, not occupied (%)
Vacant housing units - Rented or sold, not occupied (% change since 2000)
Vacant housing units - For seasonal, recreational, or occasional use (%)
Vacant housing units - For seasonal, recreational, or occasional use (% change since 2000)
Vacant housing units - For migrant workers (%)
Vacant housing units - For migrant workers (% change since 2000)
Vacant housing units - Other vacant (%)
Vacant housing units - Other vacant (% change since 2000)
Median monthly housing costs ($)
Median household income for houses/condos with a mortgage ($)
Median household income for houses/condos without a mortgage ($)
Median household income ($)
Median household income ($) - White
Median household income ($) - Black or African American
Median household income ($) - Asian
Median household income ($) - Hispanic or Latino
Median household income ($) - American Indian and Alaska Native
Median household income ($) - Multirace
Median household income ($) - Other Race
Mortgage status - with mortgage (%)
Mortgage status - with second mortgage (%)
Mortgage status - with home equity loan (%)
Mortgage status - with both second mortgage and home equity loan (%)
Mortgage status - without a mortgage (%)
Median year house/condo built
Median year apartment built
Household type by relationship - Male householder living alone (%)
Household type by relationship - Male householder not living alone (%)
Household type by relationship - Female householder living alone (%)
Household type by relationship - Female householder not living alone (%)
Household type by relationship - Opposite-Sex spouse (%)
Household type by relationship - Same-Sex spouse (%)
Household type by relationship - Opposite-Sex unmarried partner (%)
Household type by relationship - Same-Sex unmarried partner (%)
Household type by relationship - In group quarters (%)
Size of family households - 2-person household (%)
Size of family households - 3-person household (%)
Size of family households - 4-person household (%)
Size of family households - 5-person household (%)
Size of family households - 6-person household (%)
Size of family households - 7-or-more-person household (%)
Size of nonfamily households - 1-person household (%)
Size of nonfamily households - 2-person household (%)
Size of nonfamily households - 3-person household (%)
Size of nonfamily households - 4-person household (%)
Size of nonfamily households - 5-person household (%)
Size of nonfamily households - 6-person household (%)
Size of nonfamily households - 7-or-moreperson household (%)
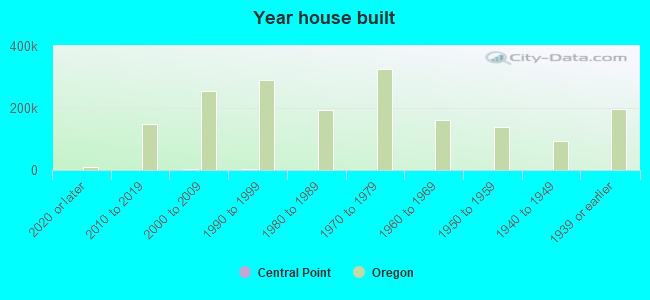
Year house built - Built 2010 or later (%)
Year house built - Built 2000 to 2009 (%)
Year house built - Built 1990 to 1999 (%)
Year house built - Built 1980 to 1989 (%)
Year house built - Built 1970 to 1979 (%)
Year house built - Built 1960 to 1969 (%)
Year house built - Built 1950 to 1959 (%)
Year house built - Built 1940 to 1949 (%)
Year house built - Built 1939 or earlier (%)
Median number of rooms in houses and condos
Median number of rooms in apartments
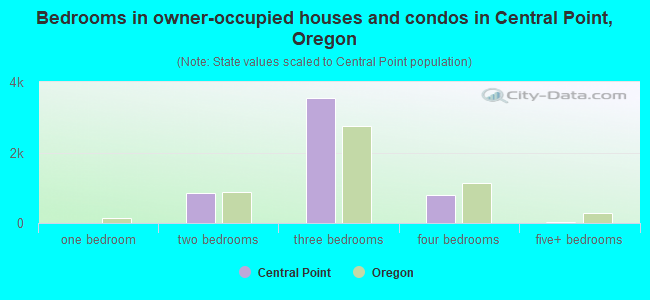
Median number of bedrooms in owner occupied houses
Mean number of bedrooms in owner occupied houses
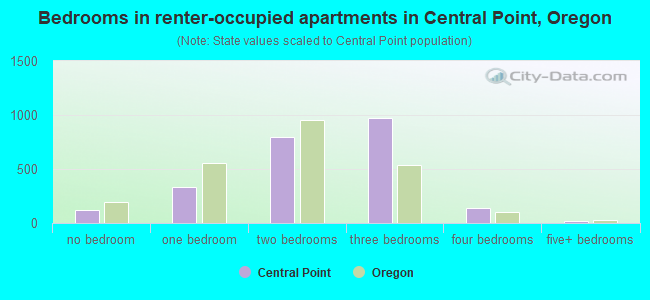
Median number of bedrooms in renter occupied houses
Mean number of bedrooms in renter occupied houses
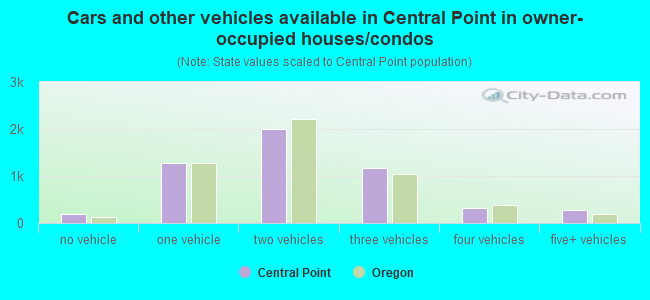
Median number of vehichles in owner occupied houses
Mean number of vehichles in owner occupied houses
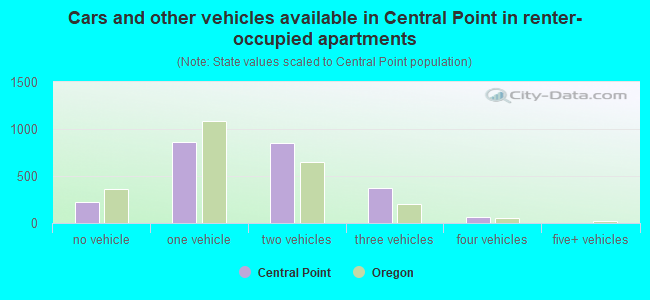
Median number of vehichles in renter occupied houses
Mean number of vehichles in renter occupied houses
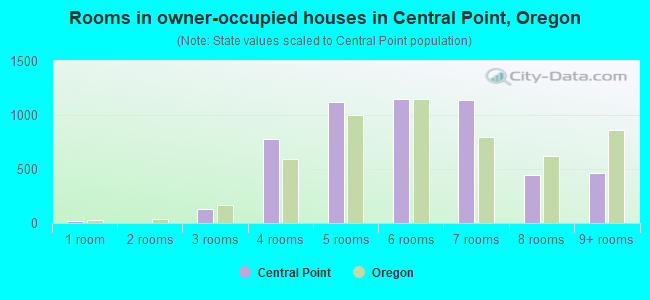
Rooms in owner-occupied houses - 1 room (%)
Rooms in owner-occupied houses - 2 rooms (%)
Rooms in owner-occupied houses - 3 rooms (%)
Rooms in owner-occupied houses - 4 rooms (%)
Rooms in owner-occupied houses - 5 rooms (%)
Rooms in owner-occupied houses - 6 rooms (%)
Rooms in owner-occupied houses - 7 rooms (%)
Rooms in owner-occupied houses - 8 rooms (%)
Rooms in owner-occupied houses - 9+ rooms (%)
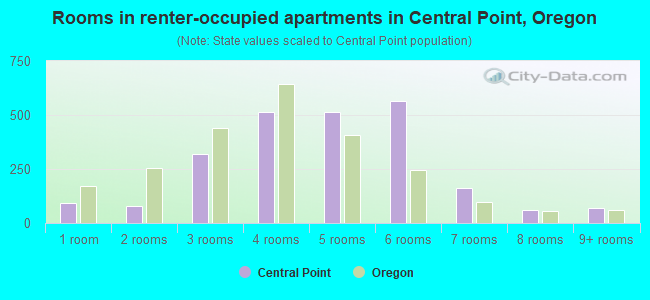
Rooms in renter-occupied houses - 1 room (%)
Rooms in renter-occupied houses - 2 rooms (%)
Rooms in renter-occupied houses - 3 rooms (%)
Rooms in renter-occupied houses - 4 rooms (%)
Rooms in renter-occupied houses - 5 rooms (%)
Rooms in renter-occupied houses - 6 rooms (%)
Rooms in renter-occupied houses - 7 rooms (%)
Rooms in renter-occupied houses - 8 rooms (%)
Rooms in renter-occupied houses - 9+ rooms (%)
Bedrooms in owner-occupied houses - no bedrooms (%)
Bedrooms in owner-occupied houses - 1 bedroom (%)
Bedrooms in owner-occupied houses - 2 bedrooms (%)
Bedrooms in owner-occupied houses - 3 bedrooms (%)
Bedrooms in owner-occupied houses - 4 bedrooms (%)
Bedrooms in owner-occupied houses - 5+ bedrooms (%)
Bedrooms in renter-occupied houses - no bedrooms (%)
Bedrooms in renter-occupied houses - 1 bedroom (%)
Bedrooms in renter-occupied houses - 2 bedrooms (%)
Bedrooms in renter-occupied houses - 3 bedrooms (%)
Bedrooms in renter-occupied houses - 4 bedrooms (%)
Bedrooms in renter-occupied houses - 5+ bedrooms (%)
Vehicles available in owner-occupied houses - no vehicle available (%)
Vehicles available in owner-occupied houses - 1 vehicle available(%)
Vehicles available in owner-occupied houses - 2 Vehicles available (%)
Vehicles available in owner-occupied houses - 3 Vehicles available (%)
Vehicles available in owner-occupied houses - 4 Vehicles available (%)
Vehicles available in owner-occupied houses - 5+ Vehicles available (%)
Vehicles available in renter-occupied houses - no vehicle available (%)
Vehicles available in renter-occupied houses - 1 vehicle available (%)
Vehicles available in renter-occupied houses - 2 Vehicles available (%)
Vehicles available in renter-occupied houses - 3 Vehicles available (%)
Vehicles available in renter-occupied houses - 4 Vehicles available (%)
Vehicles available in renter-occupied houses - 5+ Vehicles available (%)
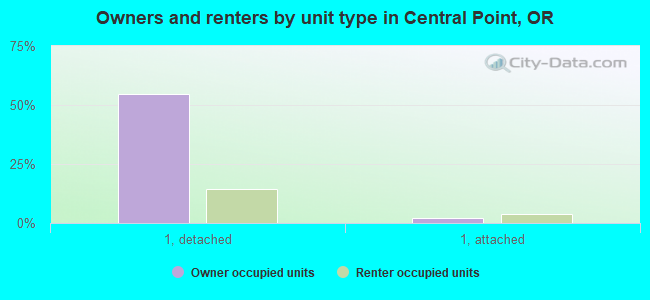
Housing units in structures - 1, detached (%)
Housing units in structures - 1, attached (%)
Housing units in structures - 2 (%)
Housing units in structures - 3 or 4 (%)
Housing units in structures - 5 to 9 (%)
Housing units in structures - 10 to 19 (%)
Housing units in structures - 20 to 49 (%)
Housing units in structures - 50 or more (%)
Housing units in structures - Mobile home (%)
Housing units in structures - Boat, RV, van, etc. (%)
Housing units in structures - Owners - 1, detached (%)
Housing units in structures - Owners - 1, attached (%)
Housing units in structures - Owners - 2 (%)
Housing units in structures - Owners - 3 or 4 (%)
Housing units in structures - Owners - 5 to 9 (%)
Housing units in structures - Owners - 10 to 19 (%)
Housing units in structures - Owners - 20 to 49 (%)
Housing units in structures - Owners - 50 or more (%)
Housing units in structures - Owners - Mobile home (%)
Housing units in structures - Owners - Boat, RV, van, etc. (%)
Housing units in structures - Renters - 1, detached (%)
Housing units in structures - Renters - 1, attached (%)
Housing units in structures - Renters - 2 (%)
Housing units in structures - Renters - 3 or 4 (%)
Housing units in structures - Renters - 5 to 9 (%)
Housing units in structures - Renters - 10 to 19 (%)
Housing units in structures - Renters - 20 to 49 (%)
Housing units in structures - Renters - 50 or more (%)
Housing units in structures - Renters - Mobile home (%)
Housing units in structures - Renters - Boat, RV, van, etc. (%)
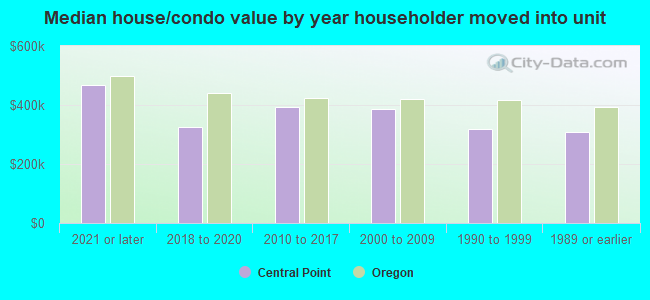
House/condo owner moved in on average (years ago)
Renter moved in on average (years ago)
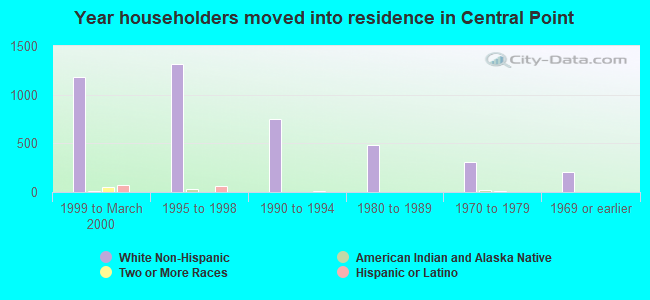
Year householder moved into unit - Moved in 1999 to March 2000 (%)
Year householder moved into unit - Moved in 1999 to March 2000 (%) - White
Year householder moved into unit - Moved in 1999 to March 2000 (%) - Black or African American
Year householder moved into unit - Moved in 1999 to March 2000 (%) - Asian
Year householder moved into unit - Moved in 1999 to March 2000 (%) - Hispanic or Latino
Year householder moved into unit - Moved in 1999 to March 2000 (%) - American Indian and Alaska Native
Year householder moved into unit - Moved in 1999 to March 2000 (%) - Multirace
Year householder moved into unit - Moved in 1999 to March 2000 (%) - Other Race
Year householder moved into unit - Moved in 1995 to 1998 (%)
Year householder moved into unit - Moved in 1995 to 1998 (%) - White
Year householder moved into unit - Moved in 1995 to 1998 (%) - Black or African American
Year householder moved into unit - Moved in 1995 to 1998 (%) - Asian
Year householder moved into unit - Moved in 1995 to 1998 (%) - Hispanic or Latino
Year householder moved into unit - Moved in 1995 to 1998 (%) - American Indian and Alaska Native
Year householder moved into unit - Moved in 1995 to 1998 (%) - Multirace
Year householder moved into unit - Moved in 1995 to 1998 (%) - Other Race
Year householder moved into unit - Moved in 1990 to 1994 (%)
Year householder moved into unit - Moved in 1990 to 1994 (%) - White
Year householder moved into unit - Moved in 1990 to 1994 (%) - Black or African American
Year householder moved into unit - Moved in 1990 to 1994 (%) - Asian
Year householder moved into unit - Moved in 1990 to 1994 (%) - Hispanic or Latino
Year householder moved into unit - Moved in 1990 to 1994 (%) - American Indian and Alaska Native
Year householder moved into unit - Moved in 1990 to 1994 (%) - Multirace
Year householder moved into unit - Moved in 1990 to 1994 (%) - Other Race
Year householder moved into unit - Moved in 1980 to 1989 (%)
Year householder moved into unit - Moved in 1980 to 1989 (%) - White
Year householder moved into unit - Moved in 1980 to 1989 (%) - Black or African American
Year householder moved into unit - Moved in 1980 to 1989 (%) - Asian
Year householder moved into unit - Moved in 1980 to 1989 (%) - Hispanic or Latino
Year householder moved into unit - Moved in 1980 to 1989 (%) - American Indian and Alaska Native
Year householder moved into unit - Moved in 1980 to 1989 (%) - Multirace
Year householder moved into unit - Moved in 1980 to 1989 (%) - Other Race
Year householder moved into unit - Moved in 1970 to 1979 (%)
Year householder moved into unit - Moved in 1970 to 1979 (%) - White
Year householder moved into unit - Moved in 1970 to 1979 (%) - Black or African American
Year householder moved into unit - Moved in 1970 to 1979 (%) - Asian
Year householder moved into unit - Moved in 1970 to 1979 (%) - Hispanic or Latino
Year householder moved into unit - Moved in 1970 to 1979 (%) - American Indian and Alaska Native
Year householder moved into unit - Moved in 1970 to 1979 (%) - Multirace
Year householder moved into unit - Moved in 1970 to 1979 (%) - Other Race
Year householder moved into unit - Moved in 1969 or earlier (%)
Year householder moved into unit - Moved in 1969 or earlier (%) - White
Year householder moved into unit - Moved in 1969 or earlier (%) - Black or African American
Year householder moved into unit - Moved in 1969 or earlier (%) - Asian
Year householder moved into unit - Moved in 1969 or earlier (%) - Hispanic or Latino
Year householder moved into unit - Moved in 1969 or earlier (%) - American Indian and Alaska Native
Year householder moved into unit - Moved in 1969 or earlier (%) - Multirace
Year householder moved into unit - Moved in 1969 or earlier (%) - Other Race
Housing units lacking complete plumbing facilities (%)
Housing units lacking complete kitchen facilities (%)
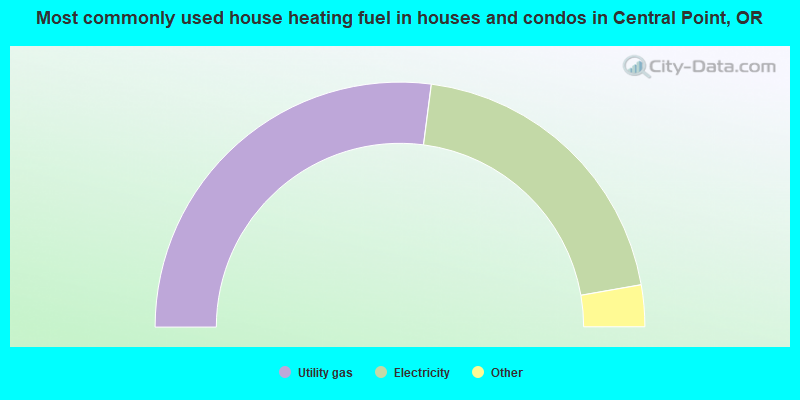
House heating fuel used in houses and condos - Utility gas (%)
House heating fuel used in houses and condos - Bottled, tank, or LP gas (%)
House heating fuel used in houses and condos - Electricity (%)
House heating fuel used in houses and condos - Fuel oil, kerosene, etc. (%)
House heating fuel used in houses and condos - Coal or coke (%)
House heating fuel used in houses and condos - Wood (%)
House heating fuel used in houses and condos - Solar energy (%)
House heating fuel used in houses and condos - Other fuel (%)
House heating fuel used in houses and condos - No fuel used (%)
House heating fuel used in apartments - Utility gas (%)
House heating fuel used in apartments - Bottled, tank, or LP gas (%)
House heating fuel used in apartments - Electricity (%)
House heating fuel used in apartments - Fuel oil, kerosene, etc. (%)
House heating fuel used in apartments - Coal or coke (%)
House heating fuel used in apartments - Wood (%)
House heating fuel used in apartments - Solar energy (%)
House heating fuel used in apartments - Other fuel (%)
House heating fuel used in apartments - No fuel used (%)
Median year house/condo built: 1996Median year apartment built: 1995Household type by relationship:
Households: 19,040
Male householders: 3,611 (566 living alone ), Female householders: 3,753 (1,406 living alone )4,248 spouses (4,219 opposite-sex spouses ), 513 unmarried partners , (417 opposite-sex unmarried partners ), 5,047 children (4,498 natural , 109 adopted , 439 stepchildren ), 252 grandchildren , 286 brothers or sisters , 187 parents , 0 foster children , 523 other relatives , 522 non-relatives In group quarters: 92
Size of family households: 2,256 2-persons , 1,216 3-persons , 1,203 4-persons , 348 5-persons , 86 6-persons , 91 7-or-more-persons .
Size of nonfamily households: 1,982 1-person , 305 2-persons , 104 3-persons , 41 5-persons .
2,770 married couples with children. single-parent households (248 men , 553 women ).
88.2% of residents of Central Point speak English at home. of residents speak Spanish at home (71% speak English very well , 13% speak English well , 14% speak English not well , 3% don't speak English at all ).of residents speak Asian or Pacific Island language at home (84% speak English very well , 5% speak English well , 11% speak English not well ).
Foreign born population: 1,030 (5.4%)of them are naturalized citizens )
Median number of rooms in houses and condos:
Median number of rooms in apartments
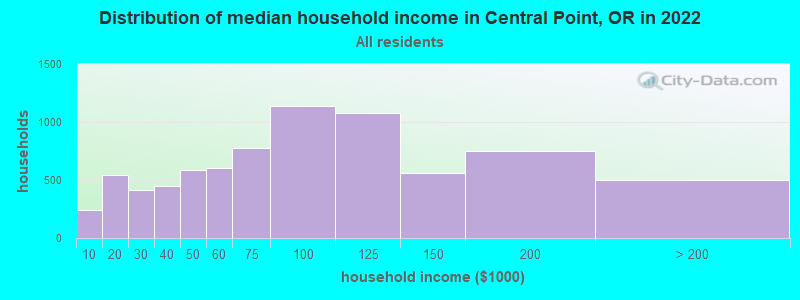
Central Point, OR household income distribution 242 Less than $10,000546 $10,000 to $19,999411 $20,000 to $29,999450 $30,000 to $39,999588 $40,000 to $49,999604 $50,000 to $59,999778 $60,000 to $74,9991,134 $75,000 to $99,9991,080 $100,000 to $124,999559 $125,000 to $149,999748 $150,000 to $199,999501 $200,000 or more
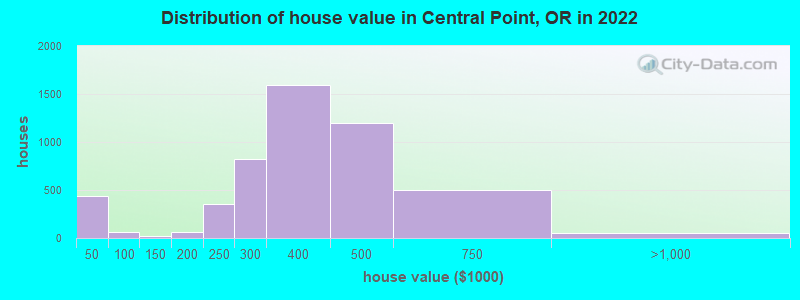
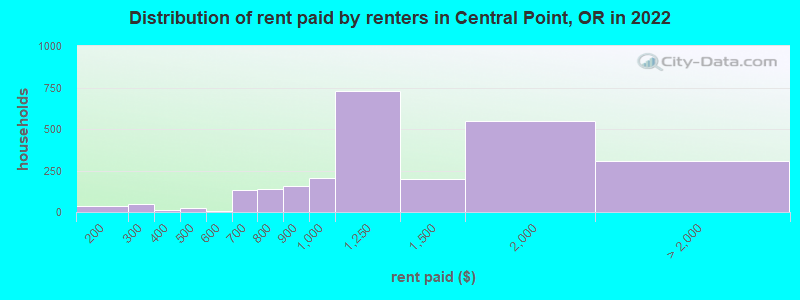
Home value of owner - occupied houses in 2022 in Central Point, OR 176 Less than $10,00035 $10,000 to $14,99923 $15,000 to $19,999151 $30,000 to $34,99915 $35,000 to $39,99932 $40,000 to $49,99910 $50,000 to $59,99912 $60,000 to $69,9998 $90,000 to $99,9996 $100,000 to $124,99919 $125,000 to $149,99923 $150,000 to $174,99938 $175,000 to $199,999349 $200,000 to $249,999828 $250,000 to $299,9991,594 $300,000 to $399,9991,200 $400,000 to $499,999498 $500,000 to $749,99924 $750,000 to $999,9999 $1,000,000 to $1,499,99912 $1,500,000 to $1,999,999Rent paid by renters in 2022 in Central Point, OR 37 $150 to $19933 $200 to $24914 $250 to $29912 $300 to $3496 $400 to $44916 $450 to $4995 $550 to $59976 $600 to $64958 $650 to $69964 $700 to $74971 $750 to $799154 $800 to $899202 $900 to $999726 $1,000 to $1,249199 $1,250 to $1,499546 $1,500 to $1,999215 $2,000 to $2,49940 $3,000 to $3,49950 No cash rent
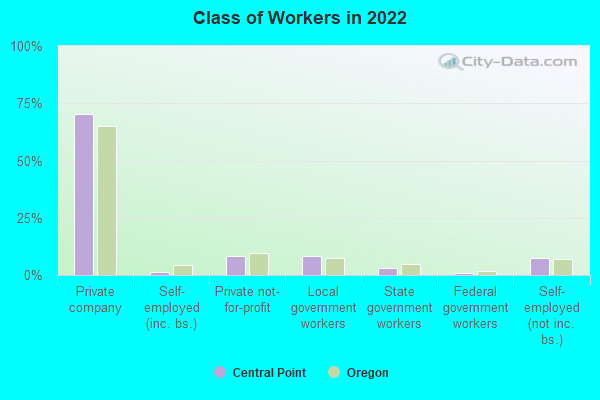
Percentage of workers working in this county: 94.2%Number of people working at home: 667 (6.6% of all workers )
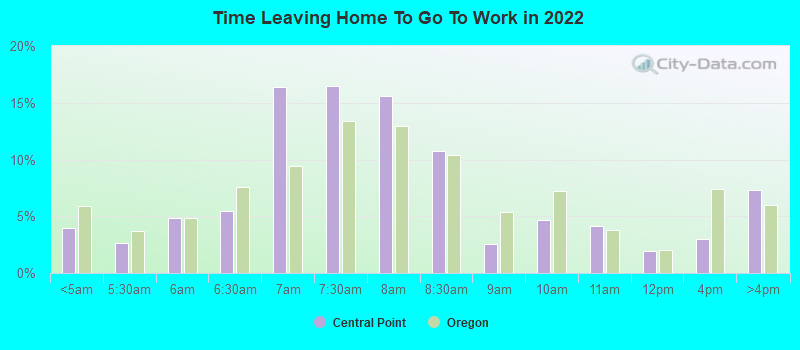
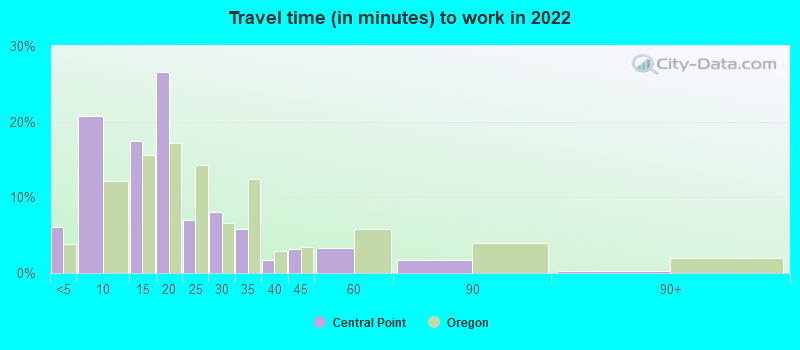
Travel time to work (commute)
Less than 5 minutes: 3245 to 9 minutes: 1,53210 to 14 minutes: 2,28815 to 19 minutes: 2,75620 to 24 minutes: 1,34825 to 29 minutes: 38930 to 34 minutes: 41335 to 39 minutes: 6540 to 44 minutes: 12045 to 59 minutes: 3960 to 89 minutes: 6690 or more minutes: 38
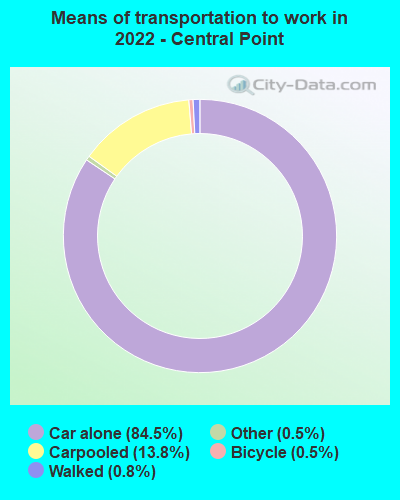
Means of transportation to work:
Drove a car alone: 3,363 (70.2%)Carpooled: 728 (15.2%)Taxi: 21 (0.4%)Bicycle: 35 (0.7%)Walked: 35 (0.7%)Worked at home: 667 (13.9%)
Unemployment by race in 2022
Unemployment rate for White non-Hispanic residents 6.8% Males3.1% FemalesUnemployment rate for Hispanic or Latino residents 5.7% Females
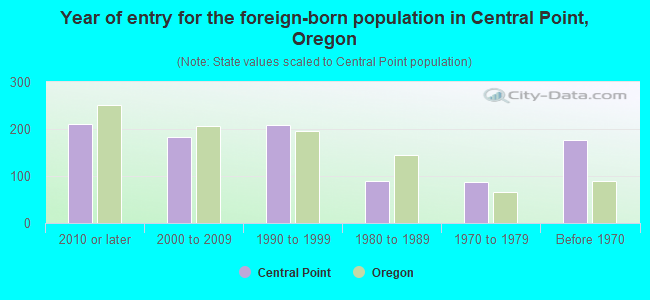
Year of entry for the foreign-born population in Central Point, Oregon
211 2010 or later 184 2000 to 2009 209 1990 to 1999 89 1980 to 1989 87 1970 to 1979 176 Before 1970
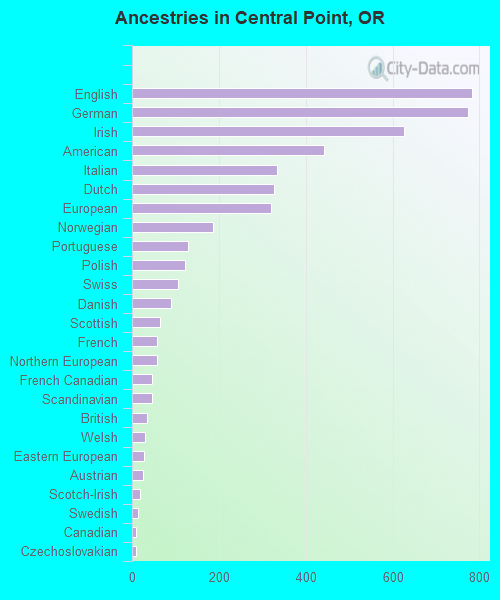
First ancestries reported:
English: 783 (10.5%)
German: 774 (10.4%)
Irish: 627 (8.4%)
American: 442 (5.9%)
Italian: 335 (4.5%)
Dutch: 328 (4.4%)
European: 320 (4.3%)
Norwegian: 186 (2.5%)
Portuguese: 129 (1.7%)
Polish: 122 (1.6%)
Swiss: 107 (1.4%)
Danish: 89 (1.2%)
Scottish: 64 (0.9%)
French: 57 (0.8%)
Northern European: 57 (0.8%)
French Canadian: 47 (0.6%)
Scandinavian: 46 (0.6%)
British: 34 (0.5%)
Welsh: 31 (0.4%)
Eastern European: 28 (0.4%)
Austrian: 25 (0.3%)
Scotch-Irish: 18 (0.2%)
Swedish: 13 (0.2%)
Canadian: 10 (0.1%)
Czechoslovakian: 9 (0.1%)
Yugoslavian: 9 (0.1%)
Croatian: 1 (0.01%) Most common places of birth for foreign-born residents (%): Mexico Central Point:
68.1% (816)Oregon:
33.9% (140,109)
Philippines Central Point:
8.8% (106)Oregon:
3.5% (14,530)
Guatemala Central Point:
4.4% (53)Oregon:
1.7% (7,103)
Ecuador Central Point:
3.7% (44)Oregon:
0.2% (794)
Canada Central Point:
3.4% (41)Oregon:
3.7% (15,229)
Vietnam Central Point:
3.1% (37)Oregon:
5.5% (22,563)
Cuba Central Point:
2.8% (33)Oregon:
0.5% (2,247)
Korea Central Point:
2.1% (25)Oregon:
2.8% (11,450)
Japan Central Point:
1.7% (20)Oregon:
1.5% (6,259)
Place of birth for U.S.-born residents:
This state: 9,778Other state: 8,058Northeast: 390Midwest: 1,008South: 722West: 5,977 86.9% of Central Point residents lived in the same house 1 years ago.
Out of people who lived in different houses, 43.0% lived in this county.
Out of people who lived in different counties, 28.4% lived in Oregon.
Central Point:
86.9%State average:
85.5%
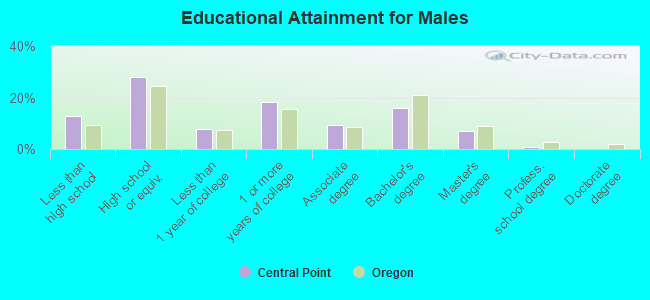
Education attainment for males 25 years and older:
No schooling: 391Nursery to 4th grade: 815th and 6th grade: 477th and 8th grade: 09th grade: 1610th grade: 1311th grade: 10212th grade, no diploma: 167High school graduate (or equivalency): 1,750Less than 1 year of college: 481Some college more than 1 year, no degree: 1,156Associate degree: 581Bachelor's degree: 998Master's degree: 451Professional school degree: 58Doctorate degree: 0
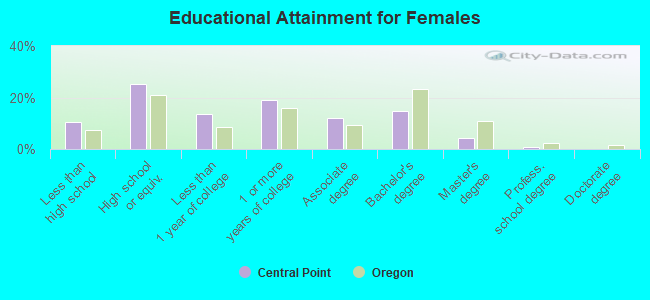
Education attainment for females 25 years and older:
No schooling: 182Nursery to 4th grade: 665th and 6th grade: 887th and 8th grade: 79th grade: 010th grade: 1911th grade: 24412th grade, no diploma: 164High school graduate (or equivalency): 1,862Less than 1 year of college: 1,003Some college more than 1 year, no degree: 1,405Associate degree: 894Bachelor's degree: 1,093Master's degree: 330Professional school degree: 52Doctorate degree: 10
Housing units in structures:
One, detached: 5,393One, attached: 708Two: 2013 or 4: 2905 to 9: 19210 to 19: 13920 to 49: 6350 or more: 317Mobile homes: 420Median worth of mobile homes: $70,817
Housing units lacking complete kitchen facilities in 2022: 2.3%House/condo owner moved in on average 7 years ago
Renter moved in on average 5 years ago
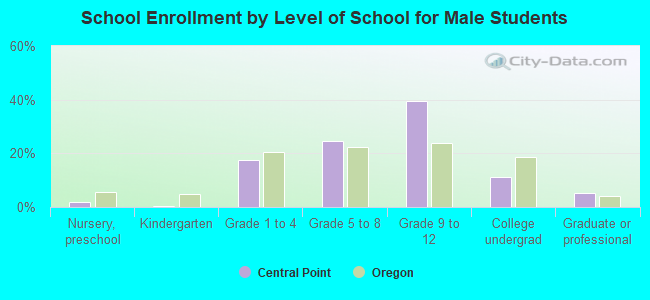
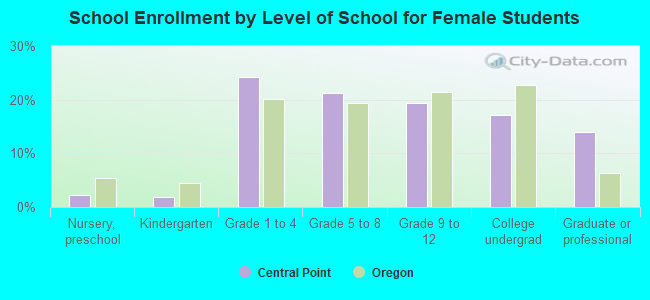
Private vs. public school enrollment:
Students in private schools in grades 1 to 8 (elementary and middle school): 151 Students in private schools in grades 9 to 12 (high school): 88 Students in private undergraduate colleges: 41