Central Islip, NY (New York) Houses and Residents
| Central Islip: | $406,607 |
| New York: | $400,400 |
Mean price in 2022:
Detached houses: $387,026
Here: $387,026 State: $476,719 Townhouses or other attached units: $397,202
Here: $397,202 State: $699,270 In 2-unit structures: $448,113
Here: $448,113 State: $713,077 In 3-to-4-unit structures: $391,462
Here: $391,462 State: $764,568 In 5-or-more-unit structures: $266,180
Here: $266,180 State: $912,009
Total population: 34,450 (Urban population: 31,881, Rural population: 0)
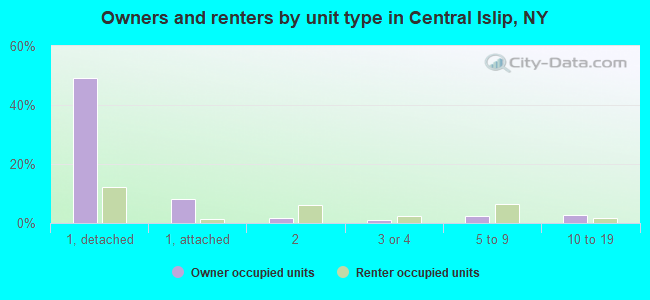
Houses: 10,574 (9,777 occupied: 7,270 owner occupied, 2,503 renter occupied)
| % of renters here: | 26% |
| State: | 46% |
Housing density: 1,456 houses/condos per square mile
Median price asked for vacant for-sale houses and condos in 2022: $642,568.
Median contract rent in 2022: $1,988 (lower quartile is $1,047, upper quartile is over $2,000)
Median rent asked for vacant for-rent units in 2022: $2,035
Median gross rent in Central Islip, NY in 2022: over $2,000
Housing units in Central Islip with a mortgage: 5,133 (316 second mortgage, 0 home equity loan, 226 both second mortgage and home equity loan)
Houses without a mortgage: 31
Median household income for houses/condos with a mortgage: $124,896
Median household income for apartments without a mortgage: $83,199
Median monthly housing costs: $2,223
Compare current foreclosures in Central Islip, NY:
| Photo | Address | Area | Beds / Baths | Price | Details |
|---|---|---|---|---|---|

|
#1
Kirby Ln
Central Islip, NY 11722
|
- sq. feet
|
1 baths 3 beds |
$395,200
|
show details |

|
#2
Pineview Blvd
Central Islip, NY 11722
|
- sq. feet
|
3 baths 5 beds |
show details | |

|
#3
Finch Ln
Central Islip, NY 11722
|
- sq. feet
|
2 baths 2 beds |
show details | |

|
#4
Connetquot Ave
Central Islip, NY 11722
|
- sq. feet
|
2 baths 4 beds |
show details | |

|
#5
Gates Ave
Central Islip, NY 11722
|
- sq. feet
|
2 baths 3 beds |
show details | |

|
#6
Medea Way
Central Islip, NY 11722
|
1,191 sq. feet
|
- baths - beds |
show details | |

|
#7
Broadlawn Dr
Central Islip, NY 11722
|
- sq. feet
|
- baths - beds |
show details | |

|
#8
Poplar St
Central Islip, NY 11722
|
- sq. feet
|
- baths - beds |
show details | |

|
#9
Medea Way
Central Islip, NY 11722
|
- sq. feet
|
- baths - beds |
show details | |

|
#10
Maple Wing Dr
Central Islip, NY 11722
|
- sq. feet
|
- baths - beds |
show details |
| Photo | Address | Area | Beds / Baths | Price | Details |
|---|---|---|---|---|---|

|
#11
Smith St
Central Islip, NY 11722
|
- sq. feet
|
- baths - beds |
show details | |

|
#12
Circle Dr
Central Islip, NY 11722
|
- sq. feet
|
- baths - beds |
show details | |

|
#13
Circle Dr
Central Islip, NY 11722
|
- sq. feet
|
- baths - beds |
show details | |

|
#14
Weatherby Ln
Central Islip, NY 11722
|
- sq. feet
|
- baths - beds |
show details | |

|
#15
Hawthorne Ave
Central Islip, NY 11722
|
- sq. feet
|
- baths - beds |
show details | |

|
#16
Connetquot Ave
Central Islip, NY 11722
|
- sq. feet
|
- baths - beds |
show details | |

|
#17
Pinewood Ave
Central Islip, NY 11722
|
- sq. feet
|
- baths - beds |
show details | |

|
#18
Oak St
Central Islip, NY 11722
|
- sq. feet
|
- baths - beds |
show details | |

|
#19
Calebs Path
Central Islip, NY 11722
|
- sq. feet
|
- baths - beds |
show details | |

|
#20
Elm St
Central Islip, NY 11722
|
- sq. feet
|
- baths - beds |
show details |
| Photo | Address | Area | Beds / Baths | Price | Details |
|---|---|---|---|---|---|

|
#21
Nostrand Ave
Central Islip, NY 11722
|
- sq. feet
|
- baths - beds |
show details | |

|
#22
Cypress St
Central Islip, NY 11722
|
- sq. feet
|
- baths - beds |
show details | |

|
#23
Vanderbilt Ave
Central Islip, NY 11722
|
- sq. feet
|
- baths - beds |
show details | |

|
#24
Whitetail Ln
Central Islip, NY 11722
|
- sq. feet
|
- baths - beds |
show details | |

|
#25
Yalta Dr
Central Islip, NY 11722
|
- sq. feet
|
- baths - beds |
show details | |

|
#26
Adams Rd
Central Islip, NY 11722
|
- sq. feet
|
- baths - beds |
show details | |

|
#27
1st Pl
Central Islip, NY 11722
|
- sq. feet
|
- baths - beds |
show details | |

|
#28
Cypress St
Central Islip, NY 11722
|
- sq. feet
|
- baths - beds |
show details | |

|
#29
Finch Ln
Central Islip, NY 11722
|
- sq. feet
|
- baths - beds |
show details | |

|
#30
Cordello Ave
Central Islip, NY 11722
|
- sq. feet
|
- baths - beds |
show details |
| Photo | Address | Area | Beds / Baths | Price | Details |
|---|---|---|---|---|---|

|
#31
Medea Way
Central Islip, NY 11722
|
- sq. feet
|
- baths - beds |
show details | |

|
#32
E Walnut St
Central Islip, NY 11722
|
- sq. feet
|
- baths - beds |
show details | |

|
#33
Oakland Ave
Central Islip, NY 11722
|
- sq. feet
|
- baths - beds |
show details | |

|
#34
Elmore St
Central Islip, NY 11722
|
- sq. feet
|
- baths - beds |
show details | |

|
#35
Maple Pl
Central Islip, NY 11722
|
- sq. feet
|
- baths - beds |
show details | |

|
#36
2nd Ave
Central Islip, NY 11722
|
- sq. feet
|
- baths - beds |
show details | |

|
#37
Monsen St
Central Islip, NY 11722
|
- sq. feet
|
- baths - beds |
show details | |

|
#38
Satinwood St
Central Islip, NY 11722
|
- sq. feet
|
- baths - beds |
show details | |

|
#39
Peach St
Central Islip, NY 11722
|
- sq. feet
|
- baths - beds |
show details | |

|
#40
Brier St
Central Islip, NY 11722
|
- sq. feet
|
- baths - beds |
show details |
| Photo | Address | Area | Beds / Baths | Price | Details |
|---|---|---|---|---|---|

|
#41
Nicoll Ave
Central Islip, NY 11722
|
- sq. feet
|
- baths - beds |
show details | |

|
#42
Cranberry St
Central Islip, NY 11722
|
- sq. feet
|
- baths - beds |
show details | |

|
#43
Ferndale Blvd
Central Islip, NY 11722
|
- sq. feet
|
- baths - beds |
show details | |

|
#44
Storey Ave
Central Islip, NY 11722
|
- sq. feet
|
- baths - beds |
show details | |

|
#45
Plum St
Central Islip, NY 11722
|
- sq. feet
|
- baths - beds |
show details | |

|
#46
Okane St
Central Islip, NY 11722
|
- sq. feet
|
- baths - beds |
show details | |

|
#47
Cone Ave
Central Islip, NY 11722
|
- sq. feet
|
- baths - beds |
show details | |

|
#48
Whitetail Ln
Central Islip, NY 11722
|
- sq. feet
|
- baths - beds |
show details | |

|
#49
Dovecote Ln
Central Islip, NY 11722
|
- sq. feet
|
- baths - beds |
show details | |

|
Check over 1 million property listings on Foreclosure.com!
|
browse all offers | |||


 | Condos in Central Islip. Windbrooke or Plymouth Village. Does anyone know about the area? (0 replies) |
| Wyandanch Rising: Fancy New Apartments (84 replies) |
| Searching for homes in LI (51 replies) |
| Renting the spare room in our house illegal? (35 replies) |
| Buying a home 2021 (7 replies) |
| Student enrollment on Long Island falls 7% in decade (33 replies) |
Median year apartment built: 1968
Household type by relationship:
Households: 36,542- Male householders: 4,424 (1,014 living alone), Female householders: 5,330 (1,281 living alone)
3,827 spouses (3,817 opposite-sex spouses), 1,039 unmarried partners, (1,028 opposite-sex unmarried partners), 11,641 children (10,925 natural, 139 adopted, 577 stepchildren), 1,708 grandchildren, 1,043 brothers or sisters, 1,260 parents, 0 foster children, 2,558 other relatives, 3,454 non-relatives
- In group quarters: 253
Size of family households: 1,692 2-persons, 1,289 3-persons, 1,587 4-persons, 593 5-persons, 457 6-persons, 1,131 7-or-more-persons.
Size of nonfamily households: 2,314 1-person, 427 2-persons, 96 3-persons, 57 4-persons, 45 5-persons, 58 6-persons, 41 7-or-more-persons.
3,356 married couples with children.
2,679 single-parent households (749 men, 1,930 women).
41.6% of residents of Central Islip speak English at home.
54.1% of residents speak Spanish at home (52% speak English very well, 19% speak English well, 22% speak English not well, 7% don't speak English at all).
4.4% of residents speak other Indo-European language at home (65% speak English very well, 27% speak English well, 5% speak English not well, 4% don't speak English at all).
0.7% of residents speak Asian or Pacific Island language at home (46% speak English very well, 21% speak English well, 33% speak English not well, 1% don't speak English at all).
0.9% of residents speak other language at home (69% speak English very well, 31% speak English well).
Foreign born population: 13,713 (37.5%)
(48.0% of them are naturalized citizens)
| Here: | 5.9 |
| State: | 6.3 |
| Here: | 4.0 |
| State: | 3.8 |
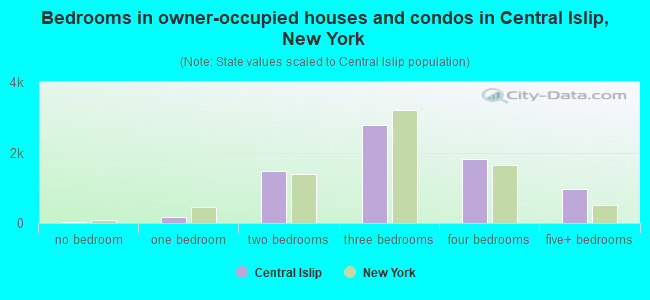
- Bedrooms in owner-occupied houses and condos in Central Islip, New York
- 33no bedroom
- 1811 bedroom
- 1,4632 bedrooms
- 2,7873 bedrooms
- 1,8284 bedrooms
- 9785+ bedrooms
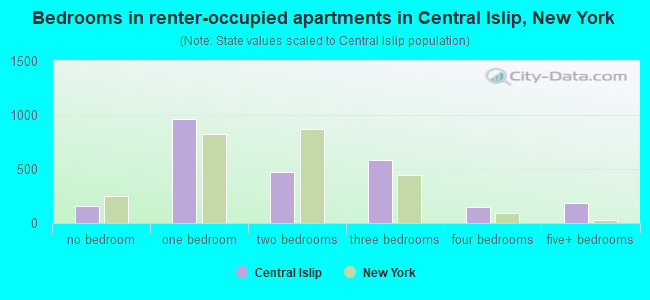
- Bedrooms in renter-occupied apartments in Central Islip, New York
- 157no bedroom
- 9621 bedroom
- 4732 bedrooms
- 5803 bedrooms
- 1464 bedrooms
- 1835+ bedrooms
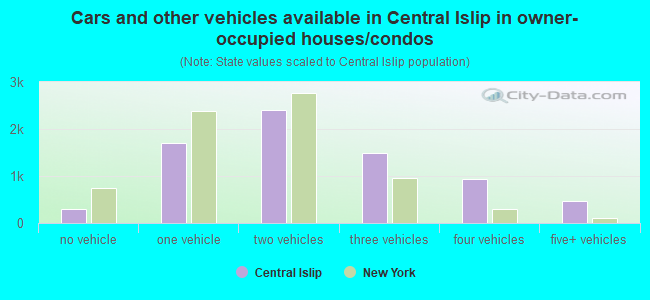
- Cars and other vehicles available in Central Islip in owner-occupied houses/condos
- 288no vehicle
- 1,7011 vehicle
- 2,4032 vehicles
- 1,4903 vehicles
- 9294 vehicles
- 4595+ vehicles
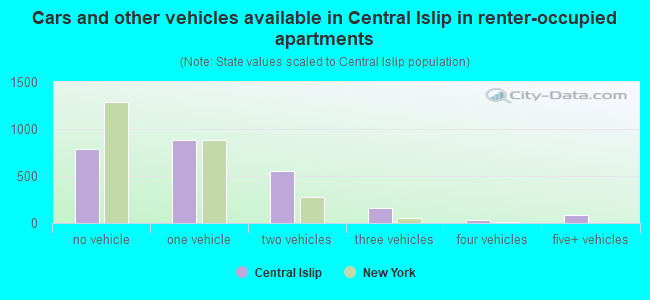
- Cars and other vehicles available in Central Islip in renter-occupied apartments
- 786no vehicle
- 8851 vehicle
- 5532 vehicles
- 1613 vehicles
- 344 vehicles
- 835+ vehicles
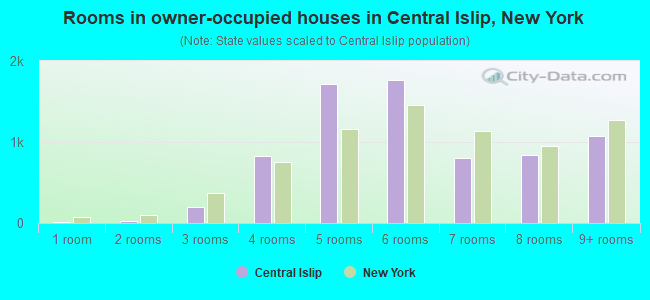
- Rooms in owner-occupied houses in Central Islip, New York
- 171 room
- 242 rooms
- 1973 rooms
- 8274 rooms
- 1,7185 rooms
- 1,7716 rooms
- 7977 rooms
- 8428 rooms
- 1,0769+ rooms
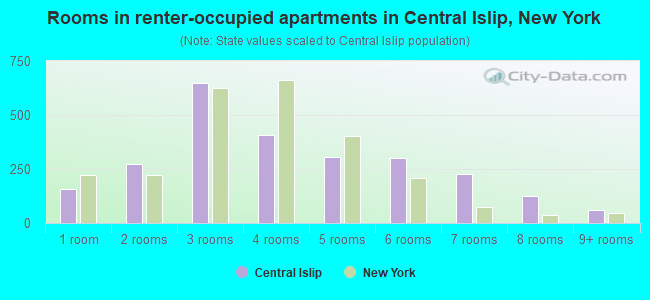
- Rooms in renter-occupied apartments in Central Islip, New York
- 1571 room
- 2732 rooms
- 6463 rooms
- 4094 rooms
- 3075 rooms
- 3036 rooms
- 2267 rooms
- 1248 rooms
- 599+ rooms
Central Islip, NY household income distribution

- 326Less than $10,000
- 762$10,000 to $19,999
- 330$20,000 to $29,999
- 336$30,000 to $39,999
- 507$40,000 to $49,999
- 573$50,000 to $59,999
- 912$60,000 to $74,999
- 1,173$75,000 to $99,999
- 1,233$100,000 to $124,999
- 1,005$125,000 to $149,999
- 1,305$150,000 to $199,999
- 1,289$200,000 or more
Home value of owner - occupied houses in 2022 in Central Islip, NY
-
- 141Less than $10,000
- 37$10,000 to $14,999
- 15$25,000 to $29,999
- 27$30,000 to $34,999
- 15$35,000 to $39,999
- 30$40,000 to $49,999
- 59$50,000 to $59,999
- 30$70,000 to $79,999
- 16$100,000 to $124,999
- 1$125,000 to $149,999
- 34$150,000 to $174,999
- 149$175,000 to $199,999
- 567$200,000 to $249,999
- 390$250,000 to $299,999
- 1,931$300,000 to $399,999
- 1,724$400,000 to $499,999
- 843$500,000 to $749,999
- 49$750,000 to $999,999
- 7$1,000,000 to $1,499,999
- 33$1,500,000 to $1,999,999
- 19$2,000,000 or more
Rent paid by renters in 2022 in Central Islip, NY
-
- 34Less than $100
- 18$100 to $149
- 129$150 to $199
- 20$200 to $249
- 43$250 to $299
- 94$300 to $349
- 62$350 to $399
- 43$400 to $449
- 14$450 to $499
- 38$500 to $549
- 38$550 to $599
- 38$800 to $899
- 145$1,000 to $1,249
- 115$1,250 to $1,499
- 376$1,500 to $1,999
- 860$2,000 to $2,499
- 294$2,500 to $2,999
- 38$3,000 to $3,499
- 135No cash rent
Percentage of workers working in this county: 81.8%
Number of people working at home: 1,628 (9.0% of all workers)
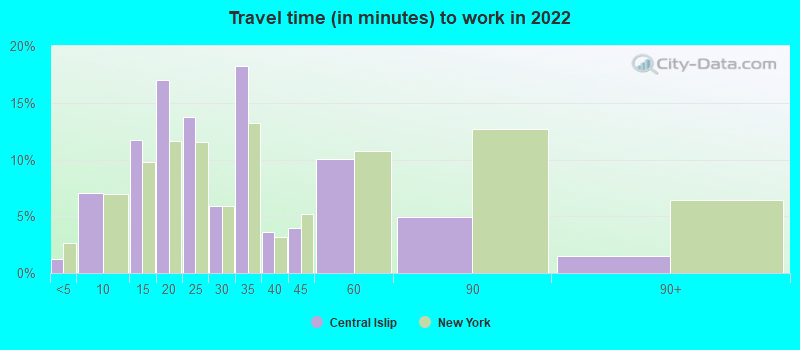
Travel time to work (commute)
- Less than 5 minutes: 149
- 5 to 9 minutes: 980
- 10 to 14 minutes: 1,249
- 15 to 19 minutes: 2,588
- 20 to 24 minutes: 2,770
- 25 to 29 minutes: 1,279
- 30 to 34 minutes: 3,513
- 35 to 39 minutes: 516
- 40 to 44 minutes: 560
- 45 to 59 minutes: 1,103
- 60 to 89 minutes: 739
- 90 or more minutes: 586
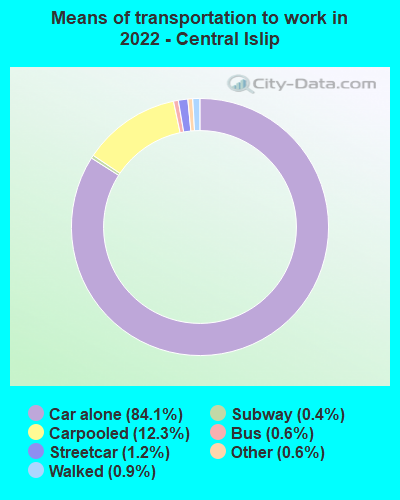
Means of transportation to work:
- Drove a car alone: 7,020 (69.8%)
- Carpooled: 1,179 (11.7%)
- Bus: 45 (0.4%)
- Subway or elevated rail: 105 (1.0%)
- Long-distance train or commuter rail: 33 (0.3%)
- Taxi: 62 (0.6%)
- Walked: 76 (0.8%)
- Worked at home: 1,628 (16.2%)
- Unemployment by race in 2022
- Unemployment rate for White non-Hispanic residents
- 2.7%Males
- 2.4%Females
- Unemployment rate for Black residents
- 5.5%Males
- 1.2%Females
- Unemployment rate for American Indian and Alaska Native residents
- 12.4%Males
- Unemployment rate for Asian residents
- 9.2%Males
- 2.0%Females
- Unemployment rate for other race residents
- 1.2%Males
- 2.2%Females
- Unemployment rate for two or more race residents
- 7.9%Males
- 4.7%Females
- Unemployment rate for Hispanic or Latino residents
- 4.6%Males
- 3.6%Females
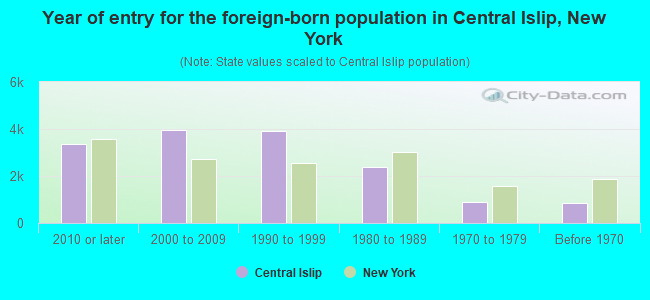
- Year of entry for the foreign-born population in Central Islip, New York
- 3,3502010 or later
- 3,9762000 to 2009
- 3,8951990 to 1999
- 2,3731980 to 1989
- 9141970 to 1979
- 848Before 1970
First ancestries reported:
- Haitian: 963 (4.2%)
- American: 834 (3.6%)
- Italian: 811 (3.5%)
- Irish: 544 (2.4%)
- Jamaican: 496 (2.2%)
- German: 308 (1.3%)
- Trinidadian and Tobagonian: 241 (1.1%)
- West Indian: 240 (1.0%)
- African: 161 (0.7%)
- Polish: 134 (0.6%)
- Ghanaian: 132 (0.6%)
- Greek: 118 (0.5%)
- British West Indian: 109 (0.5%)
- Nigerian: 105 (0.5%)
- Guyanese: 77 (0.3%)
- Ukrainian: 68 (0.3%)
- English: 58 (0.3%)
- Slovak: 33 (0.1%)
- European: 31 (0.1%)
- Brazilian: 28 (0.1%)
- Norwegian: 26 (0.1%)
- French: 24 (0.1%)
- Scotch-Irish: 15 (0.07%)
- Belizean: 14 (0.06%)
- British: 13 (0.06%)
- French Canadian: 11 (0.05%)
- Lebanese: 7 (0.03%)
- Czech: 7 (0.03%)
- Hungarian: 6 (0.03%)
- Barbadian: 4 (0.02%)
Most common places of birth for foreign-born residents (%):
| Central Islip: | 33.4% (4,223) |
| New York: | 2.4% (108,067) |
| Central Islip: | 12.4% (1,572) |
| New York: | 1.2% (55,571) |
| Central Islip: | 9.7% (1,227) |
| New York: | 11.1% (501,040) |
| Central Islip: | 6.3% (802) |
| New York: | 2.8% (126,936) |
| Central Islip: | 4.7% (599) |
| New York: | 1.2% (54,759) |
| Central Islip: | 4.7% (596) |
| New York: | 3.9% (177,448) |
| Central Islip: | 4.6% (577) |
| New York: | 1.4% (61,245) |
| Central Islip: | 3.9% (488) |
| New York: | 2.5% (111,920) |
| Central Islip: | 2.2% (276) |
| New York: | 3.5% (158,432) |
| Central Islip: | 1.9% (239) |
| New York: | 2.0% (91,428) |
| Central Islip: | 1.8% (228) |
| New York: | 5.0% (227,557) |
Place of birth for U.S.-born residents:
- This state: 19,656
- Other state: 2,283
- Northeast: 567
- Midwest: 142
- South: 1,334
- West: 89
91.5% of Central Islip residents lived in the same house 1 years ago.
Out of people who lived in different houses, 30.2% lived in this county.
Out of people who lived in different counties, 71.9% lived in New York.
| Central Islip: | 91.5% |
| State average: | 89.6% |
Education attainment for males 25 years and older:
- No schooling: 858
- Nursery to 4th grade: 115
- 5th and 6th grade: 347
- 7th and 8th grade: 433
- 9th grade: 218
- 10th grade: 268
- 11th grade: 78
- 12th grade, no diploma: 798
- High school graduate (or equivalency): 3,603
- Less than 1 year of college: 1,033
- Some college more than 1 year, no degree: 1,056
- Associate degree: 660
- Bachelor's degree: 1,453
- Master's degree: 511
- Professional school degree: 84
- Doctorate degree: 88
Education attainment for females 25 years and older:
- No schooling: 822
- Nursery to 4th grade: 148
- 5th and 6th grade: 272
- 7th and 8th grade: 266
- 9th grade: 134
- 10th grade: 170
- 11th grade: 189
- 12th grade, no diploma: 518
- High school graduate (or equivalency): 3,693
- Less than 1 year of college: 1,055
- Some college more than 1 year, no degree: 1,103
- Associate degree: 884
- Bachelor's degree: 1,363
- Master's degree: 794
- Professional school degree: 180
- Doctorate degree: 46
Housing units in structures:
- One, detached: 7,201
- One, attached: 1,603
- Two: 405
- 3 or 4: 100
- 5 to 9: 427
- 10 to 19: 303
- 20 to 49: 92
- 50 or more: 378
- Mobile homes: 33
- Boats, RVs, vans, etc.: 29
Housing units lacking complete kitchen facilities in 2022: 1.5%
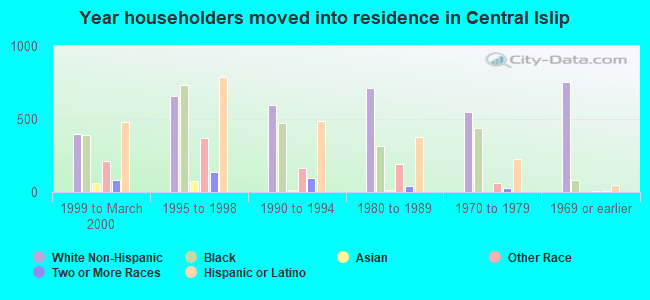
House/condo owner moved in on average 11 years ago
Renter moved in on average 6 years ago
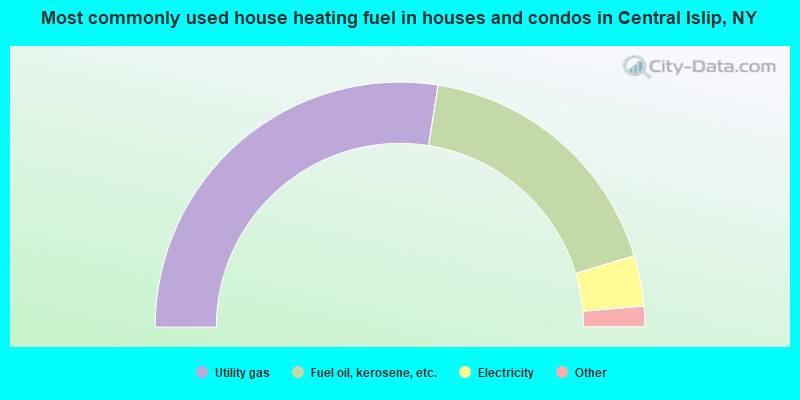
- 55.0%Utility gas
- 35.6%Fuel oil, kerosene, etc.
- 6.7%Electricity
- 1.1%No fuel used
- 0.9%Bottled, tank, or LP gas
- 0.6%Other fuel
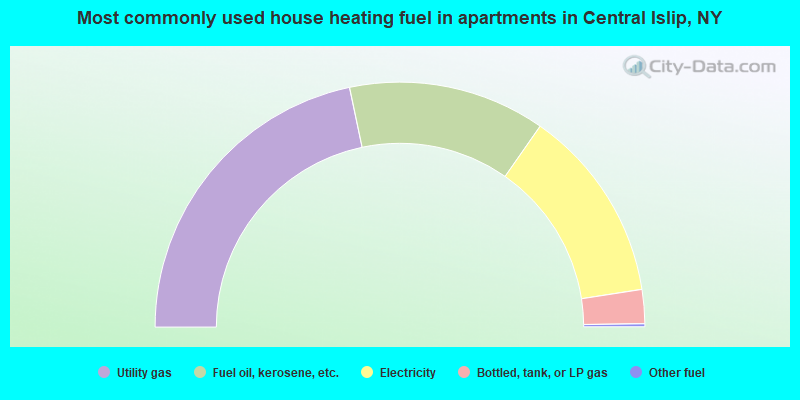
- 43.4%Utility gas
- 26.0%Fuel oil, kerosene, etc.
- 25.7%Electricity
- 4.5%Bottled, tank, or LP gas
- 0.4%Other fuel
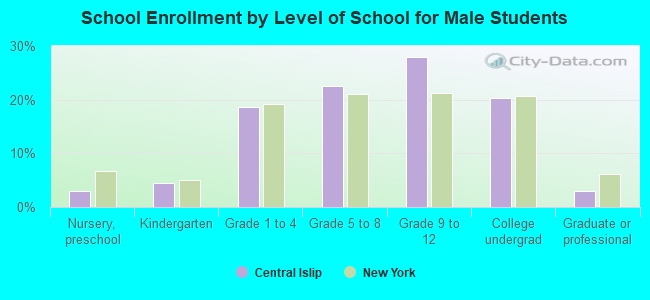
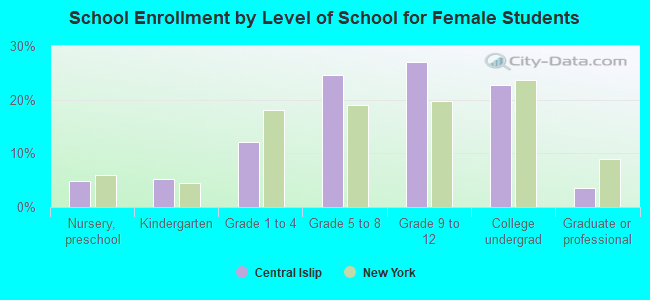
Private vs. public school enrollment:
| Here: | 4.1% |
| New York: | 15.6% |
| Here: | 5.1% |
| New York: | 15.0% |
| Here: | 4.6% |
| New York: | 39.2% |