Center Point, TN (Tennessee) Houses and Residents
| Center Point: | $238,325 |
| Tennessee: | $284,800 |
Total population: 3,667 (Urban population: 0, Rural population: 3,113 (74 farm, 3,039 nonfarm))
Houses: 1,320 (1,219 occupied: 1,035 owner occupied, 184 renter occupied)
| % of renters here: | 15% |
| State: | 33% |
Housing density: 13 houses/condos per square mile
Median price asked for vacant for-sale houses and condos in 2022 in this county: $95,796.
Median contract rent in 2022: $783 (lower quartile is $626, upper quartile is $850)
Median rent asked for vacant for-rent units in 2022: $725
Median gross rent in Center Point, TN in 2022: $995
Housing units in Center Point with a mortgage: 343 (28 second mortgage, 0 home equity loan, 0 both second mortgage and home equity loan)
Houses without a mortgage: 283
Compare current foreclosures near Center Point, TN:
| Photo | Address | Area | Beds / Baths | Price | Details |
|---|---|---|---|---|---|

|
#1
Land Loop Rd
Dunlap, TN 37327
|
964 sq. feet
|
1 baths 2 beds |
$189,900
|
show details |

|
#2
Cherokee Blvd # 109
Chattanooga, TN 37405
|
2,298 sq. feet
|
4 baths 3 beds |
show details | |

|
#3
S Magnolia Ave
Whitwell, TN 37397
|
928 sq. feet
|
1 baths 2 beds |
show details | |

|
#4
Emerald Creek Cir
Soddy Daisy, TN 37379
|
1,350 sq. feet
|
2 baths 3 beds |
show details | |

|
#5
Harvey Cemetery Rd
Graysville, TN 37338
|
2,208 sq. feet
|
1 baths 3 beds |
show details | |

|
#6
Greene St
Soddy Daisy, TN 37379
|
1,153 sq. feet
|
2 baths 3 beds |
show details | |

|
#7
Woodmont Dr
Whitwell, TN 37397
|
1,144 sq. feet
|
1 baths - beds |
show details | |

|
#8
Sunset Dr
Whitwell, TN 37397
|
1,170 sq. feet
|
1 baths - beds |
show details | |

|
#9
Ra Griffith Hwy
Whitwell, TN 37397
|
1,178 sq. feet
|
1 baths - beds |
show details | |

|
#10
Lusk Loop Rd
Dunlap, TN 37327
|
792 sq. feet
|
2 baths - beds |
show details |
| Photo | Address | Area | Beds / Baths | Price | Details |
|---|---|---|---|---|---|

|
#11
Chicken Dave Rd
Whitwell, TN 37397
|
1,722 sq. feet
|
1 baths - beds |
show details | |

|
#12
Flat Mountain Rd
Dunlap, TN 37327
|
1,728 sq. feet
|
2 baths - beds |
show details | |

|
#13
Alvin York Hwy
Whitwell, TN 37397
|
1,032 sq. feet
|
1 baths - beds |
show details | |

|
#14
Alvin York Hwy
Whitwell, TN 37397
|
960 sq. feet
|
1 baths - beds |
show details | |

|
#15
Teague Cemetery Rd
Whitwell, TN 37397
|
1,420 sq. feet
|
2 baths - beds |
show details | |

|
#16
Fiddlers Dr
Whitwell, TN 37397
|
1,305 sq. feet
|
2 baths - beds |
show details | |

|
#17
Woodmont Dr
Whitwell, TN 37397
|
1,400 sq. feet
|
1 baths - beds |
show details | |

|
#18
Old Mill Rd
Whitwell, TN 37397
|
1,350 sq. feet
|
2 baths - beds |
show details | |

|
#19
W Kansas Ave
Whitwell, TN 37397
|
1,380 sq. feet
|
1 baths - beds |
show details | |

|
#20
Kelly St
Whitwell, TN 37397
|
1,004 sq. feet
|
1 baths - beds |
show details |
| Photo | Address | Area | Beds / Baths | Price | Details |
|---|---|---|---|---|---|

|
#21
Mount Olive Rd
Whitwell, TN 37397
|
1,329 sq. feet
|
1 baths - beds |
show details | |

|
#22
Highway 108
Whitwell, TN 37397
|
910 sq. feet
|
1 baths - beds |
show details | |

|
#23
Highway 108
Whitwell, TN 37397
|
1,436 sq. feet
|
1 baths - beds |
show details | |

|
#24
Highway 108
Whitwell, TN 37397
|
2,340 sq. feet
|
1 baths - beds |
show details | |

|
#25
Pocket Rd
Whitwell, TN 37397
|
1,248 sq. feet
|
1 baths - beds |
show details | |

|
#26
Cottage Ln
Dunlap, TN 37327
|
1,116 sq. feet
|
2 baths - beds |
show details | |

|
#27
Lewis Chapel Rd
Dunlap, TN 37327
|
2,091 sq. feet
|
1 baths - beds |
show details | |

|
#28
Elm St
Dunlap, TN 37327
|
1,176 sq. feet
|
1 baths - beds |
show details | |

|
#29
Sunset Dr
Dunlap, TN 37327
|
1,284 sq. feet
|
2 baths - beds |
show details | |

|
#30
Hill Cir
Dunlap, TN 37327
|
1,550 sq. feet
|
1 baths - beds |
show details |
| Photo | Address | Area | Beds / Baths | Price | Details |
|---|---|---|---|---|---|

|
#31
Wilson St
Dunlap, TN 37327
|
1,098 sq. feet
|
1 baths - beds |
show details | |

|
#32
W Valley Rd
Dunlap, TN 37327
|
1,220 sq. feet
|
1 baths - beds |
show details | |

|
#33
Timber Ln
Dunlap, TN 37327
|
1,075 sq. feet
|
1 baths - beds |
show details | |

|
#34
Elm St
Dunlap, TN 37327
|
912 sq. feet
|
1 baths - beds |
show details | |

|
#35
John Burch Rd
Dunlap, TN 37327
|
1,950 sq. feet
|
2 baths - beds |
show details | |

|
#36
Neal Rd
Dunlap, TN 37327
|
1,402 sq. feet
|
2 baths - beds |
show details | |

|
#37
Standifer Cir
Dunlap, TN 37327
|
1,152 sq. feet
|
2 baths - beds |
show details | |

|
#38
Raven Cliff Rd
Graysville, TN 37338
|
1,404 sq. feet
|
2 baths - beds |
show details | |

|
#39
Phelps Dr
Dunlap, TN 37327
|
1,554 sq. feet
|
1 baths - beds |
show details | |

|
#40
Cline Cir
Dunlap, TN 37327
|
1,040 sq. feet
|
1 baths - beds |
show details |
| Photo | Address | Area | Beds / Baths | Price | Details |
|---|---|---|---|---|---|

|
#41
Hard Luck Ranch Rd
Dunlap, TN 37327
|
1,232 sq. feet
|
2 baths - beds |
show details | |

|
#42
Austin Rd
Hixson, TN 37343
|
- sq. feet
|
- baths - beds |
show details | |

|
#43
Forest Wood Ln # A
Hixson, TN 37343
|
- sq. feet
|
- baths - beds |
show details | |

|
#44
Hixson Pike Apt 330
Hixson, TN 37343
|
- sq. feet
|
- baths - beds |
show details | |

|
#45
Shoals Ln
Chattanooga, TN 37416
|
- sq. feet
|
- baths - beds |
show details | |

|
#46
Mountain Creek Rd Apt 13a5
Chattanooga, TN 37415
|
- sq. feet
|
- baths - beds |
show details | |

|
#47
Helena Dr Apt D
Hixson, TN 37343
|
- sq. feet
|
- baths - beds |
show details | |

|
#48
Old Hixson Pike Apt B213
Hixson, TN 37343
|
- sq. feet
|
- baths - beds |
show details | |

|
#49
Hidden Ridge Dr
Soddy Daisy, TN 37379
|
- sq. feet
|
- baths - beds |
show details | |

|
Check over 1 million property listings on Foreclosure.com!
|
browse all offers | |||

Household type by relationship:
Households: 13,924- In family households: 12,070 (2,856 male householders, 1,131 female householders)
3,046 spouses, 3,849 children (3,469 natural, 106 adopted, 274 stepchildren), 389 grandchildren, 119 brothers or sisters, 105 parents, foster children, 137 other relatives, 352 non-relatives
- In nonfamily households: 1,854 (745 male householders (601 living alone)), 787 female householders (690 living alone)), 322 nonrelatives
- In group quarters: 188 (all institutionalized)
1,863 married couples with children.
637 single-parent households (178 men, 459 women).
96.5% of residents of Center Point speak English at home.
1.4% of residents speak Spanish at home (49% speak English very well, 20% speak English well, 32% speak English not well).
1.3% of residents speak other Indo-European language at home (100% speak English very well).
0.7% of residents speak other language at home (38% speak English very well, 62% speak English well).
Foreign born population: 125 (3.5%)
(34.4% of them are naturalized citizens)
| Here: | 6.3 |
| State: | 6.5 |
| Here: | 4.9 |
| State: | 4.4 |

- Bedrooms in owner-occupied houses and condos in Center Point, Tennessee
- 7no bedroom
- 351 bedroom
- 3512 bedrooms
- 5593 bedrooms
- 754 bedrooms
- 85+ bedrooms

- Bedrooms in renter-occupied apartments in Center Point, Tennessee
- 0no bedroom
- 151 bedroom
- 1072 bedrooms
- 333 bedrooms
- 204 bedrooms
- 95+ bedrooms

- Cars and other vehicles available in Center Point in owner-occupied houses/condos
- 44no vehicle
- 2341 vehicle
- 4472 vehicles
- 1933 vehicles
- 784 vehicles
- 395+ vehicles

- Cars and other vehicles available in Center Point in renter-occupied apartments
- 9no vehicle
- 811 vehicle
- 742 vehicles
- 203 vehicles
- 04 vehicles
- 05+ vehicles

- Rooms in owner-occupied houses in Center Point, Tennessee
- 71 room
- 72 rooms
- 423 rooms
- 1684 rooms
- 3735 rooms
- 2516 rooms
- 617 rooms
- 478 rooms
- 799+ rooms

- Rooms in renter-occupied apartments in Center Point, Tennessee
- 01 room
- 62 rooms
- 53 rooms
- 684 rooms
- 665 rooms
- 306 rooms
- 07 rooms
- 98 rooms
- 09+ rooms


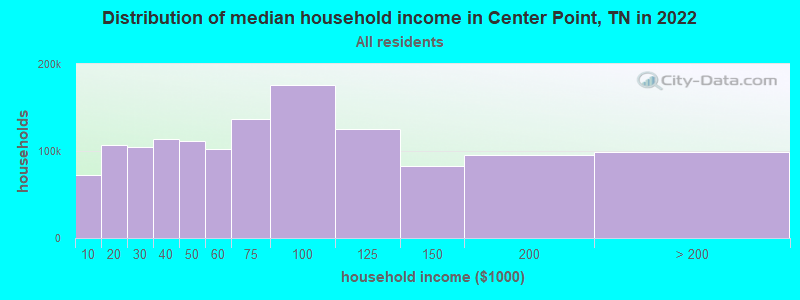
Center Point, TN household income distribution

- 47,853Less than $10,000
- 80,198$10,000 to $19,999
- 76,075$20,000 to $29,999
- 77,813$30,000 to $39,999
- 75,241$40,000 to $49,999
- 69,636$50,000 to $59,999
- 94,933$60,000 to $74,999
- 121,009$75,000 to $99,999
- 90,473$100,000 to $124,999
- 53,928$125,000 to $149,999
- 59,208$150,000 to $199,999
- 50,139$200,000 or more
Percentage of workers working in this county: 28.1%
Number of people working at home: 158 (9.8% of all workers)
Travel time to work (commute)
- Less than 5 minutes: 72
- 5 to 9 minutes: 96
- 10 to 14 minutes: 120
- 15 to 19 minutes: 212
- 20 to 24 minutes: 105
- 25 to 29 minutes: 83
- 30 to 34 minutes: 172
- 35 to 39 minutes: 82
- 40 to 44 minutes: 86
- 45 to 59 minutes: 321
- 60 to 89 minutes: 71
- 90 or more minutes: 13
Means of transportation to work:
- Drove a car alone: 1,154 (80.0%)
- Carpooled: 257 (17.8%)
- Walked: 16 (1.1%)
- Other means: 6 (0.4%)
- Worked at home: 9 (0.6%)


- Year of entry for the foreign-born population in Center Point, Tennessee
- 261995 to March 2000
- 131990 to 1994
- 01985 to 1989
- 01980 to 1984
- 01975 to 1979
- 151970 to 1974
- 01965 to 1969
- 7Before 1965
Most common places of birth for foreign-born residents (%):
| Center Point: | 50.8% (31) |
| Tennessee: | 0.5% (791) |
| Center Point: | 21.3% (13) |
| Tennessee: | 28.1% (44,682) |
| Center Point: | 14.8% (9) |
| Tennessee: | 5.2% (8,316) |
| Center Point: | 13.1% (8) |
| Tennessee: | 0.3% (539) |
Place of birth for U.S.-born residents:
- This state: 2,492
- Other state: 560
- Northeast: 28
- Midwest: 132
- South: 353
- West: 47
63% of Center Point residents lived in the same house 5 years ago.
Out of people who lived in different houses, 33% lived in this county.
Out of people who lived in different counties, 74% lived in Tennessee.
Education attainment for males 25 years and older:
- No schooling: 28
- Nursery to 4th grade: 0
- 5th and 6th grade: 22
- 7th and 8th grade: 76
- 9th grade: 46
- 10th grade: 55
- 11th grade: 88
- 12th grade, no diploma: 73
- High school graduate (or equivalency): 364
- Less than 1 year of college: 35
- Some college more than 1 year, no degree: 130
- Associate degree: 14
- Bachelor's degree: 84
- Master's degree: 41
- Professional school degree: 12
- Doctorate degree: 0

Education attainment for females 25 years and older:
- No schooling: 7
- Nursery to 4th grade: 6
- 5th and 6th grade: 29
- 7th and 8th grade: 60
- 9th grade: 82
- 10th grade: 40
- 11th grade: 57
- 12th grade, no diploma: 84
- High school graduate (or equivalency): 311
- Less than 1 year of college: 65
- Some college more than 1 year, no degree: 127
- Associate degree: 88
- Bachelor's degree: 102
- Master's degree: 24
- Professional school degree: 13
- Doctorate degree: 0


Housing units in structures:
- One, detached: 939
- Two: 15
- 3 or 4: 11
- 10 to 19: 5
- Mobile homes: 350
Median worth of mobile homes: $47,554
Housing units lacking complete kitchen facilities: 1.3%

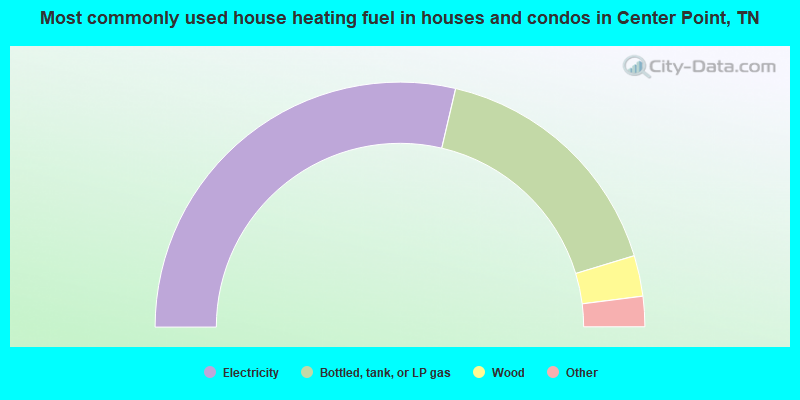
- 57.3%Electricity
- 33.3%Bottled, tank, or LP gas
- 5.4%Wood
- 2.0%Utility gas
- 1.9%Fuel oil, kerosene, etc.

- 58.2%Electricity
- 32.1%Bottled, tank, or LP gas
- 4.9%Fuel oil, kerosene, etc.
- 4.9%Wood
Private vs. public school enrollment:
| Here: | 8.5% |
| Tennessee: | 9.5% |
| Here: | 8.8% |
| Tennessee: | 10.4% |
| Here: | 54.5% |
| Tennessee: | 22.8% |


