Brookeville, MD (Maryland) Houses and Residents
| Brookeville: | $674,681 |
| Maryland: | $398,100 |
Mean price in 2022:
Detached houses: $691,379
Here: $691,379 State: $526,819
Total population: 138 (Urban population: 110, Rural population: 0)
Houses: 54 (53 occupied: 48 owner occupied, 5 renter occupied)
| % of renters here: | 9% |
| State: | 32% |
Housing density: 420 houses/condos per square mile
Median price asked for vacant for-sale houses and condos in 2022 in this county: $868,821.
Housing units in Brookeville with a mortgage: 38 (5 second mortgage, 0 home equity loan, 5 both second mortgage and home equity loan)
Houses without a mortgage: 0
Median household income for houses/condos with a mortgage: $184,286
Median monthly housing costs: $2,150
Compare current foreclosures near Brookeville, MD:
| Photo | Address | Area | Beds / Baths | Price | Details |
|---|---|---|---|---|---|

|
#1
Wingfield Ct
Brookeville, MD 20833
|
2,304 sq. feet
|
2 baths 3 beds |
show details | |

|
#2
Hawlings Ct
Brookeville, MD 20833
|
3,088 sq. feet
|
4 baths - beds |
show details | |

|
#3
Sapling Ridge Ln
Brookeville, MD 20833
|
3,702 sq. feet
|
3 baths - beds |
show details | |

|
#4
Georgia Ave
Brookeville, MD 20833
|
3,906 sq. feet
|
4 baths - beds |
show details | |

|
#5
Gold Mine Rd
Brookeville, MD 20833
|
3,788 sq. feet
|
3 baths - beds |
show details | |

|
#6
Powell Farm Pl
Brookeville, MD 20833
|
3,974 sq. feet
|
3 baths - beds |
show details | |

|
#7
Georgia Ave Apt H2
Brookeville, MD 20833
|
- sq. feet
|
- baths - beds |
show details | |

|
#8
Bowsprit Ln Apt 31
Laurel, MD 20707
|
1,020 sq. feet
|
2 baths 2 beds |
$260,000
|
show details |

|
#9
Pooks Hill Rd Apt 1612s
Bethesda, MD 20814
|
1,250 sq. feet
|
1 baths 2 beds |
$289,000
|
show details |

|
#10
S Leisure World Blvd # 29-1d
Silver Spring, MD 20906
|
990 sq. feet
|
1 baths 1 beds |
$129,900
|
show details |
| Photo | Address | Area | Beds / Baths | Price | Details |
|---|---|---|---|---|---|

|
#11
Mills Choice Rd Apt 4
Montgomery Village, MD 20886
|
842 sq. feet
|
1 baths 1 beds |
$149,900
|
show details |

|
#12
Brooke Knolls Rd
Gaithersburg, MD 20882
|
1,704 sq. feet
|
3 baths 4 beds |
$659,900
|
show details |

|
#13
23rd Pl
Hyattsville, MD 20783
|
1,188 sq. feet
|
2 baths 4 beds |
$344,500
|
show details |

|
#14
Rock Creek Church Rd NW
Washington, DC 20010
|
- sq. feet
|
4 baths 6 beds |
$738,400
|
show details |

|
#15
Caledonia Ct Apt K
Germantown, MD 20874
|
1,087 sq. feet
|
2 baths 2 beds |
show details | |

|
#16
Oglethorpe St Apt 717
Hyattsville, MD 20781
|
888 sq. feet
|
1 baths 2 beds |
show details | |

|
#17
3rd Pl NW
Washington, DC 20011
|
1,600 sq. feet
|
2 baths 4 beds |
show details | |

|
#18
Warren St NW
Washington, DC 20016
|
1,843 sq. feet
|
2 baths 3 beds |
show details | |

|
#19
Navahoe St
Hyattsville, MD 20783
|
1,068 sq. feet
|
2 baths 3 beds |
show details | |

|
#20
Peabody St NE
Washington, DC 20011
|
1,216 sq. feet
|
2 baths 3 beds |
show details |
| Photo | Address | Area | Beds / Baths | Price | Details |
|---|---|---|---|---|---|

|
#21
Old Bartholows Rd
Mount Airy, MD 21771
|
1,056 sq. feet
|
2 baths 2 beds |
show details | |

|
#22
9th St NW
Washington, DC 20012
|
1,518 sq. feet
|
3 baths 3 beds |
show details | |

|
#23
Brink Rd
Gaithersburg, MD 20882
|
1,758 sq. feet
|
1 baths 2 beds |
show details | |

|
#24
Longfellow St NW
Washington, DC 20011
|
2,340 sq. feet
|
3 baths 4 beds |
show details | |

|
#25
Conductor Way # 189
Silver Spring, MD 20904
|
663 sq. feet
|
2 baths 3 beds |
show details | |

|
#26
43rd Pl NW
Washington, DC 20016
|
1,008 sq. feet
|
1 baths 2 beds |
show details | |

|
#27
Oakland Mills Rd
Columbia, MD 21046
|
- sq. feet
|
3 baths 4 beds |
show details | |

|
#28
16th St NW
Washington, DC 20012
|
3,692 sq. feet
|
6 baths 5 beds |
show details | |

|
#29
Chiswick Ct # 37-A
Silver Spring, MD 20906
|
1,513 sq. feet
|
2 baths 2 beds |
show details | |

|
#30
Earlham Dr
Bethesda, MD 20817
|
2,020 sq. feet
|
3 baths 5 beds |
show details |
| Photo | Address | Area | Beds / Baths | Price | Details |
|---|---|---|---|---|---|

|
#31
7th St NE
Washington, DC 20017
|
1,982 sq. feet
|
3 baths 3 beds |
show details | |

|
#32
Mitzy Ln
Ellicott City, MD 21043
|
2,150 sq. feet
|
2 baths 4 beds |
show details | |

|
#33
Van Ness St NW
Washington, DC 20016
|
1,322 sq. feet
|
2 baths 3 beds |
show details | |

|
#34
Georgia Ave NW
Washington, DC 20011
|
1,614 sq. feet
|
2 baths 3 beds |
show details | |

|
#35
Gaither Rd
Sykesville, MD 21784
|
2,191 sq. feet
|
2 baths 3 beds |
show details | |

|
#36
9th St NW
Washington, DC 20011
|
1,116 sq. feet
|
2 baths 4 beds |
show details | |

|
#37
Tamarack St NW
Washington, DC 20012
|
1,752 sq. feet
|
3 baths 4 beds |
show details | |

|
#38
Southway Unit F
Greenbelt, MD 20770
|
858 sq. feet
|
1 baths 2 beds |
show details | |

|
#39
Illinois Ave NW
Washington, DC 20011
|
1,856 sq. feet
|
4 baths 3 beds |
show details | |

|
#40
1st Pl NW Apt 403
Washington, DC 20011
|
950 sq. feet
|
2 baths 2 beds |
show details |
| Photo | Address | Area | Beds / Baths | Price | Details |
|---|---|---|---|---|---|

|
#41
New Hampshire Ave NW
Washington, DC 20011
|
1,260 sq. feet
|
3 baths 3 beds |
show details | |

|
#42
Berryville Rd
Germantown, MD 20874
|
960 sq. feet
|
1 baths 3 beds |
show details | |

|
#43
Connecticut Ave NW Apt 211
Washington, DC 20008
|
761 sq. feet
|
1 baths 1 beds |
show details | |

|
#44
Redwood Ter NW
Washington, DC 20012
|
2,599 sq. feet
|
5 baths 4 beds |
show details | |

|
#45
N Capitol St NE
Washington, DC 20011
|
1,216 sq. feet
|
2 baths 3 beds |
show details | |

|
#46
Flower Hill Way
Gaithersburg, MD 20879
|
1,782 sq. feet
|
3 baths 4 beds |
show details | |

|
#47
13th Ave
Hyattsville, MD 20782
|
1,598 sq. feet
|
1 baths 4 beds |
show details | |

|
#48
13th St NW
Washington, DC 20012
|
2,404 sq. feet
|
4 baths 4 beds |
show details | |

|
#49
Galloway St NE
Washington, DC 20017
|
1,444 sq. feet
|
2 baths 4 beds |
show details | |

|
Check over 1 million property listings on Foreclosure.com!
|
browse all offers | |||

Latest news about housing in Brookeville, MD collected exclusively by city-data.com from local newspapers, TV, and radio stations


Median year apartment built: 1955
Household type by relationship:
Households: 163- Male householders: 33 (0 living alone), Female householders: 18 (0 living alone)
43 spouses (41 opposite-sex spouses), 1 unmarried partners, (1 opposite-sex unmarried partners), 54 children (52 natural, 0 adopted, 1 stepchildren), 2 grandchildren, 0 brothers or sisters, 0 parents, 0 foster children, 6 other relatives, 0 non-relatives
Size of family households: 30 2-persons, 4 3-persons, 5 4-persons, 9 5-persons.
Size of nonfamily households: 2 2-persons.
33 married couples with children.
0 single-parent households (0 men, 0 women).
96.2% of residents of Brookeville speak English at home.
0.6% of residents speak other Indo-European language at home (100% speak English very well).
Foreign born population: 1 (0.6%)
(100.0% of them are naturalized citizens)
| Here: | 7.6 |
| State: | 7.3 |
| Here: | 6.3 |
| State: | 4.2 |

- Bedrooms in owner-occupied houses and condos in Brookeville, Maryland
- 0no bedroom
- 01 bedroom
- 92 bedrooms
- 153 bedrooms
- 164 bedrooms
- 85+ bedrooms

- Bedrooms in renter-occupied apartments in Brookeville, Maryland
- 0no bedroom
- 01 bedroom
- 32 bedrooms
- 13 bedrooms
- 14 bedrooms
- 05+ bedrooms

- Cars and other vehicles available in Brookeville in owner-occupied houses/condos
- 0no vehicle
- 41 vehicle
- 322 vehicles
- 83 vehicles
- 34 vehicles
- 15+ vehicles

- Cars and other vehicles available in Brookeville in renter-occupied apartments
- 0no vehicle
- 01 vehicle
- 42 vehicles
- 03 vehicles
- 04 vehicles
- 15+ vehicles

- Rooms in owner-occupied houses in Brookeville, Maryland
- 01 room
- 02 rooms
- 03 rooms
- 04 rooms
- 25 rooms
- 116 rooms
- 107 rooms
- 58 rooms
- 209+ rooms

- Rooms in renter-occupied apartments in Brookeville, Maryland
- 01 room
- 02 rooms
- 03 rooms
- 04 rooms
- 05 rooms
- 36 rooms
- 17 rooms
- 18 rooms
- 09+ rooms


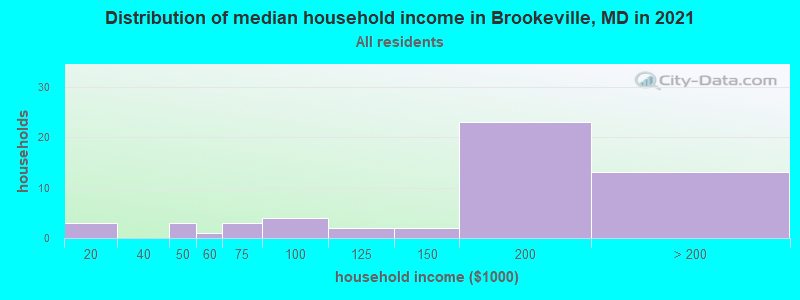
Brookeville, MD household income distribution

- 4$10,000 to $19,999
- 3$40,000 to $49,999
- 1$50,000 to $59,999
- 5$60,000 to $74,999
- 3$75,000 to $99,999
- 3$100,000 to $124,999
- 1$125,000 to $149,999
- 17$150,000 to $199,999
- 16$200,000 or more
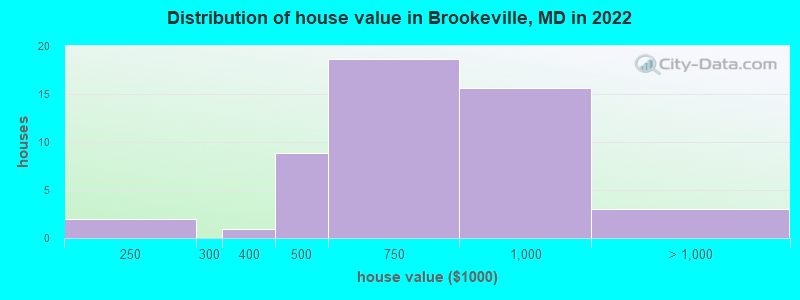
Home value of owner - occupied houses in 2022 in Brookeville, MD
-
- 2$200,000 to $249,999
- 0$300,000 to $399,999
- 8$400,000 to $499,999
- 18$500,000 to $749,999
- 15$750,000 to $999,999
- 3$1,000,000 to $1,499,999
Rent paid by renters in 2022 in Brookeville, MD
-
- 1$1,000 to $1,249
- 2$3,000 to $3,499
- 1No cash rent


Percentage of workers working in this county: 68.9%
Number of people working at home: 15 (16.7% of all workers)
Travel time to work (commute)
- Less than 5 minutes: 0
- 5 to 9 minutes: 5
- 10 to 14 minutes: 11
- 15 to 19 minutes: 13
- 20 to 24 minutes: 11
- 25 to 29 minutes: 5
- 30 to 34 minutes: 4
- 35 to 39 minutes: 0
- 40 to 44 minutes: 0
- 45 to 59 minutes: 12
- 60 to 89 minutes: 8
- 90 or more minutes: 0
Means of transportation to work:
- Drove a car alone: 36 (63.2%)
- Carpooled: 7 (12.3%)
- Walked: 6 (10.5%)
- Worked at home: 8 (14.0%)


First ancestries reported:
- European: 24 (35.9%)
- American: 12 (18.0%)
- English: 7 (10.5%)
- Italian: 7 (10.5%)
- Albanian: 4 (6.0%)
- German: 2 (3.0%)
- Scotch-Irish: 1 (1.5%)
Most common places of birth for foreign-born residents (%):
Place of birth for U.S.-born residents:
- This state: 91
- Other state: 59
- Northeast: 22
- Midwest: 5
- South: 22
- West: 7
85.8% of Brookeville residents lived in the same house 1 years ago.
Out of people who lived in different houses, 43.2% lived in this county.
Out of people who lived in different counties, 0.0% lived in Maryland.
| Brookeville: | 85.8% |
| State average: | 88.5% |
Education attainment for males 25 years and older:
- No schooling: 0
- Nursery to 4th grade: 0
- 5th and 6th grade: 0
- 7th and 8th grade: 0
- 9th grade: 0
- 10th grade: 0
- 11th grade: 0
- 12th grade, no diploma: 0
- High school graduate (or equivalency): 4
- Less than 1 year of college: 1
- Some college more than 1 year, no degree: 7
- Associate degree: 2
- Bachelor's degree: 30
- Master's degree: 7
- Professional school degree: 0
- Doctorate degree: 1

Education attainment for females 25 years and older:
- No schooling: 0
- Nursery to 4th grade: 0
- 5th and 6th grade: 0
- 7th and 8th grade: 0
- 9th grade: 0
- 10th grade: 0
- 11th grade: 0
- 12th grade, no diploma: 1
- High school graduate (or equivalency): 11
- Less than 1 year of college: 0
- Some college more than 1 year, no degree: 10
- Associate degree: 3
- Bachelor's degree: 8
- Master's degree: 26
- Professional school degree: 0
- Doctorate degree: 3


Housing units in structures:
- One, detached: 53
- One, attached: 1
House/condo owner moved in on average 16 years ago
Renter moved in on average 7 years ago

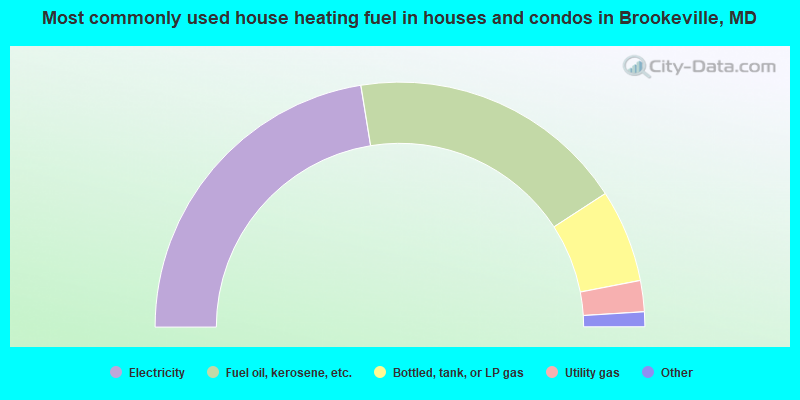
- 45.8%Electricity
- 37.5%Fuel oil, kerosene, etc.
- 12.5%Bottled, tank, or LP gas
- 4.2%Utility gas

- 80.0%Fuel oil, kerosene, etc.
- 20.0%Electricity
Private vs. public school enrollment:
| Here: | 59.1% |
| Maryland: | 15.2% |
| Here: | 50.0% |
| Maryland: | 14.4% |


