Bethel Island, CA (California) Houses and Residents
| Bethel Island: | $522,801 |
| California: | $715,900 |
Total population: 2,137 (All urban)
Houses: 1,116 (853 occupied: 626 owner occupied, 229 renter occupied)
| % of renters here: | 27% |
| State: | 44% |
Housing density: 217 houses/condos per square mile
Median price asked for vacant for-sale houses and condos in 2022: $205,866.
Median contract rent in 2022: $1,226 (lower quartile is $1,067, upper quartile is $1,396)
Median rent asked for vacant for-rent units in 2022: $1,887
Median gross rent in Bethel Island, CA in 2022: $1,351
Housing units in Bethel Island with a mortgage: 327 (21 second mortgage, 25 home equity loan, 0 both second mortgage and home equity loan)
Houses without a mortgage: 0
Median household income for houses/condos with a mortgage: $174,791
Median household income for apartments without a mortgage: $75,832
Median monthly housing costs: $1,373
Compare current foreclosures near Bethel Island, CA:
| Photo | Address | Area | Beds / Baths | Price | Details |
|---|---|---|---|---|---|

|
#1
Quail Lakes Dr Apt 126
Stockton, CA 95207
|
612 sq. feet
|
1 baths 1 beds |
$169,888
|
show details |

|
#2
E 12th St
Pittsburg, CA 94565
|
1,345 sq. feet
|
1 baths 2 beds |
$507,000
|
show details |

|
#3
Yellowstone Cir
Discovery Bay, CA 94505
|
3,092 sq. feet
|
3 baths 4 beds |
show details | |

|
#4
Doolittle Way
Antioch, CA 94509
|
2,318 sq. feet
|
3 baths 4 beds |
show details | |

|
#5
Lido Cir
Discovery Bay, CA 94505
|
1,555 sq. feet
|
2 baths 3 beds |
show details | |

|
#6
Rome Ct
Pittsburg, CA 94565
|
1,430 sq. feet
|
2 baths 3 beds |
show details | |

|
#7
Shetland Way
Antioch, CA 94531
|
3,249 sq. feet
|
3 baths 5 beds |
show details | |

|
#8
Branchwood Dr
Rio Vista, CA 94571
|
2,302 sq. feet
|
3 baths 2 beds |
show details | |

|
#9
Palisades Dr
Rio Vista, CA 94571
|
1,172 sq. feet
|
2 baths 2 beds |
show details | |

|
#10
Mare Ct
Antioch, CA 94531
|
- sq. feet
|
3 baths 5 beds |
show details |
| Photo | Address | Area | Beds / Baths | Price | Details |
|---|---|---|---|---|---|

|
#11
Monte Diablo Ave Unit 4
Stockton, CA 95203
|
924 sq. feet
|
1 baths 2 beds |
show details | |

|
#12
Beaver Ct
Discovery Bay, CA 94505
|
1,692 sq. feet
|
2 baths 3 beds |
show details | |

|
#13
W Highway 12
Lodi, CA 95242
|
1,591 sq. feet
|
1 baths 2 beds |
show details | |

|
#14
Meredith Way
Antioch, CA 94509
|
1,508 sq. feet
|
2 baths 3 beds |
show details | |

|
#15
Arthur Way
Antioch, CA 94509
|
1,595 sq. feet
|
2 baths 4 beds |
show details | |

|
#16
Hilliard Cir
Antioch, CA 94509
|
2,332 sq. feet
|
3 baths 4 beds |
show details | |

|
#17
Turnberry Ter
Rio Vista, CA 94571
|
970 sq. feet
|
2 baths 2 beds |
show details | |

|
#18
Anglebrook
Rio Vista, CA 94571
|
1,439 sq. feet
|
2 baths 2 beds |
show details | |

|
#19
Don Conti Ln
Stockton, CA 95219
|
2,161 sq. feet
|
3 baths 5 beds |
show details | |

|
#20
Shadow Creek Dr
Rio Vista, CA 94571
|
1,359 sq. feet
|
2 baths 2 beds |
show details |
| Photo | Address | Area | Beds / Baths | Price | Details |
|---|---|---|---|---|---|

|
#21
Cape May Dr
Pittsburg, CA 94565
|
1,865 sq. feet
|
2 baths 4 beds |
show details | |

|
#22
N Pershing Ave
Stockton, CA 95207
|
1,951 sq. feet
|
2 baths 3 beds |
show details | |

|
#23
Rosemarie Ln Apt 103
Stockton, CA 95207
|
906 sq. feet
|
1 baths 2 beds |
show details | |

|
#24
Peppermill Ln
Pittsburg, CA 94565
|
1,092 sq. feet
|
2 baths 2 beds |
show details | |

|
#25
Merritt Dr
Stockton, CA 95219
|
3,166 sq. feet
|
3 baths 5 beds |
show details | |

|
#26
Waudman Ave
Stockton, CA 95209
|
1,503 sq. feet
|
2 baths 3 beds |
show details | |

|
#27
Westchester Cir
Stockton, CA 95219
|
3,033 sq. feet
|
3 baths 5 beds |
show details | |

|
#28
Morgan Pl Apt 18
Stockton, CA 95219
|
1,009 sq. feet
|
1 baths 2 beds |
show details | |

|
#29
Siskiyou Ln
Stockton, CA 95209
|
1,807 sq. feet
|
2 baths 4 beds |
show details | |

|
#30
Sea Point Way
Pittsburg, CA 94565
|
1,643 sq. feet
|
2 baths 3 beds |
show details |
| Photo | Address | Area | Beds / Baths | Price | Details |
|---|---|---|---|---|---|

|
#31
Shasta Cir
Pittsburg, CA 94565
|
1,053 sq. feet
|
1 baths 3 beds |
show details | |

|
#32
Orinda Cir
Pittsburg, CA 94565
|
1,349 sq. feet
|
2 baths 3 beds |
show details | |

|
#33
W 4th St
Pittsburg, CA 94565
|
2,017 sq. feet
|
2 baths 4 beds |
show details | |

|
#34
Pasco Dr
Brentwood, CA 94513
|
1,183 sq. feet
|
1 baths 3 beds |
show details | |

|
#35
Brockton Pl
Rio Vista, CA 94571
|
1,420 sq. feet
|
2 baths 2 beds |
show details | |

|
#36
Brockton Pl
Rio Vista, CA 94571
|
1,767 sq. feet
|
2 baths 2 beds |
show details | |

|
#37
Scudero Cir
Pittsburg, CA 94565
|
1,883 sq. feet
|
2 baths 4 beds |
show details | |

|
#38
Yellowstone Dr
Antioch, CA 94509
|
2,128 sq. feet
|
3 baths 4 beds |
show details | |

|
#39
Searsport Ct
Antioch, CA 94509
|
1,879 sq. feet
|
2 baths 4 beds |
show details | |

|
#40
Bonita Ave
Antioch, CA 94509
|
1,133 sq. feet
|
2 baths 3 beds |
show details |
| Photo | Address | Area | Beds / Baths | Price | Details |
|---|---|---|---|---|---|

|
#41
Merrill Dr
Antioch, CA 94509
|
2,113 sq. feet
|
3 baths 3 beds |
show details | |

|
#42
Rocky Point Dr
Antioch, CA 94531
|
3,937 sq. feet
|
4 baths 6 beds |
show details | |

|
#43
Quail Lakes Dr
Stockton, CA 95207
|
1,696 sq. feet
|
2 baths 2 beds |
show details | |

|
#44
Beede Way
Antioch, CA 94509
|
1,740 sq. feet
|
2 baths 2 beds |
show details | |

|
#45
4th Street
Isleton, CA 95641
|
1,634 sq. feet
|
2 baths 3 beds |
show details | |

|
#46
Granite Cir
Antioch, CA 94509
|
1,600 sq. feet
|
2 baths 3 beds |
show details | |

|
#47
Edgeview Way
Discovery Bay, CA 94505
|
2,585 sq. feet
|
3 baths 4 beds |
show details | |

|
#48
Belshaw St
Antioch, CA 94509
|
1,099 sq. feet
|
1 baths 3 beds |
show details | |

|
#49
Nandina Ct
Antioch, CA 94531
|
1,267 sq. feet
|
2 baths 3 beds |
show details | |

|
Check over 1 million property listings on Foreclosure.com!
|
browse all offers | |||


 | Demographics and changes in the outer East Bay (675 replies) |
| Can I put a manufactured home on a lot in Orinda? (12 replies) |
| Can it be done: Affordable housing near water in California? (52 replies) |
| landfill the bay (91 replies) |
| STOCKTON--water from SJ River (4 replies) |
| Concord, California? (26 replies) |

Median year apartment built: 1977
Household type by relationship:
Households: 1,983- Male householders: 445 (213 living alone), Female householders: 392 (92 living alone)
330 spouses (316 opposite-sex spouses), 52 unmarried partners, (52 opposite-sex unmarried partners), 423 children (423 natural, 0 adopted, 0 stepchildren), 8 grandchildren, 35 brothers or sisters, 23 parents, 0 foster children, 124 other relatives, 145 non-relatives
Size of family households: 179 2-persons, 136 4-persons, 93 5-persons.
Size of nonfamily households: 310 1-person, 145 2-persons.
281 married couples with children.
0 single-parent households (0 men, 0 women).
73.8% of residents of Bethel Island speak English at home.
21.2% of residents speak Spanish at home (74% speak English very well, 18% speak English well, 8% speak English not well).
3.3% of residents speak Asian or Pacific Island language at home (100% speak English very well).
Foreign born population: 369 (18.6%)
(66.1% of them are naturalized citizens)
| Here: | 6.1 |
| State: | 6.0 |
| Here: | 4.6 |
| State: | 3.9 |

- Bedrooms in owner-occupied houses and condos in Bethel Island, California
- 0no bedroom
- 451 bedroom
- 442 bedrooms
- 3603 bedrooms
- 1784 bedrooms
- 05+ bedrooms

- Bedrooms in renter-occupied apartments in Bethel Island, California
- 40no bedroom
- 681 bedroom
- 372 bedrooms
- 853 bedrooms
- 04 bedrooms
- 05+ bedrooms

- Cars and other vehicles available in Bethel Island in owner-occupied houses/condos
- 0no vehicle
- 821 vehicle
- 3712 vehicles
- 853 vehicles
- 244 vehicles
- 635+ vehicles

- Cars and other vehicles available in Bethel Island in renter-occupied apartments
- 40no vehicle
- 321 vehicle
- 1322 vehicles
- 263 vehicles
- 04 vehicles
- 05+ vehicles

- Rooms in owner-occupied houses in Bethel Island, California
- 01 room
- 02 rooms
- 03 rooms
- 1404 rooms
- 175 rooms
- 2446 rooms
- 617 rooms
- 248 rooms
- 1399+ rooms

- Rooms in renter-occupied apartments in Bethel Island, California
- 401 room
- 02 rooms
- 683 rooms
- 04 rooms
- 955 rooms
- 06 rooms
- 277 rooms
- 08 rooms
- 09+ rooms


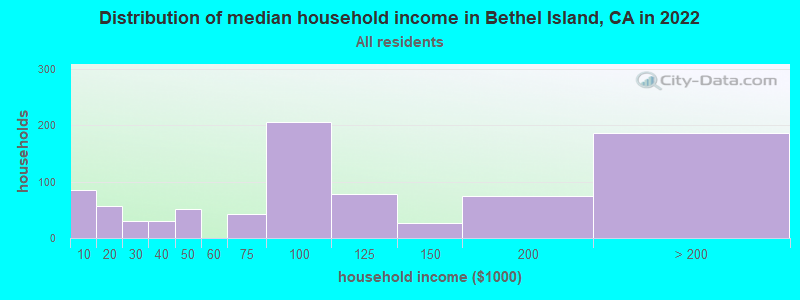
Bethel Island, CA household income distribution

- 86Less than $10,000
- 57$10,000 to $19,999
- 31$20,000 to $29,999
- 30$30,000 to $39,999
- 51$40,000 to $49,999
- 43$60,000 to $74,999
- 206$75,000 to $99,999
- 78$100,000 to $124,999
- 26$125,000 to $149,999
- 74$150,000 to $199,999
- 186$200,000 or more
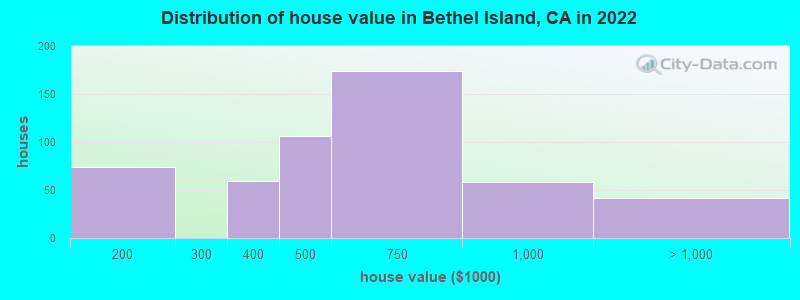
Home value of owner - occupied houses in 2022 in Bethel Island, CA
-
- 74$175,000 to $199,999
- 58$300,000 to $399,999
- 106$400,000 to $499,999
- 174$500,000 to $749,999
- 57$750,000 to $999,999
- 24$1,000,000 to $1,499,999
- 17$2,000,000 or more
Rent paid by renters in 2022 in Bethel Island, CA
-
- 42$600 to $649
- 40$1,000 to $1,249
- 89$1,250 to $1,499
- 75No cash rent


Percentage of workers working in this county: 74.7%
Number of people working at home: 73 (9.7% of all workers)
Travel time to work (commute)
- Less than 5 minutes: 74
- 5 to 9 minutes: 111
- 10 to 14 minutes: 138
- 15 to 19 minutes: 0
- 20 to 24 minutes: 0
- 25 to 29 minutes: 8
- 30 to 34 minutes: 109
- 35 to 39 minutes: 0
- 40 to 44 minutes: 0
- 45 to 59 minutes: 0
- 60 to 89 minutes: 158
- 90 or more minutes: 31
Means of transportation to work:
- Drove a car alone: 789 (78.7%)
- Carpooled: 132 (13.2%)
- Motorcycle: 8 (0.8%)
- Walked: 29 (2.9%)
- Worked at home: 45 (4.5%)

- Unemployment by race in 2022
- Unemployment rate for White non-Hispanic residents
- 26.6%Males
- 8.1%Females
- Unemployment rate for other race residents
- 21.2%Males
- Unemployment rate for Hispanic or Latino residents
- 13.6%Males

- Year of entry for the foreign-born population in Bethel Island, California
- 02010 or later
- 1052000 to 2009
- 621990 to 1999
- 171980 to 1989
- 181970 to 1979
- 47Before 1970

First ancestries reported:
- Italian: 184 (13.7%)
- German: 134 (10.0%)
- Swedish: 77 (5.7%)
- Norwegian: 76 (5.7%)
- Scottish: 57 (4.3%)
- Irish: 52 (3.9%)
- Swiss: 50 (3.7%)
- Portuguese: 35 (2.6%)
- English: 34 (2.5%)
- American: 23 (1.7%)
Most common places of birth for foreign-born residents (%):
| Bethel Island: | 35.5% (124) |
| California: | 37.2% (3,881,193) |
| Bethel Island: | 13.8% (48) |
| California: | 3.0% (315,248) |
| Bethel Island: | 10.6% (37) |
| California: | 0.1% (9,159) |
| Bethel Island: | 10.3% (36) |
| California: | 1.2% (127,477) |
| Bethel Island: | 9.2% (32) |
| California: | 0.2% (18,925) |
| Bethel Island: | 8.3% (29) |
| California: | 0.6% (57,953) |
| Bethel Island: | 6.9% (24) |
| California: | 1.0% (105,215) |
Place of birth for U.S.-born residents:
- This state: 1,163
- Other state: 431
- Northeast: 145
- Midwest: 146
- South: 89
- West: 54
84.7% of Bethel Island residents lived in the same house 1 years ago.
Out of people who lived in different houses, 36.8% lived in this county.
Out of people who lived in different counties, 100.0% lived in California.
| Bethel Island: | 84.7% |
| State average: | 88.9% |
Education attainment for males 25 years and older:
- No schooling: 0
- Nursery to 4th grade: 0
- 5th and 6th grade: 44
- 7th and 8th grade: 0
- 9th grade: 0
- 10th grade: 34
- 11th grade: 29
- 12th grade, no diploma: 34
- High school graduate (or equivalency): 245
- Less than 1 year of college: 44
- Some college more than 1 year, no degree: 103
- Associate degree: 96
- Bachelor's degree: 14
- Master's degree: 72
- Professional school degree: 36
- Doctorate degree: 0

Education attainment for females 25 years and older:
- No schooling: 0
- Nursery to 4th grade: 0
- 5th and 6th grade: 26
- 7th and 8th grade: 0
- 9th grade: 0
- 10th grade: 0
- 11th grade: 0
- 12th grade, no diploma: 32
- High school graduate (or equivalency): 150
- Less than 1 year of college: 75
- Some college more than 1 year, no degree: 102
- Associate degree: 77
- Bachelor's degree: 139
- Master's degree: 121
- Professional school degree: 0
- Doctorate degree: 0


Housing units in structures:
- One, detached: 731
- Two: 39
- Mobile homes: 345
Housing units lacking complete kitchen facilities in 2022: 13.2%
House/condo owner moved in on average 6 years ago
Renter moved in on average 1 years ago

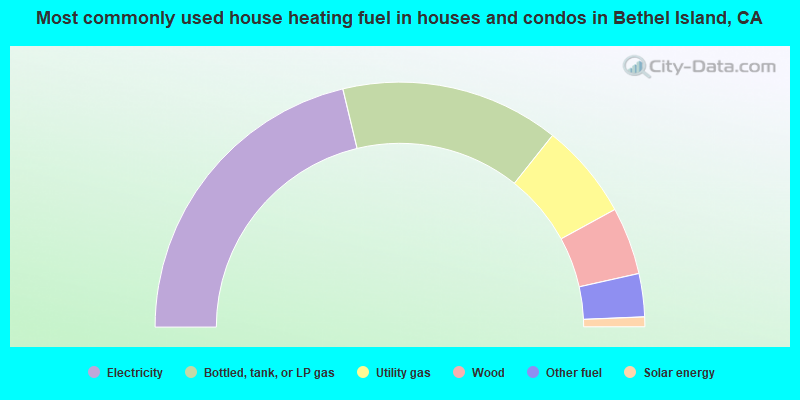
- 42.5%Electricity
- 28.9%Bottled, tank, or LP gas
- 12.7%Utility gas
- 8.9%Wood
- 5.7%Other fuel
- 1.3%Solar energy
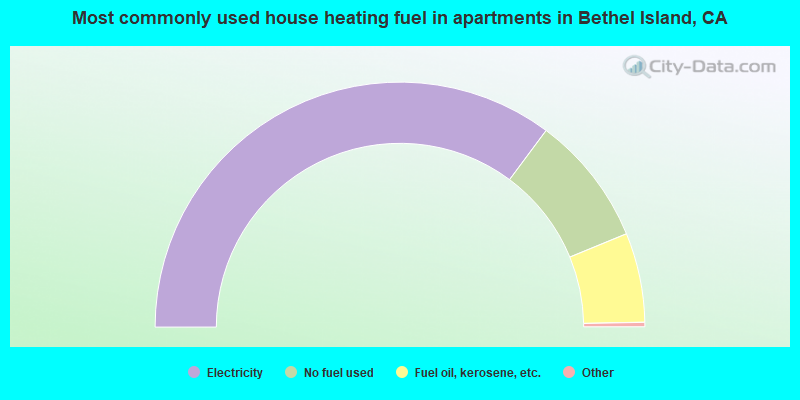
- 70.8%Electricity
- 17.3%No fuel used
- 11.9%Fuel oil, kerosene, etc.
Private vs. public school enrollment:
| Here: | 12.9% |
| California: | 10.5% |
| Here: | 0.0% |
| California: | 8.5% |
| Here: | 0.0% |
| California: | 15.9% |


