Bellevue-Joy, TX (Texas) Houses and Residents
| Bellevue-Joy: | $174,064 |
| Texas: | $275,400 |
Total population: 1,706 (Urban population: 0, Rural population: 1,716 (323 farm, 1,393 nonfarm))
Houses: 781 (651 occupied: 545 owner occupied, 106 renter occupied)
| % of renters here: | 16% |
| State: | 38% |
Housing density: 2 houses/condos per square mile
Median price asked for vacant for-sale houses and condos in 2022 in this county: $115,218.
Median contract rent in 2022: $588 (lower quartile is $382, upper quartile is $797)
Median rent asked for vacant for-rent units in 2022: $634
Median gross rent in Bellevue-Joy, TX in 2022: $850
Housing units in Bellevue-Joy with a mortgage: 91 (3 second mortgage, 6 home equity loan, 3 both second mortgage and home equity loan)
Houses without a mortgage: 163


Household type by relationship:
Households: 10,682- In family households: 9,320 (2,428 male householders, 715 female householders)
2,626 spouses, 2,764 children (2,395 natural, 106 adopted, 263 stepchildren), 331 grandchildren, 58 brothers or sisters, 86 parents, foster children, 83 other relatives, 175 non-relatives
- In nonfamily households: 1,362 (573 male householders (474 living alone)), 603 female householders (557 living alone)), 186 nonrelatives
- In group quarters: 70 (all institutionalized)
2,035 married couples with children.
389 single-parent households (116 men, 273 women).
96.2% of residents of Bellevue-Joy speak English at home.
3.0% of residents speak Spanish at home (46% speak English very well, 19% speak English well, 31% speak English not well, 4% don't speak English at all).
0.5% of residents speak other Indo-European language at home (100% speak English very well).
0.1% of residents speak Asian or Pacific Island language at home (100% speak English very well).
0.1% of residents speak other language at home (100% speak English very well).
Foreign born population: 49 (2.1%)
(14.3% of them are naturalized citizens)
| Here: | 6.0 |
| State: | 6.3 |
| Here: | 6.0 |
| State: | 4.0 |

- Bedrooms in owner-occupied houses and condos in Bellevue-Joy, Texas
- 2no bedroom
- 181 bedroom
- 1632 bedrooms
- 2713 bedrooms
- 804 bedrooms
- 115+ bedrooms

- Bedrooms in renter-occupied apartments in Bellevue-Joy, Texas
- 0no bedroom
- 81 bedroom
- 482 bedrooms
- 403 bedrooms
- 94 bedrooms
- 15+ bedrooms

- Cars and other vehicles available in Bellevue-Joy in owner-occupied houses/condos
- 18no vehicle
- 1221 vehicle
- 2322 vehicles
- 1273 vehicles
- 374 vehicles
- 95+ vehicles

- Cars and other vehicles available in Bellevue-Joy in renter-occupied apartments
- 5no vehicle
- 291 vehicle
- 572 vehicles
- 153 vehicles
- 04 vehicles
- 05+ vehicles

- Rooms in owner-occupied houses in Bellevue-Joy, Texas
- 21 room
- 02 rooms
- 203 rooms
- 624 rooms
- 1645 rooms
- 1486 rooms
- 897 rooms
- 348 rooms
- 269+ rooms

- Rooms in renter-occupied apartments in Bellevue-Joy, Texas
- 01 room
- 42 rooms
- 133 rooms
- 194 rooms
- 305 rooms
- 276 rooms
- 127 rooms
- 08 rooms
- 19+ rooms


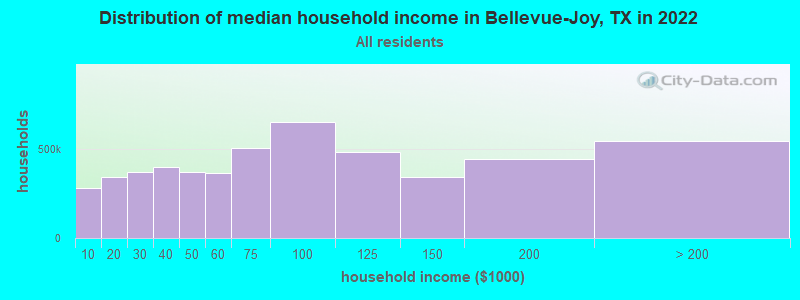
Bellevue-Joy, TX household income distribution

- 82,617Less than $10,000
- 112,318$10,000 to $19,999
- 122,190$20,000 to $29,999
- 128,698$30,000 to $39,999
- 121,420$40,000 to $49,999
- 116,531$50,000 to $59,999
- 161,314$60,000 to $74,999
- 220,876$75,000 to $99,999
- 167,437$100,000 to $124,999
- 123,442$125,000 to $149,999
- 143,550$150,000 to $199,999
- 161,355$200,000 or more
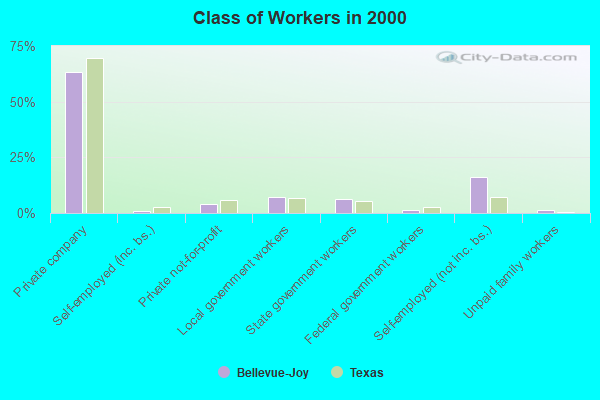
Percentage of workers working in this county: 35.0%
Number of people working at home: 120 (11.1% of all workers)
Travel time to work (commute)
- Less than 5 minutes: 42
- 5 to 9 minutes: 77
- 10 to 14 minutes: 57
- 15 to 19 minutes: 101
- 20 to 24 minutes: 80
- 25 to 29 minutes: 8
- 30 to 34 minutes: 78
- 35 to 39 minutes: 35
- 40 to 44 minutes: 35
- 45 to 59 minutes: 139
- 60 to 89 minutes: 41
- 90 or more minutes: 40
Means of transportation to work:
- Drove a car alone: 563 (71.1%)
- Carpooled: 130 (16.4%)
- Bus or trolley bus: 9 (1.1%)
- Walked: 21 (2.7%)
- Other means: 10 (1.3%)
- Worked at home: 59 (7.4%)

- Year of entry for the foreign-born population in Bellevue-Joy, Texas
- 21995 to March 2000
- 151990 to 1994
- 21985 to 1989
- 01980 to 1984
- 01975 to 1979
- 21970 to 1974
- 01965 to 1969
- 1Before 1965
Most common places of birth for foreign-born residents (%):
| Bellevue-Joy: | 95.5% (21) |
| Texas: | 64.8% (1,879,369) |
Place of birth for U.S.-born residents:
- This state: 1,452
- Other state: 230
- Northeast: 15
- Midwest: 36
- South: 97
- West: 82
66% of Bellevue-Joy residents lived in the same house 5 years ago.
Out of people who lived in different houses, 31% lived in this county.
Out of people who lived in different counties, 83% lived in Texas.
Education attainment for males 25 years and older:
- No schooling: 6
- Nursery to 4th grade: 2
- 5th and 6th grade: 4
- 7th and 8th grade: 15
- 9th grade: 19
- 10th grade: 24
- 11th grade: 22
- 12th grade, no diploma: 20
- High school graduate (or equivalency): 251
- Less than 1 year of college: 40
- Some college more than 1 year, no degree: 50
- Associate degree: 6
- Bachelor's degree: 56
- Master's degree: 14
- Professional school degree: 5
- Doctorate degree: 2

Education attainment for females 25 years and older:
- No schooling: 0
- Nursery to 4th grade: 0
- 5th and 6th grade: 2
- 7th and 8th grade: 27
- 9th grade: 15
- 10th grade: 10
- 11th grade: 31
- 12th grade, no diploma: 23
- High school graduate (or equivalency): 225
- Less than 1 year of college: 38
- Some college more than 1 year, no degree: 84
- Associate degree: 33
- Bachelor's degree: 68
- Master's degree: 14
- Professional school degree: 3
- Doctorate degree: 0


Housing units in structures:
- One, detached: 602
- One, attached: 9
- Mobile homes: 168
- Boats, RVs, vans, etc.: 2
Median worth of mobile homes: $77,441
Housing units lacking complete kitchen facilities: 2.7%

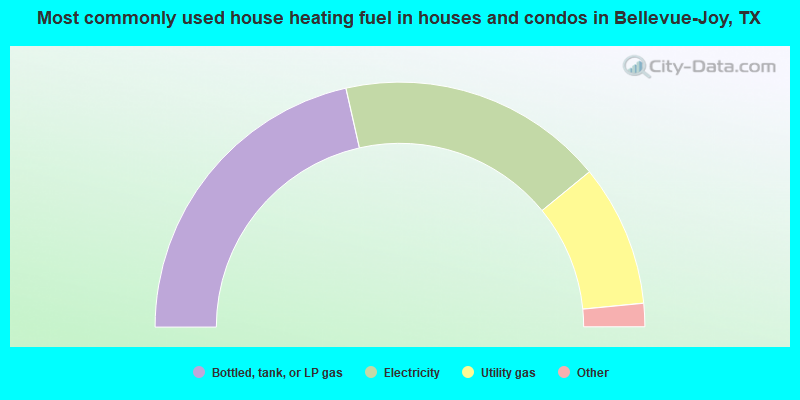
- 42.9%Bottled, tank, or LP gas
- 35.2%Electricity
- 18.7%Utility gas
- 2.6%Wood
- 0.4%Fuel oil, kerosene, etc.
- 0.2%No fuel used
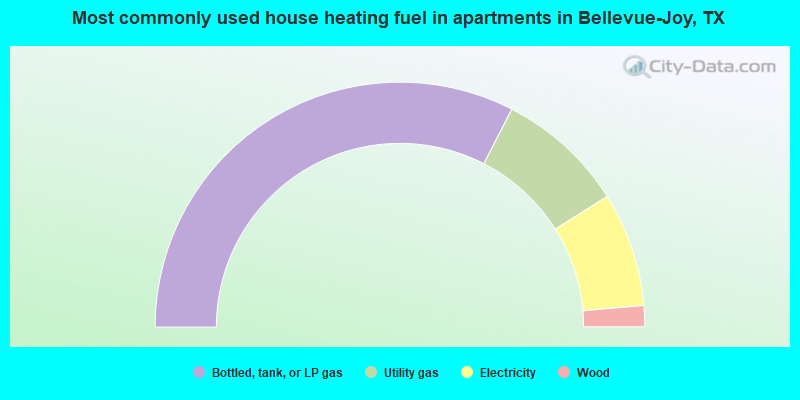
- 65.1%Bottled, tank, or LP gas
- 17.0%Utility gas
- 15.1%Electricity
- 2.8%Wood
Private vs. public school enrollment:
| Here: | 0.0% |
| Texas: | 6.8% |
| Here: | 1.7% |
| Texas: | 6.2% |
| Here: | 0.0% |
| Texas: | 15.4% |


