Beaverton, OR (Oregon) Houses and Residents
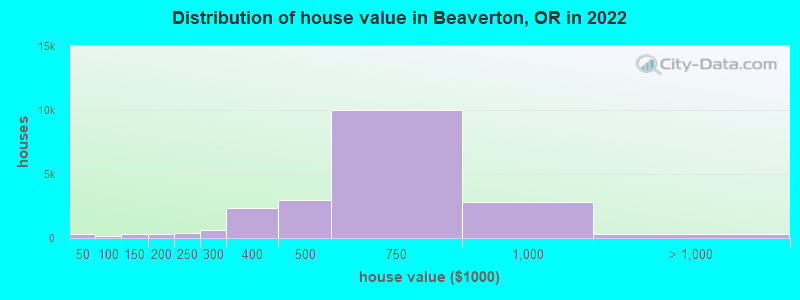
Estimated median house or condo value in 2022: $569,800 (it was $186,100 in 2000 )
Beaverton:
$569,800Oregon:
$475,600
Lower value quartile - upper value quartile: $397,400 - $706,300Mean price in 2022: Detached houses: $621,389 Here:
$621,389State:
$562,872
Townhouses or other attached units: $329,007 Here:
$329,007State:
$463,029
In 2-unit structures: $282,874 Here:
$282,874State:
$505,105
In 3-to-4-unit structures: $252,286 Here:
$252,286State:
$419,673
In 5-or-more-unit structures: $291,058 Here:
$291,058State:
$420,389
Mobile homes: $133,372 Here:
$133,372State:
$214,044
Total population: 95,109 (Urban population: 75,918, Rural population: 0)
Houses: 41,004 (38,590 occupied: 19,658 owner occupied, 18,932 renter occupied )
% of renters here:
49%State:
37%
Housing density: 2,512 houses/condos per square mile
Median price asked for vacant for-sale houses and condos in 2022: $437,470.
Median contract rent in 2022: $1,533 (lower quartile is $1,222, upper quartile is $1,832)
Median rent asked for vacant for-rent units in 2022: $3,081
Median gross rent in Beaverton, OR in 2022: $1,665
Housing units in Beaverton with a mortgage: 14,361 (1,030 second mortgage, 0 home equity loan, 903 both second mortgage and home equity loan )Houses without a mortgage: 184
Median household income for houses/condos with a mortgage: $130,058
Median household income for apartments without a mortgage: $86,260
Median monthly housing costs: $1,690
Data:
Median house or condo value ($)
Median house or condo value ($ change since 2000)
Median house or condo value ($) - White
Median house or condo value ($) - Black or African American
Median house or condo value ($) - Asian
Median house or condo value ($) - Hispanic or Latino
Median house or condo value ($) - American Indian and Alaska Native
Median house or condo value ($) - Multirace
Median house or condo value ($) - Other Race
Median price asked for mobile homes ($)
Household density (households per square mile)
Mean house or condo value by units in structure - 1, detached ($)
Mean house or condo value by units in structure - 1, attached ($)
Mean house or condo value by units in structure - 2 ($)
Mean house or condo value by units in structure by units in structure - 3 or 4 ($)
Mean house or condo value by units in structure - 5 or more ($)
Mean house or condo value by units in structure - Boat, RV, van, etc. ($)
Mean house or condo value by units in structure - Mobile home ($)
Median contract rent ($)
Median contract rent - Lower quartile ($)
Median contract rent - Upper quartile ($)
Median gross rent ($)
Urban houses (%)
Rural houses (%)
Houses occupied (%)
Houses occupied (% change since 2000)
Houses owner occupied (%)
Houses owner occupied (% change since 2000)
Houses renter occupied (%)
Houses renter occupied (% change since 2000)
Vacant housing units - For rent (%)
Vacant housing units - For rent (% change since 2000)
Vacant housing units - For sale only (%)
Vacant housing units - For sale only (% change since 2000)
Vacant housing units - Rented or sold, not occupied (%)
Vacant housing units - Rented or sold, not occupied (% change since 2000)
Vacant housing units - For seasonal, recreational, or occasional use (%)
Vacant housing units - For seasonal, recreational, or occasional use (% change since 2000)
Vacant housing units - For migrant workers (%)
Vacant housing units - For migrant workers (% change since 2000)
Vacant housing units - Other vacant (%)
Vacant housing units - Other vacant (% change since 2000)
Median monthly housing costs ($)
Median household income for houses/condos with a mortgage ($)
Median household income for houses/condos without a mortgage ($)
Median household income ($)
Median household income ($) - White
Median household income ($) - Black or African American
Median household income ($) - Asian
Median household income ($) - Hispanic or Latino
Median household income ($) - American Indian and Alaska Native
Median household income ($) - Multirace
Median household income ($) - Other Race
Mortgage status - with mortgage (%)
Mortgage status - with second mortgage (%)
Mortgage status - with home equity loan (%)
Mortgage status - with both second mortgage and home equity loan (%)
Mortgage status - without a mortgage (%)
Median year house/condo built
Median year apartment built
Household type by relationship - Male householder living alone (%)
Household type by relationship - Male householder not living alone (%)
Household type by relationship - Female householder living alone (%)
Household type by relationship - Female householder not living alone (%)
Household type by relationship - Opposite-Sex spouse (%)
Household type by relationship - Same-Sex spouse (%)
Household type by relationship - Opposite-Sex unmarried partner (%)
Household type by relationship - Same-Sex unmarried partner (%)
Household type by relationship - In group quarters (%)
Size of family households - 2-person household (%)
Size of family households - 3-person household (%)
Size of family households - 4-person household (%)
Size of family households - 5-person household (%)
Size of family households - 6-person household (%)
Size of family households - 7-or-more-person household (%)
Size of nonfamily households - 1-person household (%)
Size of nonfamily households - 2-person household (%)
Size of nonfamily households - 3-person household (%)
Size of nonfamily households - 4-person household (%)
Size of nonfamily households - 5-person household (%)
Size of nonfamily households - 6-person household (%)
Size of nonfamily households - 7-or-moreperson household (%)
Year house built - Built 2010 or later (%)
Year house built - Built 2000 to 2009 (%)
Year house built - Built 1990 to 1999 (%)
Year house built - Built 1980 to 1989 (%)
Year house built - Built 1970 to 1979 (%)
Year house built - Built 1960 to 1969 (%)
Year house built - Built 1950 to 1959 (%)
Year house built - Built 1940 to 1949 (%)
Year house built - Built 1939 or earlier (%)
Median number of rooms in houses and condos
Median number of rooms in apartments
Median number of bedrooms in owner occupied houses
Mean number of bedrooms in owner occupied houses
Median number of bedrooms in renter occupied houses
Mean number of bedrooms in renter occupied houses
Median number of vehichles in owner occupied houses
Mean number of vehichles in owner occupied houses
Median number of vehichles in renter occupied houses
Mean number of vehichles in renter occupied houses
Rooms in owner-occupied houses - 1 room (%)
Rooms in owner-occupied houses - 2 rooms (%)
Rooms in owner-occupied houses - 3 rooms (%)
Rooms in owner-occupied houses - 4 rooms (%)
Rooms in owner-occupied houses - 5 rooms (%)
Rooms in owner-occupied houses - 6 rooms (%)
Rooms in owner-occupied houses - 7 rooms (%)
Rooms in owner-occupied houses - 8 rooms (%)
Rooms in owner-occupied houses - 9+ rooms (%)
Rooms in renter-occupied houses - 1 room (%)
Rooms in renter-occupied houses - 2 rooms (%)
Rooms in renter-occupied houses - 3 rooms (%)
Rooms in renter-occupied houses - 4 rooms (%)
Rooms in renter-occupied houses - 5 rooms (%)
Rooms in renter-occupied houses - 6 rooms (%)
Rooms in renter-occupied houses - 7 rooms (%)
Rooms in renter-occupied houses - 8 rooms (%)
Rooms in renter-occupied houses - 9+ rooms (%)
Bedrooms in owner-occupied houses - no bedrooms (%)
Bedrooms in owner-occupied houses - 1 bedroom (%)
Bedrooms in owner-occupied houses - 2 bedrooms (%)
Bedrooms in owner-occupied houses - 3 bedrooms (%)
Bedrooms in owner-occupied houses - 4 bedrooms (%)
Bedrooms in owner-occupied houses - 5+ bedrooms (%)
Bedrooms in renter-occupied houses - no bedrooms (%)
Bedrooms in renter-occupied houses - 1 bedroom (%)
Bedrooms in renter-occupied houses - 2 bedrooms (%)
Bedrooms in renter-occupied houses - 3 bedrooms (%)
Bedrooms in renter-occupied houses - 4 bedrooms (%)
Bedrooms in renter-occupied houses - 5+ bedrooms (%)
Vehicles available in owner-occupied houses - no vehicle available (%)
Vehicles available in owner-occupied houses - 1 vehicle available(%)
Vehicles available in owner-occupied houses - 2 Vehicles available (%)
Vehicles available in owner-occupied houses - 3 Vehicles available (%)
Vehicles available in owner-occupied houses - 4 Vehicles available (%)
Vehicles available in owner-occupied houses - 5+ Vehicles available (%)
Vehicles available in renter-occupied houses - no vehicle available (%)
Vehicles available in renter-occupied houses - 1 vehicle available (%)
Vehicles available in renter-occupied houses - 2 Vehicles available (%)
Vehicles available in renter-occupied houses - 3 Vehicles available (%)
Vehicles available in renter-occupied houses - 4 Vehicles available (%)
Vehicles available in renter-occupied houses - 5+ Vehicles available (%)
Housing units in structures - 1, detached (%)
Housing units in structures - 1, attached (%)
Housing units in structures - 2 (%)
Housing units in structures - 3 or 4 (%)
Housing units in structures - 5 to 9 (%)
Housing units in structures - 10 to 19 (%)
Housing units in structures - 20 to 49 (%)
Housing units in structures - 50 or more (%)
Housing units in structures - Mobile home (%)
Housing units in structures - Boat, RV, van, etc. (%)
Housing units in structures - Owners - 1, detached (%)
Housing units in structures - Owners - 1, attached (%)
Housing units in structures - Owners - 2 (%)
Housing units in structures - Owners - 3 or 4 (%)
Housing units in structures - Owners - 5 to 9 (%)
Housing units in structures - Owners - 10 to 19 (%)
Housing units in structures - Owners - 20 to 49 (%)
Housing units in structures - Owners - 50 or more (%)
Housing units in structures - Owners - Mobile home (%)
Housing units in structures - Owners - Boat, RV, van, etc. (%)
Housing units in structures - Renters - 1, detached (%)
Housing units in structures - Renters - 1, attached (%)
Housing units in structures - Renters - 2 (%)
Housing units in structures - Renters - 3 or 4 (%)
Housing units in structures - Renters - 5 to 9 (%)
Housing units in structures - Renters - 10 to 19 (%)
Housing units in structures - Renters - 20 to 49 (%)
Housing units in structures - Renters - 50 or more (%)
Housing units in structures - Renters - Mobile home (%)
Housing units in structures - Renters - Boat, RV, van, etc. (%)
House/condo owner moved in on average (years ago)
Renter moved in on average (years ago)
Year householder moved into unit - Moved in 1999 to March 2000 (%)
Year householder moved into unit - Moved in 1999 to March 2000 (%) - White
Year householder moved into unit - Moved in 1999 to March 2000 (%) - Black or African American
Year householder moved into unit - Moved in 1999 to March 2000 (%) - Asian
Year householder moved into unit - Moved in 1999 to March 2000 (%) - Hispanic or Latino
Year householder moved into unit - Moved in 1999 to March 2000 (%) - American Indian and Alaska Native
Year householder moved into unit - Moved in 1999 to March 2000 (%) - Multirace
Year householder moved into unit - Moved in 1999 to March 2000 (%) - Other Race
Year householder moved into unit - Moved in 1995 to 1998 (%)
Year householder moved into unit - Moved in 1995 to 1998 (%) - White
Year householder moved into unit - Moved in 1995 to 1998 (%) - Black or African American
Year householder moved into unit - Moved in 1995 to 1998 (%) - Asian
Year householder moved into unit - Moved in 1995 to 1998 (%) - Hispanic or Latino
Year householder moved into unit - Moved in 1995 to 1998 (%) - American Indian and Alaska Native
Year householder moved into unit - Moved in 1995 to 1998 (%) - Multirace
Year householder moved into unit - Moved in 1995 to 1998 (%) - Other Race
Year householder moved into unit - Moved in 1990 to 1994 (%)
Year householder moved into unit - Moved in 1990 to 1994 (%) - White
Year householder moved into unit - Moved in 1990 to 1994 (%) - Black or African American
Year householder moved into unit - Moved in 1990 to 1994 (%) - Asian
Year householder moved into unit - Moved in 1990 to 1994 (%) - Hispanic or Latino
Year householder moved into unit - Moved in 1990 to 1994 (%) - American Indian and Alaska Native
Year householder moved into unit - Moved in 1990 to 1994 (%) - Multirace
Year householder moved into unit - Moved in 1990 to 1994 (%) - Other Race
Year householder moved into unit - Moved in 1980 to 1989 (%)
Year householder moved into unit - Moved in 1980 to 1989 (%) - White
Year householder moved into unit - Moved in 1980 to 1989 (%) - Black or African American
Year householder moved into unit - Moved in 1980 to 1989 (%) - Asian
Year householder moved into unit - Moved in 1980 to 1989 (%) - Hispanic or Latino
Year householder moved into unit - Moved in 1980 to 1989 (%) - American Indian and Alaska Native
Year householder moved into unit - Moved in 1980 to 1989 (%) - Multirace
Year householder moved into unit - Moved in 1980 to 1989 (%) - Other Race
Year householder moved into unit - Moved in 1970 to 1979 (%)
Year householder moved into unit - Moved in 1970 to 1979 (%) - White
Year householder moved into unit - Moved in 1970 to 1979 (%) - Black or African American
Year householder moved into unit - Moved in 1970 to 1979 (%) - Asian
Year householder moved into unit - Moved in 1970 to 1979 (%) - Hispanic or Latino
Year householder moved into unit - Moved in 1970 to 1979 (%) - American Indian and Alaska Native
Year householder moved into unit - Moved in 1970 to 1979 (%) - Multirace
Year householder moved into unit - Moved in 1970 to 1979 (%) - Other Race
Year householder moved into unit - Moved in 1969 or earlier (%)
Year householder moved into unit - Moved in 1969 or earlier (%) - White
Year householder moved into unit - Moved in 1969 or earlier (%) - Black or African American
Year householder moved into unit - Moved in 1969 or earlier (%) - Asian
Year householder moved into unit - Moved in 1969 or earlier (%) - Hispanic or Latino
Year householder moved into unit - Moved in 1969 or earlier (%) - American Indian and Alaska Native
Year householder moved into unit - Moved in 1969 or earlier (%) - Multirace
Year householder moved into unit - Moved in 1969 or earlier (%) - Other Race
Housing units lacking complete plumbing facilities (%)
Housing units lacking complete kitchen facilities (%)
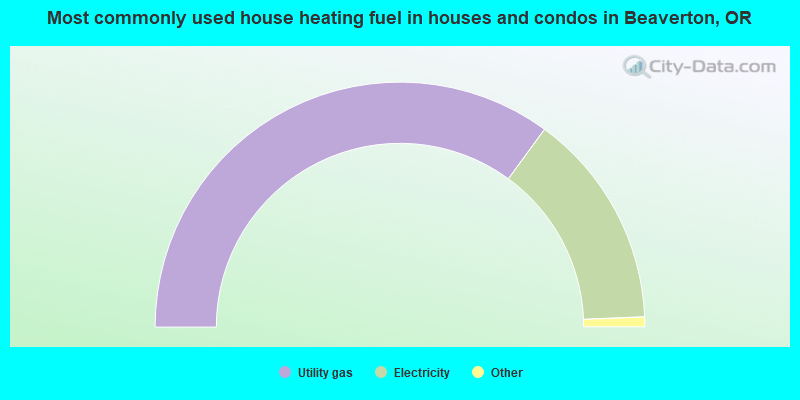
House heating fuel used in houses and condos - Utility gas (%)
House heating fuel used in houses and condos - Bottled, tank, or LP gas (%)
House heating fuel used in houses and condos - Electricity (%)
House heating fuel used in houses and condos - Fuel oil, kerosene, etc. (%)
House heating fuel used in houses and condos - Coal or coke (%)
House heating fuel used in houses and condos - Wood (%)
House heating fuel used in houses and condos - Solar energy (%)
House heating fuel used in houses and condos - Other fuel (%)
House heating fuel used in houses and condos - No fuel used (%)
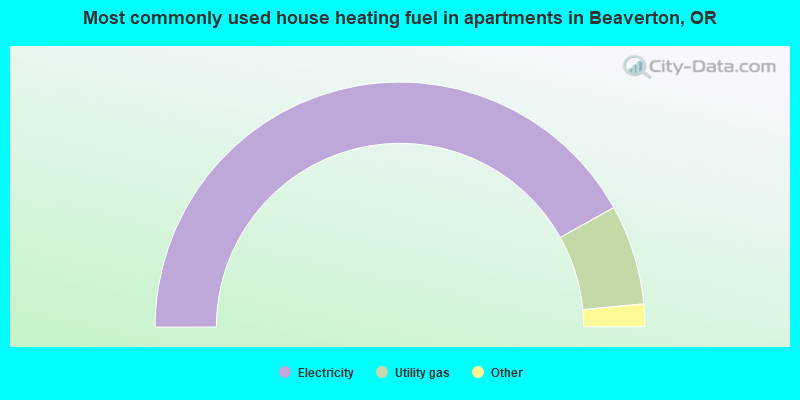
House heating fuel used in apartments - Utility gas (%)
House heating fuel used in apartments - Bottled, tank, or LP gas (%)
House heating fuel used in apartments - Electricity (%)
House heating fuel used in apartments - Fuel oil, kerosene, etc. (%)
House heating fuel used in apartments - Coal or coke (%)
House heating fuel used in apartments - Wood (%)
House heating fuel used in apartments - Solar energy (%)
House heating fuel used in apartments - Other fuel (%)
House heating fuel used in apartments - No fuel used (%)
Latest news about housing in Beaverton, OR collected exclusively by city-data.com from local newspapers, TV, and radio stations
Median year house/condo built: 1984Median year apartment built: 1987Household type by relationship:
Households: 97,064
Male householders: 17,382 (4,763 living alone ), Female householders: 21,208 (7,754 living alone )16,689 spouses (16,464 opposite-sex spouses ), 3,746 unmarried partners , (3,668 opposite-sex unmarried partners ), 29,310 children (27,476 natural , 963 adopted , 871 stepchildren ), 429 grandchildren , 862 brothers or sisters , 1,341 parents , 0 foster children , 678 other relatives , 4,187 non-relatives In group quarters: 1,232
Size of family households: 8,694 2-persons , 4,426 3-persons , 4,867 4-persons , 2,133 5-persons , 949 6-persons , 549 7-or-more-persons .
Size of nonfamily households: 12,517 1-person , 3,465 2-persons , 814 3-persons , 176 4-persons .
17,295 married couples with children. single-parent households (957 men , 5,033 women ).
72.9% of residents of Beaverton speak English at home. of residents speak Spanish at home (68% speak English very well , 12% speak English well , 13% speak English not well , 7% don't speak English at all ).of residents speak other Indo-European language at home (75% speak English very well , 14% speak English well , 12% speak English not well ).of residents speak Asian or Pacific Island language at home (65% speak English very well , 22% speak English well , 11% speak English not well , 1% don't speak English at all ).of residents speak other language at home (68% speak English very well , 25% speak English well , 7% speak English not well ).
Foreign born population: 16,453 (17.0%)of them are naturalized citizens )
Median number of rooms in houses and condos:
Median number of rooms in apartments
Owner-occupied Renter-occupied
Bedrooms in owner-occupied houses and condos in Beaverton, Oregon
135 no bedroom 257 1 bedroom 3,435 2 bedrooms 8,305 3 bedrooms 6,462 4 bedrooms 1,064 5+ bedrooms
Bedrooms in renter-occupied apartments in Beaverton, Oregon
1,191 no bedroom 5,472 1 bedroom 8,693 2 bedrooms 3,085 3 bedrooms 200 4 bedrooms 291 5+ bedrooms
Owner-occupied Renter-occupied
Rooms in owner-occupied houses in Beaverton, Oregon
135 1 room 90 2 rooms 750 3 rooms 2,364 4 rooms 3,242 5 rooms 3,382 6 rooms 3,316 7 rooms 2,435 8 rooms 3,944 9+ rooms
Rooms in renter-occupied apartments in Beaverton, Oregon
1,191 1 room 2,784 2 rooms 4,021 3 rooms 5,309 4 rooms 2,875 5 rooms 1,882 6 rooms 231 7 rooms 348 8 rooms 291 9+ rooms
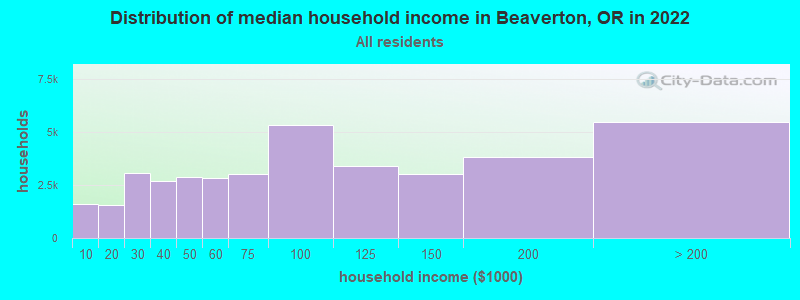
Beaverton, OR household income distribution 1,597 Less than $10,0001,568 $10,000 to $19,9993,053 $20,000 to $29,9992,677 $30,000 to $39,9992,852 $40,000 to $49,9992,807 $50,000 to $59,9992,998 $60,000 to $74,9995,336 $75,000 to $99,9993,377 $100,000 to $124,9993,033 $125,000 to $149,9993,831 $150,000 to $199,9995,461 $200,000 or more
Home value of owner - occupied houses in 2022 in Beaverton, OR 150 Less than $10,00033 $10,000 to $14,99937 $15,000 to $19,99923 $20,000 to $24,99944 $25,000 to $29,9997 $30,000 to $34,9992 $35,000 to $39,99944 $40,000 to $49,99951 $50,000 to $59,99945 $60,000 to $69,99914 $70,000 to $79,99912 $90,000 to $99,999222 $100,000 to $124,99951 $125,000 to $149,999143 $150,000 to $174,999170 $175,000 to $199,999385 $200,000 to $249,999654 $250,000 to $299,9992,363 $300,000 to $399,9992,951 $400,000 to $499,9999,995 $500,000 to $749,9992,794 $750,000 to $999,999201 $1,000,000 to $1,499,99936 $1,500,000 to $1,999,99983 $2,000,000 or moreRent paid by renters in 2022 in Beaverton, OR 51 $100 to $149292 $150 to $19947 $200 to $24923 $250 to $29945 $300 to $34979 $350 to $3998 $400 to $44933 $450 to $49994 $500 to $54925 $550 to $59992 $600 to $64933 $650 to $69957 $700 to $74934 $750 to $799358 $800 to $899618 $900 to $9993,680 $1,000 to $1,2494,256 $1,250 to $1,4998,502 $1,500 to $1,9991,719 $2,000 to $2,499352 $2,500 to $2,99947 $3,000 to $3,499356 $3,500 or more323 No cash rent
Percentage of workers working in this county: 76.7%Number of people working at home: 13,525 (24.2% of all workers )
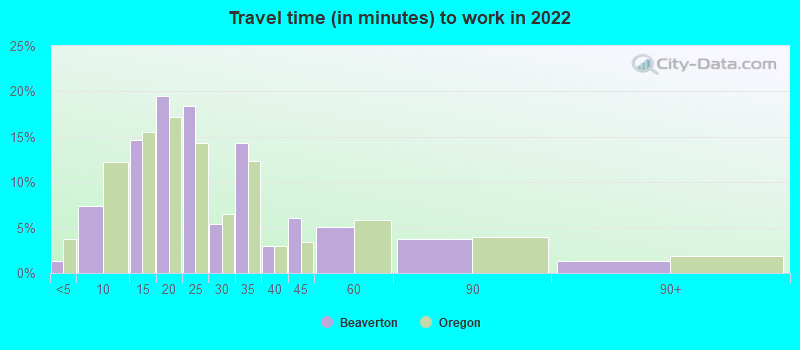
Travel time to work (commute)
Less than 5 minutes: 3675 to 9 minutes: 2,88710 to 14 minutes: 5,65815 to 19 minutes: 7,58420 to 24 minutes: 7,00925 to 29 minutes: 3,19830 to 34 minutes: 5,30235 to 39 minutes: 1,25440 to 44 minutes: 1,56145 to 59 minutes: 1,53460 to 89 minutes: 91590 or more minutes: 255
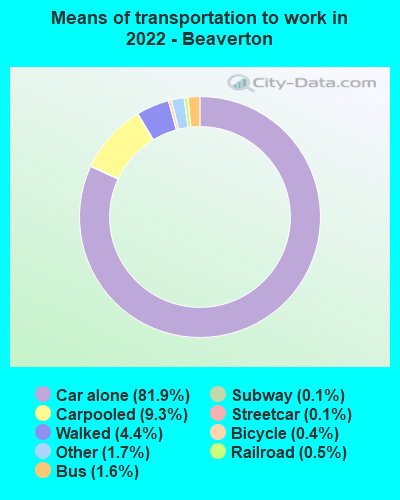
Means of transportation to work:
Drove a car alone: 43,907 (68.2%)Carpooled: 4,990 (7.8%)Bus : 872 (1.4%)Subway or elevated rail : 74 (0.1%)Long-distance train or commuter rail : 67 (0.1%)Light rail, streetcar or trolley : 261 (0.4%)Taxi: 886 (1.4%)Bicycle: 191 (0.3%)Walked: 2,367 (3.7%)Worked at home: 10,759 (16.7%)
Unemployment by race in 2022
Unemployment rate for White non-Hispanic residents 1.8% Males2.8% FemalesUnemployment rate for Black residents 10.1% MalesUnemployment rate for Asian residents 7.6% FemalesUnemployment rate for other race residents 10.7% Males1.4% FemalesUnemployment rate for two or more race residents 2.7% Males2.3% FemalesUnemployment rate for Hispanic or Latino residents 4.9% Males2.9% Females
Year of entry for the foreign-born population in Beaverton, Oregon
7,137 2010 or later 3,681 2000 to 2009 4,182 1990 to 1999 3,567 1980 to 1989 1,615 1970 to 1979 1,173 Before 1970
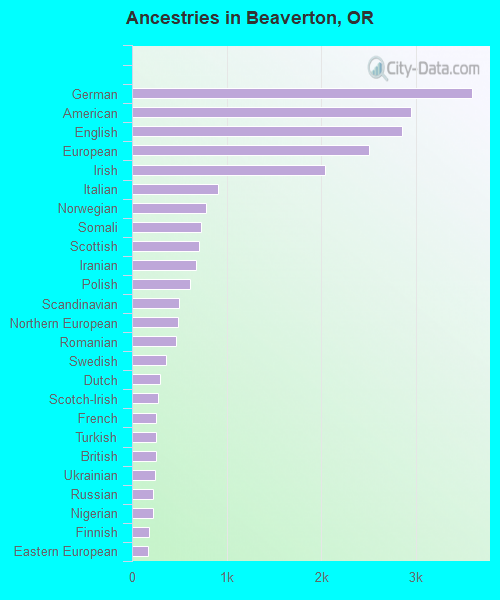
First ancestries reported:
German: 3,597 (7.3%)
American: 2,951 (6.0%)
English: 2,857 (5.8%)
European: 2,506 (5.1%)
Irish: 2,045 (4.1%)
Italian: 906 (1.8%)
Norwegian: 786 (1.6%)
Somali: 732 (1.5%)
Scottish: 704 (1.4%)
Iranian: 676 (1.4%)
Polish: 614 (1.2%)
Scandinavian: 497 (1.0%)
Northern European: 491 (1.0%)
Romanian: 461 (0.9%)
Swedish: 362 (0.7%)
Dutch: 298 (0.6%)
Scotch-Irish: 280 (0.6%)
French: 257 (0.5%)
Turkish: 255 (0.5%)
British: 252 (0.5%)
Ukrainian: 239 (0.5%)
Russian: 225 (0.5%)
Nigerian: 222 (0.4%)
Finnish: 177 (0.4%)
Eastern European: 174 (0.4%)
Canadian: 154 (0.3%)
Afghan: 153 (0.3%)
Hungarian: 149 (0.3%)
Sudanese: 142 (0.3%)
Serbian: 140 (0.3%)
Lebanese: 139 (0.3%)
Swiss: 121 (0.2%)
French Canadian: 117 (0.2%)
Danish: 106 (0.2%)
African: 100 (0.2%)
Welsh: 89 (0.2%)
Czech: 85 (0.2%)
Austrian: 70 (0.1%)
Iraqi: 70 (0.1%)
Palestinian: 61 (0.1%)
Jordanian: 55 (0.1%)
Belgian: 50 (0.1%)
Israeli: 48 (0.10%)
Haitian: 43 (0.09%)
Greek: 39 (0.08%)
West Indian: 39 (0.08%)
Armenian: 38 (0.08%)
Croatian: 36 (0.07%)
Portuguese: 35 (0.07%)
Ghanaian: 33 (0.07%)
Egyptian: 32 (0.06%)
Brazilian: 27 (0.05%)
Lithuanian: 26 (0.05%)
Jamaican: 19 (0.04%)
Syrian: 18 (0.04%)
Basque: 17 (0.03%)
Luxembourger: 17 (0.03%)
Cape Verdean: 16 (0.03%)
South African: 13 (0.03%)
Macedonian: 11 (0.02%)
Kenyan: 10 (0.02%)
Cajun: 9 (0.02%)
Ethiopian: 9 (0.02%)
Slovak: 9 (0.02%)
Yugoslavian: 3 (0.01%)
Most common places of birth for foreign-born residents (%): Mexico Beaverton:
20.9% (3,847)Oregon:
33.9% (140,109)
India Beaverton:
14.9% (2,737)Oregon:
4.7% (19,604)
Vietnam Beaverton:
5.8% (1,074)Oregon:
5.5% (22,563)
Guatemala Beaverton:
4.4% (814)Oregon:
1.7% (7,103)
Philippines Beaverton:
4.2% (771)Oregon:
3.5% (14,530)
Korea Beaverton:
4.0% (741)Oregon:
2.8% (11,450)
Canada Beaverton:
3.2% (581)Oregon:
3.7% (15,229)
China, excluding Hong Kong and Taiwan Beaverton:
3.0% (545)Oregon:
5.2% (21,429)
Iran Beaverton:
2.8% (522)Oregon:
1.0% (4,122)
Japan Beaverton:
2.0% (368)Oregon:
1.5% (6,259)
Ecuador Beaverton:
1.9% (352)Oregon:
0.2% (794)
Taiwan Beaverton:
1.5% (280)Oregon:
0.8% (3,319)
Place of birth for U.S.-born residents:
This state: 38,637Other state: 40,559Northeast: 3,607Midwest: 6,630South: 5,626West: 24,696 86.7% of Beaverton residents lived in the same house 1 years ago.
Out of people who lived in different houses, 30.6% lived in this county.
Out of people who lived in different counties, 47.7% lived in Oregon.
Beaverton:
86.7%State average:
85.5%
Education attainment for males 25 years and older:
No schooling: 29Nursery to 4th grade: 1205th and 6th grade: 3597th and 8th grade: 2239th grade: 14310th grade: 72911th grade: 5312th grade, no diploma: 415High school graduate (or equivalency): 5,028Less than 1 year of college: 956Some college more than 1 year, no degree: 5,972Associate degree: 2,272Bachelor's degree: 10,834Master's degree: 3,332Professional school degree: 826Doctorate degree: 652
Education attainment for females 25 years and older:
No schooling: 172Nursery to 4th grade: 1855th and 6th grade: 727th and 8th grade: 3939th grade: 18310th grade: 23611th grade: 29712th grade, no diploma: 299High school graduate (or equivalency): 5,150Less than 1 year of college: 2,546Some college more than 1 year, no degree: 4,153Associate degree: 3,865Bachelor's degree: 10,710Master's degree: 4,671Professional school degree: 804Doctorate degree: 501
Housing units in structures:
One, detached: 16,790One, attached: 3,973Two: 4183 or 4: 1,7825 to 9: 4,85010 to 19: 5,89320 to 49: 2,95350 or more: 4,027Mobile homes: 318Median worth of mobile homes: $30,757
Housing units lacking complete plumbing facilities in 2022: 0.1%Housing units lacking complete kitchen facilities in 2022: 1.7%House/condo owner moved in on average 11 years ago
Renter moved in on average 2 years ago
Private vs. public school enrollment:
Students in private schools in grades 1 to 8 (elementary and middle school): 2,417 Students in private schools in grades 9 to 12 (high school): 564 Students in private undergraduate colleges: 158