Atlantic Highlands, NJ (New Jersey) Houses and Residents
| Atlantic Highlands: | $654,551 |
| New Jersey: | $428,900 |
Total population: 4,336 (All urban)
Houses: 1,971 (1,917 occupied: 1,359 owner occupied, 591 renter occupied)
| % of renters here: | 30% |
| State: | 35% |
Housing density: 1,594 houses/condos per square mile
Median price asked for vacant for-sale houses and condos in 2022 in this county: $430,351.
Median contract rent in 2022: $1,614 (lower quartile is $1,229, upper quartile is over $2,000)
Median rent asked for vacant for-rent units in 2022: $2,020
Median gross rent in Atlantic Highlands, NJ in 2022: $1,805
Housing units in Atlantic Highlands with a mortgage: 912 (212 second mortgage, 9 home equity loan, 179 both second mortgage and home equity loan)
Houses without a mortgage: 28
Median household income for houses/condos with a mortgage: $197,245
Median household income for apartments without a mortgage: $84,669
Median monthly housing costs: $2,118
Compare current foreclosures near Atlantic Highlands, NJ:
| Photo | Address | Area | Beds / Baths | Price | Details |
|---|---|---|---|---|---|

|
#1
Memorial Pkwy
Atlantic Highlands, NJ 07716
|
1,820 sq. feet
|
- baths - beds |
show details | |

|
#2
Browns Dock Rd
Atlantic Highlands, NJ 07716
|
1,504 sq. feet
|
- baths - beds |
show details | |

|
#3
Ocean Blvd
Atlantic Highlands, NJ 07716
|
1,020 sq. feet
|
- baths - beds |
show details | |

|
#4
3rd Ave
Atlantic Highlands, NJ 07716
|
568 sq. feet
|
- baths - beds |
show details | |

|
#5
Monmouth Ave
Atlantic Highlands, NJ 07716
|
- sq. feet
|
- baths - beds |
show details | |

|
#6
1st Ave # 204
Atlantic Highlands, NJ 07716
|
- sq. feet
|
- baths - beds |
show details | |

|
#7
King James Ln
Atlantic Highlands, NJ 07716
|
1,036 sq. feet
|
- baths - beds |
show details | |

|
#8
E Mount Ave
Atlantic Highlands, NJ 07716
|
2,799 sq. feet
|
- baths - beds |
show details | |

|
#9
Memorial Pkwy
Atlantic Highlands, NJ 07716
|
1,991 sq. feet
|
- baths - beds |
show details | |

|
#10
Bayside Dr
Atlantic Highlands, NJ 07716
|
5,288 sq. feet
|
- baths - beds |
show details |
| Photo | Address | Area | Beds / Baths | Price | Details |
|---|---|---|---|---|---|

|
#11
W Highland Ave
Atlantic Highlands, NJ 07716
|
- sq. feet
|
- baths - beds |
show details | |

|
#12
Chapel Hill Rd
Atlantic Highlands, NJ 07716
|
2,371 sq. feet
|
- baths - beds |
show details | |

|
#13
Kennedy Ct
Atlantic Highlands, NJ 07716
|
1,284 sq. feet
|
- baths - beds |
show details | |

|
#14
E Highland Ave
Atlantic Highlands, NJ 07716
|
- sq. feet
|
- baths - beds |
show details | |

|
#15
Maplewood Ave
Atlantic Highlands, NJ 07716
|
1,365 sq. feet
|
- baths - beds |
show details | |

|
#16
Ridgeview Ave
Atlantic Highlands, NJ 07716
|
3,784 sq. feet
|
- baths - beds |
show details | |

|
#17
Delaware Ave
Atlantic Highlands, NJ 07716
|
1,326 sq. feet
|
- baths - beds |
show details | |

|
#18
Catherine St
South Amboy, NJ 08879
|
2,266 sq. feet
|
3 baths 4 beds |
$339,900
|
show details |

|
#19
Warren Street
Keyport, NJ 07735
|
2,889 sq. feet
|
2 baths 7 beds |
$459,900
|
show details |

|
#20
Bay 19th St
Brooklyn, NY 11214
|
880 sq. feet
|
1 baths 2 beds |
$425,000
|
show details |
| Photo | Address | Area | Beds / Baths | Price | Details |
|---|---|---|---|---|---|

|
#21
E 32nd St Apt C7
Brooklyn, NY 11210
|
670 sq. feet
|
1 baths 1 beds |
$299,900
|
show details |

|
#22
Thompson St
South Amboy, NJ 08879
|
2,708 sq. feet
|
3 baths 5 beds |
$730,000
|
show details |

|
#23
Sharon Garden Ct
Woodbridge, NJ 07095
|
1,000 sq. feet
|
2 baths 2 beds |
$435,000
|
show details |

|
#24
Ocean Pkwy Apt 11k
Brooklyn, NY 11235
|
400 sq. feet
|
1 baths - beds |
$199,900
|
show details |

|
#25
Narrows Rd N
Staten Island, NY 10305
|
- sq. feet
|
1 baths 3 beds |
$359,900
|
show details |

|
#26
Crawford Street
Red Bank, NJ 07701
|
1,280 sq. feet
|
1 baths 2 beds |
show details | |

|
#27
Day Ave
Middletown, NJ 07748
|
1,080 sq. feet
|
- baths - beds |
$219,900
|
show details |

|
#28
93rd St
Brooklyn, NY 11209
|
1,627 sq. feet
|
3 baths 6 beds |
show details | |

|
#29
1st Ave
Asbury Park, NJ 07712
|
1,318 sq. feet
|
1 baths 2 beds |
show details | |

|
#30
Brighton Ave
Belmar, NJ 07719
|
3,232 sq. feet
|
3 baths 4 beds |
show details |
| Photo | Address | Area | Beds / Baths | Price | Details |
|---|---|---|---|---|---|

|
#31
Paerdegat 2nd St
Brooklyn, NY 11236
|
3,013 sq. feet
|
5 baths 8 beds |
show details | |

|
#32
E 57th St
Brooklyn, NY 11234
|
1,056 sq. feet
|
1 baths 2 beds |
show details | |

|
#33
Madison Ave
Red Bank, NJ 07701
|
1,588 sq. feet
|
2 baths 3 beds |
show details | |

|
#34
Nostrand Ave
Brooklyn, NY 11226
|
3,300 sq. feet
|
3 baths 6 beds |
show details | |

|
#35
Elm Ct
Middletown, NJ 07748
|
1,690 sq. feet
|
2 baths 3 beds |
show details | |

|
#36
Newark Ave
Staten Island, NY 10302
|
1,120 sq. feet
|
1 baths 3 beds |
show details | |

|
#37
Drs James Parker Blvd
Red Bank, NJ 07701
|
1,032 sq. feet
|
1 baths 2 beds |
show details | |

|
#38
Shore Blvd
Keansburg, NJ 07734
|
1,164 sq. feet
|
1 baths 3 beds |
show details | |

|
#39
E 80th St Apt 178
Brooklyn, NY 11236
|
931 sq. feet
|
1 baths 2 beds |
show details | |

|
#40
White St
Middletown, NJ 07748
|
1,380 sq. feet
|
2 baths 2 beds |
show details |
| Photo | Address | Area | Beds / Baths | Price | Details |
|---|---|---|---|---|---|

|
#41
Marine Ave
Brooklyn, NY 11209
|
1,116 sq. feet
|
1 baths 3 beds |
show details | |

|
#42
Troy Ave
Brooklyn, NY 11234
|
1,408 sq. feet
|
1 baths 3 beds |
show details | |

|
#43
Fairway Ave
West Long Branch, NJ 07764
|
2,075 sq. feet
|
1 baths 3 beds |
show details | |

|
#44
Hammock Ln
Staten Island, NY 10312
|
2,000 sq. feet
|
1 baths 3 beds |
show details | |

|
#45
Olden Ave
Neptune, NJ 07753
|
1,040 sq. feet
|
2 baths 3 beds |
show details | |

|
#46
Sycamore Ave
Middletown, NJ 07748
|
1,296 sq. feet
|
2 baths 3 beds |
show details | |

|
#47
Sewall Ave
Asbury Park, NJ 07712
|
1,070 sq. feet
|
1 baths 3 beds |
show details | |

|
#48
Alba Ln
West Long Branch, NJ 07764
|
5,483 sq. feet
|
6 baths 5 beds |
show details | |

|
#49
Maplecrest Dr
Neptune, NJ 07753
|
1,118 sq. feet
|
2 baths 3 beds |
show details | |

|
Check over 1 million property listings on Foreclosure.com!
|
browse all offers | |||


 | Advice on Moving to Ocean/Monmouth County from Bergen County (20 replies) |
| Visiting Red Bank - Surrounding areas suggestions? (11 replies) |
| Wanted Long Term House Rental Atlantic Highlands Area (20 replies) |
| Ocean/Monmouth Counties: Best Places to Live (85 replies) |
| seeking condo or small house in Highlands (11 replies) |
| Middletown/Lincroft/Holmdel - thinking of moving to, thoughts? (53 replies) |

Median year apartment built: 1963
Household type by relationship:
Households: 4,416- Male householders: 929 (384 living alone), Female householders: 980 (274 living alone)
878 spouses (878 opposite-sex spouses), 174 unmarried partners, (128 opposite-sex unmarried partners), 1,234 children (1,234 natural, 0 adopted, 0 stepchildren), 17 grandchildren, 11 brothers or sisters, 30 parents, 0 foster children, 12 other relatives, 143 non-relatives
- In group quarters: 5
Size of family households: 500 2-persons, 272 3-persons, 303 4-persons, 99 5-persons.
Size of nonfamily households: 657 1-person, 115 2-persons, 11 7-or-more-persons.
667 married couples with children.
176 single-parent households (102 men, 74 women).
91.2% of residents of Atlantic Highlands speak English at home.
2.6% of residents speak Spanish at home (89% speak English very well, 7% speak English well, 4% speak English not well).
3.8% of residents speak other Indo-European language at home (88% speak English very well, 12% speak English well).
1.0% of residents speak Asian or Pacific Island language at home (56% speak English very well, 44% speak English well).
0.7% of residents speak other language at home (81% speak English very well, 19% speak English well).
Foreign born population: 265 (6.0%)
(50.2% of them are naturalized citizens)
| Here: | 7.8 |
| State: | 6.8 |
| Here: | 3.8 |
| State: | 3.9 |

- Bedrooms in owner-occupied houses and condos in Atlantic Highlands, New Jersey
- 0no bedroom
- 891 bedroom
- 2312 bedrooms
- 4913 bedrooms
- 2914 bedrooms
- 2575+ bedrooms

- Bedrooms in renter-occupied apartments in Atlantic Highlands, New Jersey
- 0no bedroom
- 2521 bedroom
- 2512 bedrooms
- 543 bedrooms
- 354 bedrooms
- 05+ bedrooms

- Cars and other vehicles available in Atlantic Highlands in owner-occupied houses/condos
- 21no vehicle
- 3871 vehicle
- 6812 vehicles
- 2103 vehicles
- 604 vehicles
- 05+ vehicles

- Cars and other vehicles available in Atlantic Highlands in renter-occupied apartments
- 68no vehicle
- 3351 vehicle
- 1752 vehicles
- 133 vehicles
- 04 vehicles
- 05+ vehicles

- Rooms in owner-occupied houses in Atlantic Highlands, New Jersey
- 01 room
- 02 rooms
- 213 rooms
- 684 rooms
- 1905 rooms
- 1666 rooms
- 1377 rooms
- 2858 rooms
- 4929+ rooms

- Rooms in renter-occupied apartments in Atlantic Highlands, New Jersey
- 01 room
- 252 rooms
- 2283 rooms
- 1544 rooms
- 1015 rooms
- 506 rooms
- 337 rooms
- 08 rooms
- 09+ rooms


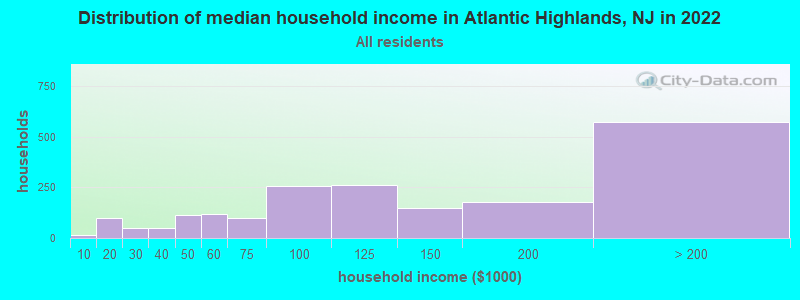
Atlantic Highlands, NJ household income distribution

- 14Less than $10,000
- 98$10,000 to $19,999
- 50$20,000 to $29,999
- 47$30,000 to $39,999
- 114$40,000 to $49,999
- 118$50,000 to $59,999
- 100$60,000 to $74,999
- 256$75,000 to $99,999
- 262$100,000 to $124,999
- 148$125,000 to $149,999
- 180$150,000 to $199,999
- 573$200,000 or more
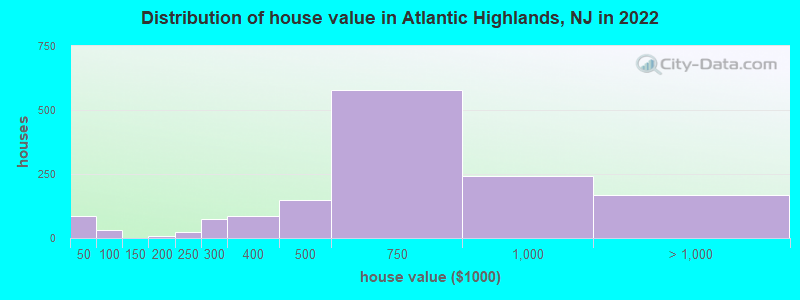
Home value of owner - occupied houses in 2022 in Atlantic Highlands, NJ
-
- 43Less than $10,000
- 7$15,000 to $19,999
- 11$35,000 to $39,999
- 22$40,000 to $49,999
- 10$50,000 to $59,999
- 9$175,000 to $199,999
- 21$200,000 to $249,999
- 75$250,000 to $299,999
- 85$300,000 to $399,999
- 149$400,000 to $499,999
- 579$500,000 to $749,999
- 244$750,000 to $999,999
- 100$1,000,000 to $1,499,999
- 31$1,500,000 to $1,999,999
- 37$2,000,000 or more
Rent paid by renters in 2022 in Atlantic Highlands, NJ
-
- 16$200 to $249
- 41$300 to $349
- 31$350 to $399
- 3$450 to $499
- 10$600 to $649
- 7$650 to $699
- 13$800 to $899
- 19$1,000 to $1,249
- 115$1,250 to $1,499
- 94$1,500 to $1,999
- 158$2,000 to $2,499
- 24$2,500 to $2,999
- 16$3,000 to $3,499
- 13$3,500 or more
- 14No cash rent


Percentage of workers working in this county: 74.8%
Number of people working at home: 758 (32.9% of all workers)
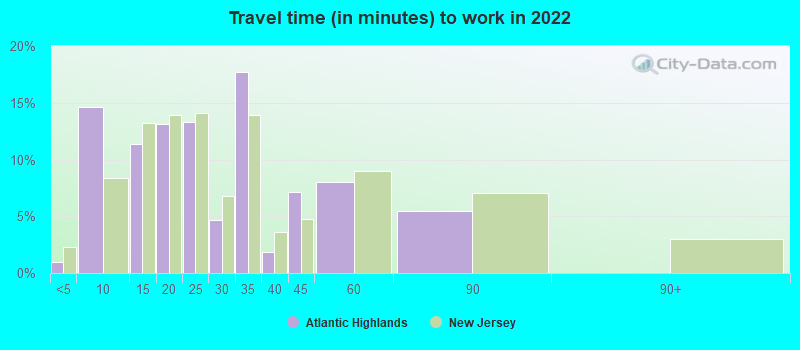
Travel time to work (commute)
- Less than 5 minutes: 35
- 5 to 9 minutes: 80
- 10 to 14 minutes: 92
- 15 to 19 minutes: 257
- 20 to 24 minutes: 183
- 25 to 29 minutes: 121
- 30 to 34 minutes: 120
- 35 to 39 minutes: 74
- 40 to 44 minutes: 44
- 45 to 59 minutes: 292
- 60 to 89 minutes: 202
- 90 or more minutes: 93
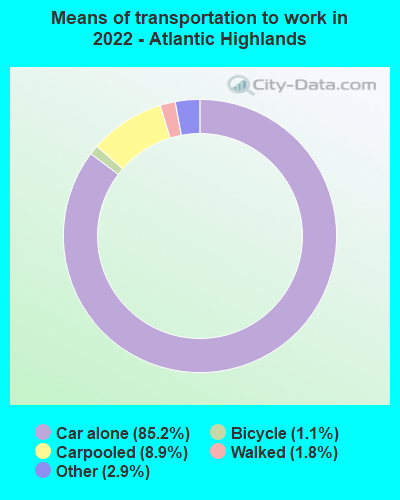
Means of transportation to work:
- Drove a car alone: 1,081 (54.7%)
- Carpooled: 135 (6.8%)
- Taxi: 56 (2.8%)
- Bicycle: 10 (0.5%)
- Walked: 34 (1.7%)
- Worked at home: 758 (38.3%)

- Unemployment by race in 2022
- Unemployment rate for White non-Hispanic residents
- 5.4%Males
- 0.7%Females
- Unemployment rate for American Indian and Alaska Native residents
- 100.0%Males
- Unemployment rate for two or more race residents
- 19.8%Males
- Unemployment rate for Hispanic or Latino residents
- 0.8%Males
- 6.6%Females

- Year of entry for the foreign-born population in Atlantic Highlands, New Jersey
- 1362010 or later
- 102000 to 2009
- 651990 to 1999
- 741980 to 1989
- 291970 to 1979
- 137Before 1970

First ancestries reported:
- Italian: 358 (22.6%)
- Irish: 353 (22.3%)
- German: 83 (5.2%)
- Swedish: 78 (4.9%)
- Polish: 69 (4.4%)
- Eastern European: 50 (3.2%)
- American: 40 (2.5%)
- Greek: 40 (2.5%)
- Ukrainian: 40 (2.5%)
- English: 39 (2.5%)
- Scotch-Irish: 30 (1.9%)
- Egyptian: 28 (1.8%)
- Scandinavian: 23 (1.5%)
- Scottish: 23 (1.5%)
- British: 19 (1.2%)
- Swiss: 10 (0.6%)
- Armenian: 8 (0.5%)
- Hungarian: 8 (0.5%)
- European: 5 (0.3%)
Most common places of birth for foreign-born residents (%):
| Atlantic Highlands: | 28.4% (75) |
| New Jersey: | 0.0% (1,054) |
| Atlantic Highlands: | 13.3% (35) |
| New Jersey: | 4.2% (90,817) |
| Atlantic Highlands: | 11.4% (30) |
| New Jersey: | 4.0% (85,934) |
| Atlantic Highlands: | 8.7% (23) |
| New Jersey: | 0.8% (17,217) |
| Atlantic Highlands: | 6.4% (17) |
| New Jersey: | 0.1% (1,480) |
| Atlantic Highlands: | 4.5% (12) |
| New Jersey: | 1.6% (33,678) |
| Atlantic Highlands: | 4.2% (11) |
| New Jersey: | 0.2% (4,399) |
| Atlantic Highlands: | 3.8% (10) |
| New Jersey: | 0.6% (12,793) |
| Atlantic Highlands: | 3.4% (9) |
| New Jersey: | 0.1% (2,405) |
| Atlantic Highlands: | 3.0% (8) |
| New Jersey: | 1.1% (22,760) |
| Atlantic Highlands: | 3.0% (8) |
| New Jersey: | 3.7% (78,969) |
| Atlantic Highlands: | 3.0% (8) |
| New Jersey: | 0.0% (946) |
| Atlantic Highlands: | 2.7% (7) |
| New Jersey: | 0.2% (4,659) |
| Atlantic Highlands: | 2.7% (7) |
| New Jersey: | 0.1% (1,396) |
| Atlantic Highlands: | 1.5% (4) |
| New Jersey: | 0.2% (3,249) |
Place of birth for U.S.-born residents:
- This state: 2,975
- Other state: 1,087
- Northeast: 853
- Midwest: 58
- South: 76
- West: 105
88.5% of Atlantic Highlands residents lived in the same house 1 years ago.
Out of people who lived in different houses, 32.8% lived in this county.
Out of people who lived in different counties, 70.3% lived in New Jersey.
| Atlantic Highlands: | 88.5% |
| State average: | 90.4% |
Education attainment for males 25 years and older:
- No schooling: 0
- Nursery to 4th grade: 0
- 5th and 6th grade: 0
- 7th and 8th grade: 12
- 9th grade: 0
- 10th grade: 0
- 11th grade: 1
- 12th grade, no diploma: 0
- High school graduate (or equivalency): 455
- Less than 1 year of college: 117
- Some college more than 1 year, no degree: 143
- Associate degree: 53
- Bachelor's degree: 705
- Master's degree: 256
- Professional school degree: 25
- Doctorate degree: 98

Education attainment for females 25 years and older:
- No schooling: 0
- Nursery to 4th grade: 4
- 5th and 6th grade: 0
- 7th and 8th grade: 0
- 9th grade: 0
- 10th grade: 0
- 11th grade: 1
- 12th grade, no diploma: 9
- High school graduate (or equivalency): 256
- Less than 1 year of college: 68
- Some college more than 1 year, no degree: 168
- Associate degree: 224
- Bachelor's degree: 546
- Master's degree: 186
- Professional school degree: 21
- Doctorate degree: 34


Housing units in structures:
- One, detached: 1,321
- One, attached: 57
- Two: 67
- 3 or 4: 87
- 5 to 9: 65
- 10 to 19: 42
- 20 to 49: 127
- 50 or more: 203
House/condo owner moved in on average 11 years ago
Renter moved in on average 5 years ago

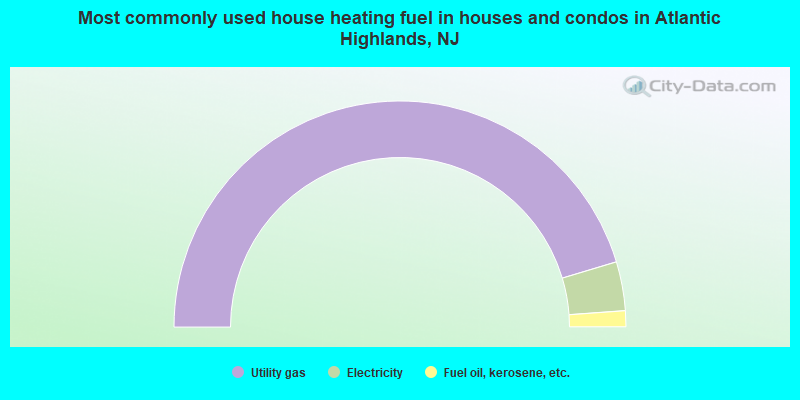
- 90.7%Utility gas
- 7.0%Electricity
- 2.3%Fuel oil, kerosene, etc.
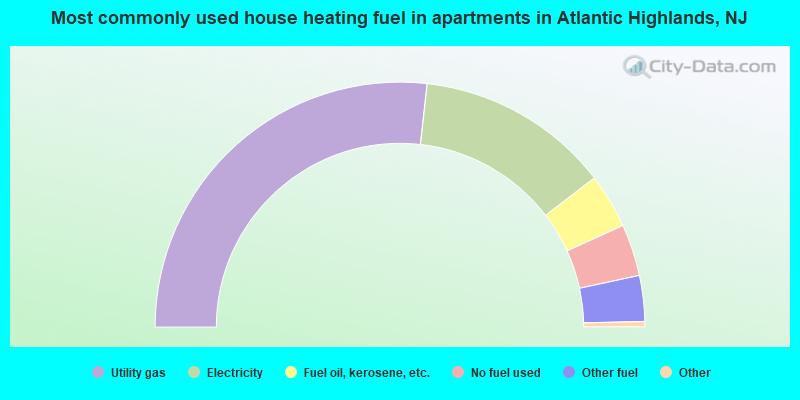
- 54.0%Utility gas
- 25.8%Electricity
- 7.3%Fuel oil, kerosene, etc.
- 6.9%No fuel used
- 6.1%Other fuel
Private vs. public school enrollment:
| Here: | 4.8% |
| New Jersey: | 12.3% |
| Here: | 13.6% |
| New Jersey: | 13.1% |
| Here: | 19.8% |
| New Jersey: | 33.2% |


