Allenville, IL (Illinois) Houses and Residents
| Allenville: | $106,912 |
| Illinois: | $251,600 |
Mean price in 2022:
Detached houses: $109,473
Here: $109,473 State: $310,164 Mobile homes: $93,469
Here: $93,469 State: $78,855
Total population: 146 (Urban population: 0, Rural population: 169 (all nonfarm))
Houses: 62 (47 occupied: 37 owner occupied, 10 renter occupied)
| % of renters here: | 21% |
| State: | 33% |
Housing density: 106 houses/condos per square mile
Median price asked for vacant for-sale houses and condos in 2022 in this county: $730,824.
Median contract rent in 2022: $523 (lower quartile is $505, upper quartile is $547)
Median gross rent in Allenville, IL in 2022: $739
Housing units in Allenville with a mortgage: 19 (2 second mortgage, 0 home equity loan, 2 both second mortgage and home equity loan)
Houses without a mortgage: 0
Median household income for houses/condos with a mortgage: $62,577
Median household income for apartments without a mortgage: $71,470
Median monthly housing costs: $711
Compare current foreclosures near Allenville, IL:
| Photo | Address | Area | Beds / Baths | Price | Details |
|---|---|---|---|---|---|

|
#1
E 5th St
Hammond, IL 61929
|
- sq. feet
|
1 baths 4 beds |
$14,900
|
show details |

|
#2
S Polk St
Sullivan, IL 61951
|
816 sq. feet
|
1 baths 2 beds |
show details | |

|
#3
Locust Ave
Neoga, IL 62447
|
2,208 sq. feet
|
2 baths 4 beds |
show details | |

|
#4
E County Road 1100n
Mattoon, IL 61938
|
2,346 sq. feet
|
2 baths 4 beds |
show details | |

|
#5
W 7th St
Neoga, IL 62447
|
- sq. feet
|
- baths - beds |
$25,900
|
show details |

|
#6
E Main St
Arcola, IL 61910
|
3,252 sq. feet
|
3 baths 6 beds |
show details | |

|
#7
S 14th St
Mattoon, IL 61938
|
1,968 sq. feet
|
1 baths 4 beds |
show details | |

|
#8
Chickadee Ct W
Bethany, IL 61914
|
- sq. feet
|
2 baths 4 beds |
show details | |

|
#9
E Columbia St
Arthur, IL 61911
|
1,556 sq. feet
|
2 baths - beds |
show details | |

|
#10
Lincoln Ave
Arcola, IL 61910
|
754 sq. feet
|
1 baths - beds |
show details |
| Photo | Address | Area | Beds / Baths | Price | Details |
|---|---|---|---|---|---|

|
#11
Richmond Ave
Mattoon, IL 61938
|
1,296 sq. feet
|
- baths - beds |
show details | |

|
#12
N 1st Division St
Mattoon, IL 61938
|
1,180 sq. feet
|
- baths - beds |
show details | |

|
#13
S Lawn Dr
Mattoon, IL 61938
|
1,178 sq. feet
|
- baths - beds |
show details | |

|
#14
Bartlett Dr
Neoga, IL 62447
|
- sq. feet
|
- baths - beds |
show details | |

|
#15
Price Ave
Mattoon, IL 61938
|
- sq. feet
|
- baths - beds |
show details | |

|
#16
Stanley Ave
Mattoon, IL 61938
|
- sq. feet
|
- baths - beds |
show details | |

|
#17
Broadway Ave # 1
Mattoon, IL 61938
|
- sq. feet
|
- baths - beds |
show details | |

|
#18
N 11th St
Mattoon, IL 61938
|
- sq. feet
|
- baths - beds |
show details | |

|
#19
S 7th St
Mattoon, IL 61938
|
- sq. feet
|
- baths - beds |
show details | |

|
#20
Richmond Ave
Mattoon, IL 61938
|
- sq. feet
|
- baths - beds |
show details |
| Photo | Address | Area | Beds / Baths | Price | Details |
|---|---|---|---|---|---|

|
#21
E Co Road N, 1400
Humboldt, IL 61931
|
- sq. feet
|
- baths - beds |
show details | |

|
#22
S 6th St
Mattoon, IL 61938
|
- sq. feet
|
- baths - beds |
show details | |

|
#23
Lafayette Ave Apt 5
Mattoon, IL 61938
|
- sq. feet
|
- baths - beds |
show details | |

|
#24
E Division St
Findlay, IL 62534
|
- sq. feet
|
- baths - beds |
show details | |

|
#25
N 6th St
Mattoon, IL 61938
|
- sq. feet
|
- baths - beds |
show details | |

|
#26
N 3570 East Rd
Neoga, IL 62447
|
- sq. feet
|
- baths - beds |
show details | |

|
#27
S 9th St
Mattoon, IL 61938
|
- sq. feet
|
- baths - beds |
show details | |

|
#28
N 21st St
Mattoon, IL 61938
|
- sq. feet
|
- baths - beds |
show details | |

|
#29
N Camfield St
Sullivan, IL 61951
|
- sq. feet
|
- baths - beds |
show details | |

|
#30
N 2nd St
Gays, IL 61928
|
- sq. feet
|
- baths - beds |
show details |
| Photo | Address | Area | Beds / Baths | Price | Details |
|---|---|---|---|---|---|

|
#31
S 1st St
Gays, IL 61928
|
- sq. feet
|
- baths - beds |
show details | |

|
#32
N 34th St
Mattoon, IL 61938
|
- sq. feet
|
- baths - beds |
show details | |

|
#33
Westwood
Mattoon, IL 61938
|
- sq. feet
|
- baths - beds |
show details | |

|
#34
N County Road 1200e
Charleston, IL 61920
|
- sq. feet
|
- baths - beds |
show details | |

|
#35
Us Route 45
Neoga, IL 62447
|
- sq. feet
|
- baths - beds |
show details | |

|
#36
N 29th St
Mattoon, IL 61938
|
- sq. feet
|
- baths - beds |
show details | |

|
#37
2600 East Rd
Strasburg, IL 62465
|
- sq. feet
|
- baths - beds |
show details | |

|
#38
N 22nd St
Mattoon, IL 61938
|
- sq. feet
|
- baths - beds |
show details | |

|
#39
Railroad St
Trilla, IL 62469
|
- sq. feet
|
- baths - beds |
show details | |

|
#40
N County Road 1020e
Mattoon, IL 61938
|
- sq. feet
|
- baths - beds |
show details |
| Photo | Address | Area | Beds / Baths | Price | Details |
|---|---|---|---|---|---|

|
#41
Wills Pl, Apt 5
Arcola, IL 61910
|
- sq. feet
|
- baths - beds |
show details | |

|
#42
Western Ave
Mattoon, IL 61938
|
- sq. feet
|
- baths - beds |
show details | |

|
#43
Charleston Ave
Mattoon, IL 61938
|
- sq. feet
|
- baths - beds |
show details | |

|
#44
Cr 300e
Bethany, IL 61914
|
- sq. feet
|
- baths - beds |
show details | |

|
#45
Us Route 45
Mattoon, IL 61938
|
- sq. feet
|
- baths - beds |
show details | |

|
#46
Illinois Ave
Mattoon, IL 61938
|
- sq. feet
|
- baths - beds |
show details | |

|
#47
Primrose Ln
Mattoon, IL 61938
|
- sq. feet
|
- baths - beds |
show details | |

|
#48
Maple St
Humboldt, IL 61931
|
- sq. feet
|
- baths - beds |
show details | |

|
#49
College St
Lerna, IL 62440
|
- sq. feet
|
- baths - beds |
show details | |

|
Check over 1 million property listings on Foreclosure.com!
|
browse all offers | |||

Latest news about housing in Allenville, IL collected exclusively by city-data.com from local newspapers, TV, and radio stations


Median year apartment built: 1985
Household type by relationship:
Households: 93- Male householders: 24 (9 living alone), Female householders: 21 (3 living alone)
19 spouses (19 opposite-sex spouses), 2 unmarried partners, (2 opposite-sex unmarried partners), 21 children (20 natural, 0 adopted, 0 stepchildren), 0 grandchildren, 1 brothers or sisters, 0 parents, 0 foster children, 0 other relatives, 0 non-relatives
Size of family households: 14 2-persons, 2 3-persons, 13 4-persons.
Size of nonfamily households: 14 1-person, 3 2-persons.
16 married couples with children.
0 single-parent households (0 men, 0 women).
94.3% of residents of Allenville speak English at home.
4.5% of residents speak other Indo-European language at home (100% speak English very well).
| Here: | 5.6 |
| State: | 6.4 |
| Here: | 4.2 |
| State: | 4.1 |

- Bedrooms in owner-occupied houses and condos in Allenville, Illinois
- 1no bedroom
- 41 bedroom
- 102 bedrooms
- 183 bedrooms
- 44 bedrooms
- 05+ bedrooms

- Bedrooms in renter-occupied apartments in Allenville, Illinois
- 0no bedroom
- 11 bedroom
- 62 bedrooms
- 23 bedrooms
- 14 bedrooms
- 05+ bedrooms

- Cars and other vehicles available in Allenville in owner-occupied houses/condos
- 2no vehicle
- 41 vehicle
- 222 vehicles
- 23 vehicles
- 54 vehicles
- 25+ vehicles

- Cars and other vehicles available in Allenville in renter-occupied apartments
- 0no vehicle
- 91 vehicle
- 12 vehicles
- 03 vehicles
- 04 vehicles
- 05+ vehicles

- Rooms in owner-occupied houses in Allenville, Illinois
- 11 room
- 02 rooms
- 13 rooms
- 84 rooms
- 85 rooms
- 106 rooms
- 67 rooms
- 38 rooms
- 09+ rooms

- Rooms in renter-occupied apartments in Allenville, Illinois
- 01 room
- 02 rooms
- 03 rooms
- 64 rooms
- 35 rooms
- 16 rooms
- 07 rooms
- 08 rooms
- 09+ rooms


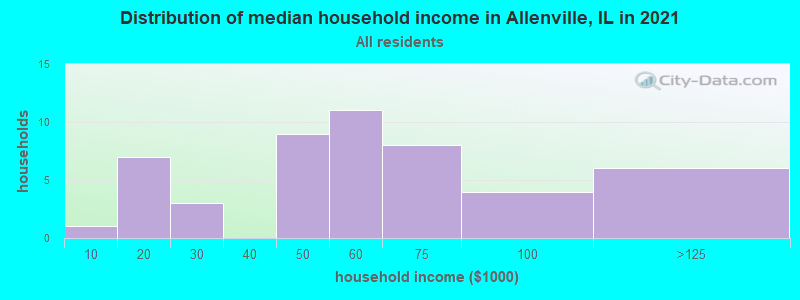
Allenville, IL household income distribution

- 1Less than $10,000
- 6$10,000 to $19,999
- 5$20,000 to $29,999
- 1$40,000 to $49,999
- 5$50,000 to $59,999
- 16$60,000 to $74,999
- 7$75,000 to $99,999
- 7$100,000 to $124,999
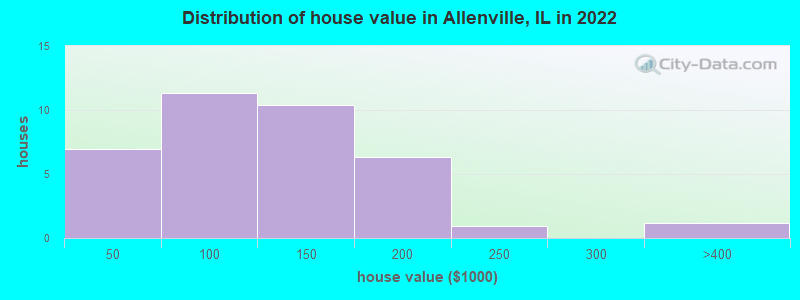
Home value of owner - occupied houses in 2022 in Allenville, IL
-
- 1$10,000 to $14,999
- 2$15,000 to $19,999
- 0$25,000 to $29,999
- 2$35,000 to $39,999
- 2$50,000 to $59,999
- 3$60,000 to $69,999
- 5$70,000 to $79,999
- 7$100,000 to $124,999
- 2$125,000 to $149,999
- 6$150,000 to $174,999
- 0$200,000 to $249,999
- 1$300,000 to $399,999
Rent paid by renters in 2022 in Allenville, IL
-
- 1$400 to $449
- 7$500 to $549
- 1$700 to $749
- 1No cash rent


Percentage of workers working in this county: 68.2%
Number of people working at home: 0 (0.0% of all workers)
Travel time to work (commute)
- Less than 5 minutes: 1
- 5 to 9 minutes: 7
- 10 to 14 minutes: 12
- 15 to 19 minutes: 0
- 20 to 24 minutes: 5
- 25 to 29 minutes: 0
- 30 to 34 minutes: 3
- 35 to 39 minutes: 0
- 40 to 44 minutes: 0
- 45 to 59 minutes: 5
- 60 to 89 minutes: 0
- 90 or more minutes: 0
Means of transportation to work:
- Drove a car alone: 89 (87.3%)
- Carpooled: 8 (7.8%)
- Walked: 2 (2.0%)
- Worked at home: 3 (2.9%)

- Unemployment by race in 2022
- Unemployment rate for White non-Hispanic residents
- 4.4%Females

- Year of entry for the foreign-born population in Allenville, Illinois
- 01995 to March 2000
- 01990 to 1994
- 01985 to 1989
- 01980 to 1984
- 01975 to 1979
- 21970 to 1974
- 01965 to 1969
- 0Before 1965

First ancestries reported:
- American: 23 (64.8%)
- German: 6 (16.9%)
Most common places of birth for foreign-born residents (%):
| Allenville: | 100.0% (2) |
| Illinois: | 2.1% (32,764) |
Place of birth for U.S.-born residents:
- This state: 91
- Other state: 1
- Northeast: 0
- Midwest: 1
- South: 0
- West: 0
97.8% of Allenville residents lived in the same house 1 years ago.
Out of people who lived in different houses, 0.0% lived in this county.
Out of people who lived in different counties, 100.0% lived in Illinois.
| Allenville: | 97.8% |
| State average: | 88.3% |
Education attainment for males 25 years and older:
- No schooling: 0
- Nursery to 4th grade: 0
- 5th and 6th grade: 0
- 7th and 8th grade: 0
- 9th grade: 0
- 10th grade: 0
- 11th grade: 1
- 12th grade, no diploma: 0
- High school graduate (or equivalency): 16
- Less than 1 year of college: 2
- Some college more than 1 year, no degree: 8
- Associate degree: 0
- Bachelor's degree: 4
- Master's degree: 3
- Professional school degree: 0
- Doctorate degree: 0

Education attainment for females 25 years and older:
- No schooling: 1
- Nursery to 4th grade: 0
- 5th and 6th grade: 0
- 7th and 8th grade: 0
- 9th grade: 0
- 10th grade: 0
- 11th grade: 0
- 12th grade, no diploma: 1
- High school graduate (or equivalency): 9
- Less than 1 year of college: 5
- Some college more than 1 year, no degree: 9
- Associate degree: 2
- Bachelor's degree: 1
- Master's degree: 1
- Professional school degree: 1
- Doctorate degree: 0


Housing units in structures:
- One, detached: 35
- Mobile homes: 27
Median worth of mobile homes: $93,989
Housing units lacking complete kitchen facilities in 2022: 8.1%
House/condo owner moved in on average 24 years ago
Renter moved in on average 2 years ago

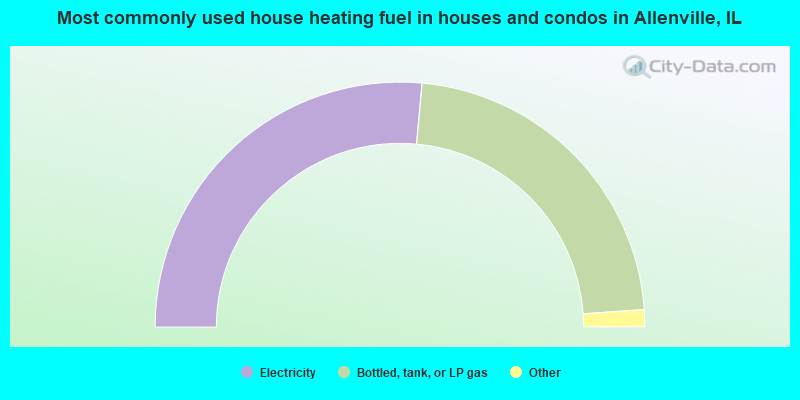
- 54.1%Electricity
- 45.9%Bottled, tank, or LP gas
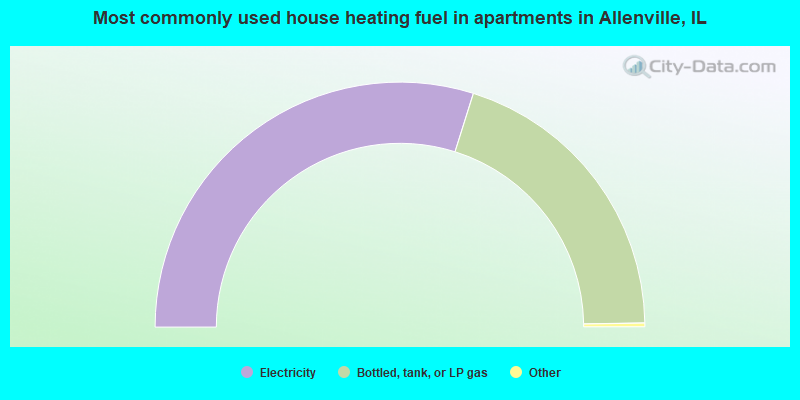
- 60.0%Electricity
- 40.0%Bottled, tank, or LP gas
Private vs. public school enrollment:
| Here: | 28.6% |
| Illinois: | 13.3% |
| Here: | 100.0% |
| Illinois: | 9.9% |
| Here: | 0.0% |
| Illinois: | 27.4% |


