Allentown, NJ (New Jersey) Houses and Residents
| Allentown: | $408,636 |
| New Jersey: | $428,900 |
Mean price in 2022:
Detached houses: $432,529
Here: $432,529 State: $537,591 Townhouses or other attached units: $288,199
Here: $288,199 State: $381,113
Total population: 1,807 (All urban)
Houses: 731 (694 occupied: 530 owner occupied, 175 renter occupied)
| % of renters here: | 25% |
| State: | 35% |
Housing density: 1,203 houses/condos per square mile
Median price asked for vacant for-sale houses and condos in 2022: $4,099,040.
Median contract rent in 2022: $1,384 (lower quartile is $1,165, upper quartile is over $2,000)
Median rent asked for vacant for-rent units in 2022: $1,457
Median gross rent in Allentown, NJ in 2022: $1,521
Housing units in Allentown with a mortgage: 349 (23 second mortgage, 0 home equity loan, 22 both second mortgage and home equity loan)
Houses without a mortgage: 25
Median household income for houses/condos with a mortgage: $146,943
Median household income for apartments without a mortgage: $71,615
Median monthly housing costs: $1,971
Compare current foreclosures near Allentown, NJ:
| Photo | Address | Area | Beds / Baths | Price | Details |
|---|---|---|---|---|---|

|
#1
Bunker Hill Dr
Allentown, NJ 08501
|
1,748 sq. feet
|
1 baths 2 beds |
show details | |

|
#2
Route 526
Allentown, NJ 08501
|
1,396 sq. feet
|
- baths - beds |
show details | |

|
#3
E Branch Rd
Allentown, NJ 08501
|
- sq. feet
|
- baths - beds |
show details | |

|
#4
Lenn Rd
Allentown, NJ 08501
|
3,872 sq. feet
|
- baths - beds |
show details | |

|
#5
Waldron Dr
Allentown, NJ 08501
|
1,075 sq. feet
|
- baths - beds |
show details | |

|
#6
Yeger Dr
Allentown, NJ 08501
|
4,116 sq. feet
|
- baths - beds |
show details | |

|
#7
Ellisdale Rd
Allentown, NJ 08501
|
1,824 sq. feet
|
- baths - beds |
show details | |

|
#8
S Main St
Allentown, NJ 08501
|
- sq. feet
|
- baths - beds |
show details | |

|
#9
Smith Dr
Allentown, NJ 08501
|
3,149 sq. feet
|
- baths - beds |
show details | |

|
#10
Linden Ave
Burlington, NJ 08016
|
1,504 sq. feet
|
1 baths 3 beds |
$95,500
|
show details |
| Photo | Address | Area | Beds / Baths | Price | Details |
|---|---|---|---|---|---|

|
#11
Moore Ct
Pennington, NJ 08534
|
940 sq. feet
|
1 baths 2 beds |
$195,993
|
show details |

|
#12
N Cedar St
Bristol, PA 19007
|
841 sq. feet
|
1 baths 1 beds |
$299,500
|
show details |

|
#13
E Howell St
Trenton, NJ 08610
|
1,272 sq. feet
|
1 baths 3 beds |
$374,500
|
show details |

|
#14
Threadleaf Ter
Burlington, NJ 08016
|
2,688 sq. feet
|
2 baths 3 beds |
$470,000
|
show details |

|
#15
Crosswicks Ellisdale Rd
Allentown, NJ 08501
|
- sq. feet
|
- baths - beds |
show details | |

|
#16
Province Line Rd
Allentown, NJ 08501
|
- sq. feet
|
- baths - beds |
show details | |

|
#17
Extonville Rd
Allentown, NJ 08501
|
- sq. feet
|
- baths - beds |
show details | |

|
#18
N Harrison St
Princeton, NJ 08540
|
2,572 sq. feet
|
2 baths 2 beds |
show details | |

|
#19
W Bridge St
Morrisville, PA 19067
|
1,801 sq. feet
|
1 baths 4 beds |
show details | |

|
#20
Myrtle Ln
Levittown, PA 19054
|
1,494 sq. feet
|
1 baths 3 beds |
show details |
| Photo | Address | Area | Beds / Baths | Price | Details |
|---|---|---|---|---|---|

|
#21
Hemlock Rd
Levittown, PA 19056
|
1,415 sq. feet
|
2 baths 3 beds |
show details | |

|
#22
Andover Rd
Fairless Hills, PA 19030
|
1,056 sq. feet
|
1 baths 3 beds |
show details | |

|
#23
Hornerstown Rd
Cream Ridge, NJ 08514
|
1,680 sq. feet
|
2 baths 2 beds |
show details | |

|
#24
Jewel Rd
Princeton Junction, NJ 08550
|
- sq. feet
|
2 baths 4 beds |
show details | |

|
#25
1st St
Langhorne, PA 19047
|
1,276 sq. feet
|
2 baths 3 beds |
show details | |

|
#26
Paint Island Spring Rd
Clarksburg, NJ 08510
|
3,369 sq. feet
|
4 baths 4 beds |
show details | |

|
#27
Nestingrock Ln
Levittown, PA 19054
|
1,780 sq. feet
|
3 baths 3 beds |
show details | |

|
#28
Haviland Dr
Perrineville, NJ 08535
|
3,936 sq. feet
|
3 baths 4 beds |
show details | |

|
#29
Maple Ln
Levittown, PA 19054
|
1,512 sq. feet
|
1 baths 3 beds |
show details | |

|
#30
University Dr
Morrisville, PA 19067
|
2,158 sq. feet
|
2 baths 4 beds |
show details |
| Photo | Address | Area | Beds / Baths | Price | Details |
|---|---|---|---|---|---|

|
#31
Edgar Rd
Jackson, NJ 08527
|
1,296 sq. feet
|
2 baths 3 beds |
show details | |

|
#32
Newberry Ln
Levittown, PA 19054
|
1,969 sq. feet
|
1 baths 4 beds |
show details | |

|
#33
Lakehurst Rd
Browns Mills, NJ 08015
|
981 sq. feet
|
1 baths 3 beds |
show details | |

|
#34
Carlyle Dr
Wrightstown, NJ 08562
|
2,567 sq. feet
|
2 baths 3 beds |
show details | |

|
#35
Franklin St
Trenton, NJ 08611
|
1,232 sq. feet
|
1 baths 3 beds |
show details | |

|
#36
Fleetwing Dr
Levittown, PA 19057
|
825 sq. feet
|
2 baths 3 beds |
show details | |

|
#37
Juniper Dr
Levittown, PA 19056
|
2,002 sq. feet
|
2 baths 4 beds |
show details | |

|
#38
Park St
Browns Mills, NJ 08015
|
1,110 sq. feet
|
1 baths 3 beds |
show details | |

|
#39
Falcon Rd
Levittown, PA 19056
|
2,289 sq. feet
|
2 baths 3 beds |
show details | |

|
#40
Midwood Ln
Levittown, PA 19054
|
1,000 sq. feet
|
1 baths 3 beds |
show details |
| Photo | Address | Area | Beds / Baths | Price | Details |
|---|---|---|---|---|---|

|
#41
Glenmar Rd
Fairless Hills, PA 19030
|
1,272 sq. feet
|
1 baths 3 beds |
show details | |

|
#42
Yardley Rd
Morrisville, PA 19067
|
2,360 sq. feet
|
2 baths 3 beds |
show details | |

|
#43
Morgan Ave
Morrisville, PA 19067
|
1,944 sq. feet
|
2 baths 4 beds |
show details | |

|
#44
Grover Ave
Trenton, NJ 08610
|
1,036 sq. feet
|
2 baths 3 beds |
show details | |

|
#45
Highland Park Pl
Levittown, PA 19056
|
1,845 sq. feet
|
2 baths 3 beds |
show details | |

|
#46
Vista Rd
Levittown, PA 19057
|
1,309 sq. feet
|
1 baths 3 beds |
show details | |

|
#47
Regency Dr
Mount Holly, NJ 08060
|
1,008 sq. feet
|
2 baths 2 beds |
show details | |

|
#48
Wynfield Ave
Bristol, PA 19007
|
1,454 sq. feet
|
4 baths 4 beds |
show details | |

|
#49
Holly Dr
Levittown, PA 19055
|
1,560 sq. feet
|
2 baths 3 beds |
show details | |

|
Check over 1 million property listings on Foreclosure.com!
|
browse all offers | |||

Latest news about housing in Allentown, NJ collected exclusively by city-data.com from local newspapers, TV, and radio stations


Median year apartment built: 1950
Household type by relationship:
Households: 1,819- Male householders: 330 (74 living alone), Female householders: 361 (92 living alone)
367 spouses (363 opposite-sex spouses), 39 unmarried partners, (35 opposite-sex unmarried partners), 636 children (612 natural, 20 adopted, 3 stepchildren), 16 grandchildren, 22 brothers or sisters, 17 parents, 0 foster children, 19 other relatives, 11 non-relatives
Size of family households: 186 2-persons, 177 3-persons, 70 4-persons, 56 5-persons, 20 6-persons.
Size of nonfamily households: 165 1-person, 28 2-persons, 3 4-persons.
315 married couples with children.
82 single-parent households (27 men, 55 women).
91.6% of residents of Allentown speak English at home.
0.8% of residents speak Spanish at home (100% speak English very well).
4.3% of residents speak other Indo-European language at home (55% speak English very well, 11% speak English well, 34% speak English not well).
3.0% of residents speak Asian or Pacific Island language at home (86% speak English very well, 14% speak English well).
0.4% of residents speak other language at home (100% speak English very well).
Foreign born population: 130 (7.1%)
(78.5% of them are naturalized citizens)
| Here: | 7.3 |
| State: | 6.8 |
| Here: | 4.7 |
| State: | 3.9 |

- Bedrooms in owner-occupied houses and condos in Allentown, New Jersey
- 0no bedroom
- 01 bedroom
- 642 bedrooms
- 2803 bedrooms
- 1324 bedrooms
- 545+ bedrooms

- Bedrooms in renter-occupied apartments in Allentown, New Jersey
- 0no bedroom
- 511 bedroom
- 632 bedrooms
- 583 bedrooms
- 04 bedrooms
- 35+ bedrooms

- Cars and other vehicles available in Allentown in owner-occupied houses/condos
- 4no vehicle
- 1041 vehicle
- 2392 vehicles
- 1453 vehicles
- 354 vehicles
- 35+ vehicles

- Cars and other vehicles available in Allentown in renter-occupied apartments
- 7no vehicle
- 791 vehicle
- 722 vehicles
- 183 vehicles
- 04 vehicles
- 05+ vehicles

- Rooms in owner-occupied houses in Allentown, New Jersey
- 01 room
- 02 rooms
- 03 rooms
- 274 rooms
- 885 rooms
- 916 rooms
- 777 rooms
- 1178 rooms
- 1329+ rooms

- Rooms in renter-occupied apartments in Allentown, New Jersey
- 01 room
- 02 rooms
- 413 rooms
- 394 rooms
- 475 rooms
- 196 rooms
- 247 rooms
- 38 rooms
- 39+ rooms


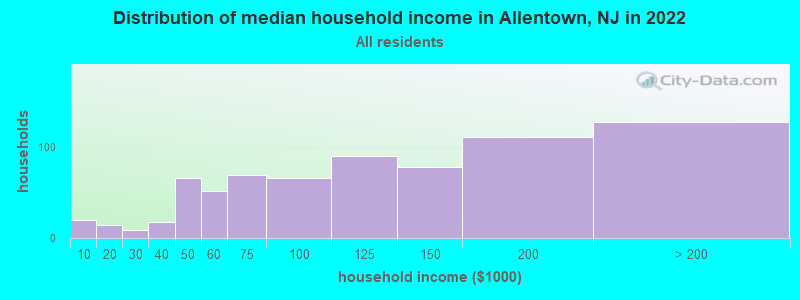
Allentown, NJ household income distribution

- 20Less than $10,000
- 14$10,000 to $19,999
- 9$20,000 to $29,999
- 17$30,000 to $39,999
- 66$40,000 to $49,999
- 51$50,000 to $59,999
- 69$60,000 to $74,999
- 66$75,000 to $99,999
- 90$100,000 to $124,999
- 78$125,000 to $149,999
- 111$150,000 to $199,999
- 127$200,000 or more
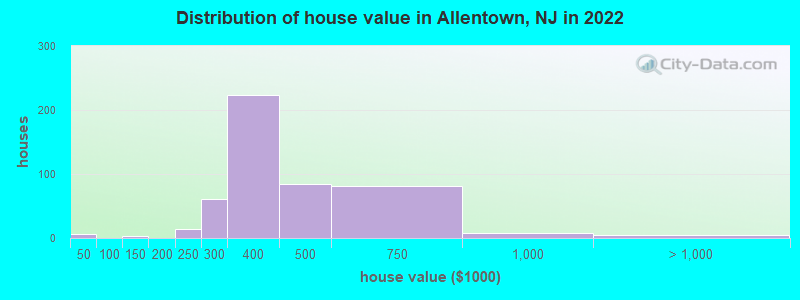
Home value of owner - occupied houses in 2022 in Allentown, NJ
-
- 5$30,000 to $34,999
- 2$125,000 to $149,999
- 13$200,000 to $249,999
- 61$250,000 to $299,999
- 222$300,000 to $399,999
- 83$400,000 to $499,999
- 80$500,000 to $749,999
- 8$750,000 to $999,999
- 4$2,000,000 or more
Rent paid by renters in 2022 in Allentown, NJ
-
- 4$500 to $549
- 51$1,000 to $1,249
- 48$1,250 to $1,499
- 18$1,500 to $1,999
- 47$2,000 to $2,499
- 3$3,500 or more


Percentage of workers working in this county: 34.6%
Number of people working at home: 182 (18.3% of all workers)
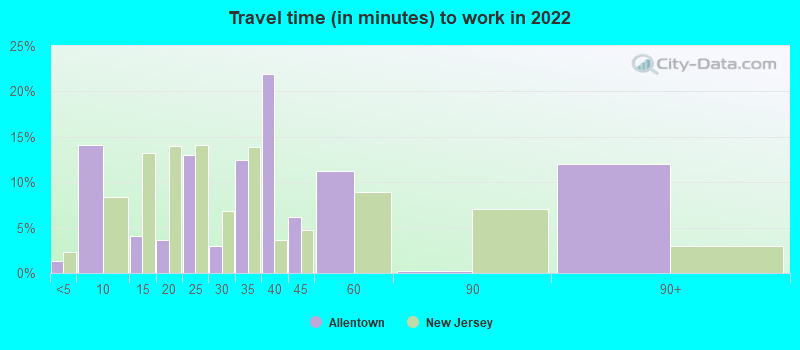
Travel time to work (commute)
- Less than 5 minutes: 17
- 5 to 9 minutes: 29
- 10 to 14 minutes: 54
- 15 to 19 minutes: 80
- 20 to 24 minutes: 123
- 25 to 29 minutes: 64
- 30 to 34 minutes: 180
- 35 to 39 minutes: 55
- 40 to 44 minutes: 59
- 45 to 59 minutes: 91
- 60 to 89 minutes: 25
- 90 or more minutes: 24
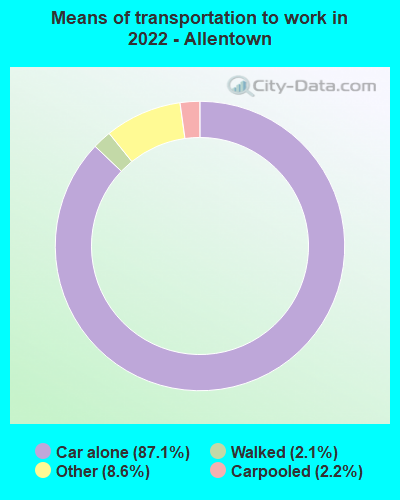
Means of transportation to work:
- Drove a car alone: 700 (67.8%)
- Carpooled: 20 (1.9%)
- Taxi: 105 (10.2%)
- Walked: 24 (2.3%)
- Worked at home: 182 (17.6%)

- Unemployment by race in 2022
- Unemployment rate for White non-Hispanic residents
- 3.6%Males
- 0.7%Females
- Unemployment rate for Asian residents
- 100.0%Females
- Unemployment rate for two or more race residents
- 10.7%Females
- Unemployment rate for Hispanic or Latino residents
- 20.2%Males

- Year of entry for the foreign-born population in Allentown, New Jersey
- 292010 or later
- 162000 to 2009
- 111990 to 1999
- 71980 to 1989
- 71970 to 1979
- 35Before 1970

First ancestries reported:
- Irish: 101 (16.6%)
- Italian: 89 (14.7%)
- German: 88 (14.5%)
- Polish: 56 (9.2%)
- English: 44 (7.2%)
- American: 41 (6.8%)
- Canadian: 28 (4.6%)
- Slovak: 13 (2.1%)
- Austrian: 11 (1.8%)
- European: 9 (1.5%)
- Norwegian: 5 (0.8%)
- Scottish: 4 (0.7%)
- Brazilian: 3 (0.5%)
- Swedish: 3 (0.5%)
- Ukrainian: 3 (0.5%)
- British: 2 (0.3%)
- French Canadian: 2 (0.3%)
- Scotch-Irish: 2 (0.3%)
- Welsh: 1 (0.2%)
Most common places of birth for foreign-born residents (%):
| Allentown: | 26.2% (34) |
| New Jersey: | 0.9% (18,317) |
| Allentown: | 25.4% (33) |
| New Jersey: | 4.0% (85,934) |
| Allentown: | 14.6% (19) |
| New Jersey: | 2.2% (46,813) |
| Allentown: | 8.5% (11) |
| New Jersey: | 0.4% (8,146) |
| Allentown: | 5.4% (7) |
| New Jersey: | 0.8% (17,949) |
| Allentown: | 3.1% (4) |
| New Jersey: | 3.7% (78,969) |
| Allentown: | 3.1% (4) |
| New Jersey: | 2.1% (45,435) |
| Allentown: | 2.3% (3) |
| New Jersey: | 0.5% (11,161) |
| Allentown: | 2.3% (3) |
| New Jersey: | 2.1% (46,020) |
| Allentown: | 2.3% (3) |
| New Jersey: | 4.4% (95,275) |
| Allentown: | 1.5% (2) |
| New Jersey: | 3.3% (70,512) |
| Allentown: | 1.5% (2) |
| New Jersey: | 0.5% (10,886) |
Place of birth for U.S.-born residents:
- This state: 1,256
- Other state: 413
- Northeast: 242
- Midwest: 20
- South: 121
- West: 37
94.5% of Allentown residents lived in the same house 1 years ago.
Out of people who lived in different houses, 25.2% lived in this county.
Out of people who lived in different counties, 46.6% lived in New Jersey.
| Allentown: | 94.5% |
| State average: | 90.4% |
Education attainment for males 25 years and older:
- No schooling: 0
- Nursery to 4th grade: 7
- 5th and 6th grade: 16
- 7th and 8th grade: 0
- 9th grade: 0
- 10th grade: 1
- 11th grade: 0
- 12th grade, no diploma: 2
- High school graduate (or equivalency): 108
- Less than 1 year of college: 27
- Some college more than 1 year, no degree: 35
- Associate degree: 58
- Bachelor's degree: 203
- Master's degree: 87
- Professional school degree: 12
- Doctorate degree: 5

Education attainment for females 25 years and older:
- No schooling: 3
- Nursery to 4th grade: 0
- 5th and 6th grade: 4
- 7th and 8th grade: 16
- 9th grade: 2
- 10th grade: 14
- 11th grade: 4
- 12th grade, no diploma: 0
- High school graduate (or equivalency): 95
- Less than 1 year of college: 42
- Some college more than 1 year, no degree: 33
- Associate degree: 60
- Bachelor's degree: 257
- Master's degree: 136
- Professional school degree: 4
- Doctorate degree: 2


Housing units in structures:
- One, detached: 571
- One, attached: 38
- Two: 37
- 3 or 4: 21
- 5 to 9: 31
- 10 to 19: 33
House/condo owner moved in on average 19 years ago
Renter moved in on average 3 years ago

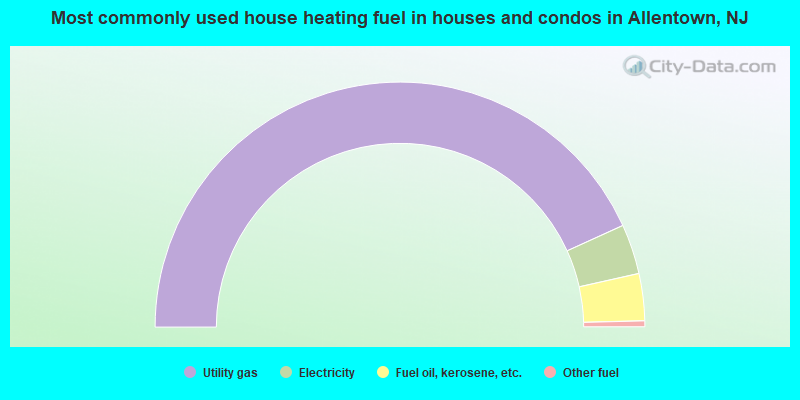
- 86.5%Utility gas
- 6.6%Electricity
- 6.2%Fuel oil, kerosene, etc.
- 0.8%Other fuel

- 61.0%Utility gas
- 35.5%Electricity
- 2.3%No fuel used
- 1.2%Fuel oil, kerosene, etc.
Private vs. public school enrollment:
| Here: | 7.2% |
| New Jersey: | 12.3% |
| Here: | 2.3% |
| New Jersey: | 13.1% |
| Here: | 26.0% |
| New Jersey: | 33.2% |


