| Fire incidents reported |
|---|
| Sreet name | Count |
|---|
| US HWY 83 | 34 | | US 83 HWY | 20 | | FM 3169 RD | 6 | | HWY 83 | 6 | | SOUTH HWY 83 | 6 | | 4TH AND MIER | 4 | | EVERGREEN ST | 4 | | HWY 16 | 4 | | LOS LOBOS RD | 4 | | VILLA AVE | 4 | | ZAPATA | 4 | | 1 MILE SOUTH OF CHIHUAHUA | 2 | | 1 MILE SOUTH OF CHIUAHUA TX | 2 | | 1.4 MILES NORTH ON HWY 83 | 2 | | 10 MILES SOUTH OF ZAPATA | 2 | | 1006 GLENN STREET | 2 | | 1028 FRESNO STREET | 2 | | 105 MIRA FLORES | 2 | | 10TH & FALCON | 2 | | 10TH AND FALCON | 2 | | 1103 CARLA STREET FRKS | 2 | | 1105 DELMAR | 2 | | 1109 DELMAR | 2 | | 1109 MEDINA ST | 2 | | 1110 MEDINA | 2 |
| | | Fire incidents reported |
|---|
| Sreet name | Count |
|---|
| 1116SOUTH SL | 2 | | 12 MILES SOUTH HWY 83 | 2 | | 1208 FALCON LANE | 2 | | 1220 SOUTH SIESTA LANE LN | 2 | | 1222 SOUTH SIESTA LN | 2 | | 12TH ST AND 1ST ST | 2 | | 1301 ROMA ST | 2 | | 1309 N US HWY 83 | 2 | | 13TH AND BRAVO ST | 2 | | 1402 HIDALGO | 2 | | 1402 ROMA | 2 | | 1403 GUERRO ST ST | 2 | | 1406 JUAREZ ST | 2 | | 1406 LINCOLN STREET ST | 2 | | 146 ROMA | 2 | | 14TH JACKSON | 2 | | 15 MILES EAST ON HWY 16 | 2 | | 15 MILES SOUTH OF ZAPATA US 83 | 2 | | 155 PAPYA DR | 2 | | 16 AND 19TH STEET | 2 | | 1601 VILLA | 2 | | 167 SOUNTH US HWY 83 | 2 | | 168 MADISON | 2 | | 16TH ST | 2 | | |
|
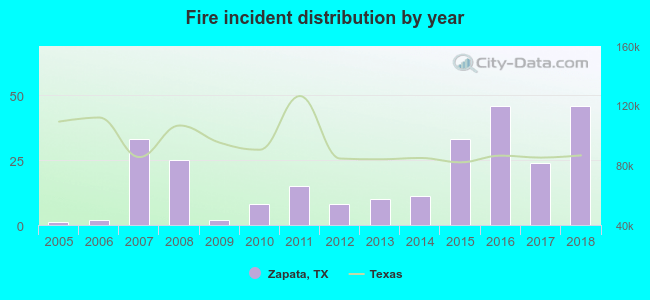 Based on the data from the years 2005 - 2018 the average number of fires per year is 19. The highest number of fire incidents - 46 took place in 2016, and the least - 1 in 2005. The data has a growing trend.
 26.5% incidents where reported in the morning and 73.5% in the evening. The most fires (16.3%) took place on Friday, and the least (11.4%) on Sunday.
 Based on the 264 fires from years 2005 - 2018 most fires (15.5%) took place during January, and the least (4.9%) in November.
 Out of all 391 cases reported during the years 2005 - 2018, the most belonged to the categories: Fire (67.5%), Rescue & EMS (14.3%), and Hazardous Condition (7.2%).
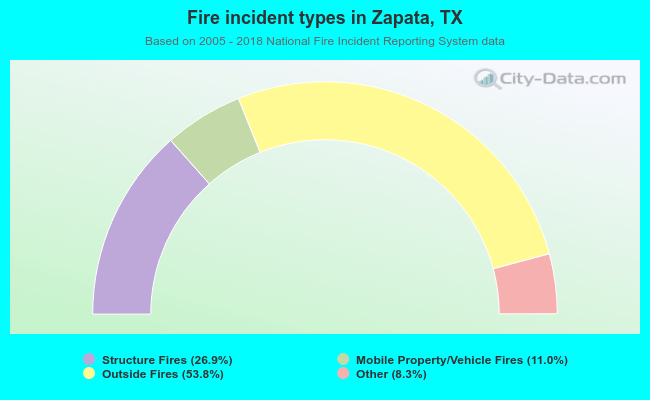 When looking into fire subcategories, the most incidents belonged to: Outside Fires (53.8%), and Structure Fires (26.9%).