Yorba Linda: Fire Incidents, California (CA)
Where are fire incidents reported in Yorba Linda, CA
Something went wrong! Please refresh the page.
| Fire incidents reported | |
|---|---|
| Sreet name | Count |
| YORBA LINDA | 58 |
| GRANBY | 38 |
| PROSPECT | 28 |
| SAVI RANCH | 28 |
| AVIEMORE | 26 |
| HIDDEN HILLS | 26 |
| LAKEVIEW | 26 |
| CASA LOMA | 24 |
| SAN ANTONIO | 24 |
| DORINDA | 22 |
| HEATHERIDGE | 22 |
| MISSION HILLS LANE | 22 |
| BIG HORN MOUNTAIN | 20 |
| LA PALMA | 20 |
| IMPERIAL | 18 |
| BASTANCHURY | 16 |
| DEODAR | 16 |
| CARDIFF | 14 |
| CRESCENT | 14 |
| RIVER BEND | 14 |
| WB 91GYPSUM CANYON | 14 |
| BRUSH CANYON | 12 |
| EB 91 FY/241 HY | 12 |
| FAIRMONT | 12 |
| HIGHLAND | 12 |
| OHIO | 12 |
| PASEO DE TORONTO | 12 |
| VALLEY VIEW | 12 |
| WB 91 FY/GREEN RIVER | 12 |
| BLUE RIDGE | 10 |
| Other | 428 |
2005 - 2018 National Fire Incident Reporting System (NFIRS) incidents
- Incident types reported to NFIRS in Yorba Linda, CA
- 10,76568.5%Rescue & EMS
- 1,5559.9%Good Intent Call
- 1,0246.5%Fire
- 1,0226.5%Service Call
- 6924.4%Hazardous Condition
- 6103.9%False Alarm
- 270.2%Overpressure Rupture
- Fire incident types reported to NFIRS in Yorba Linda, CA
- 42241.2%Structure Fires
- 33032.2%Outside Fires
- 20019.5%Mobile Property/Vehicle Fires
- 727.0%Other
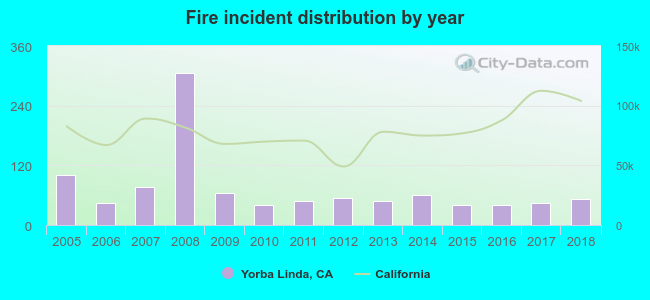 Based on the data from the years 2005 - 2018 the average number of fires per year is 73. The highest number of fires - 305 took place in 2008, and the least - 40 in 2015. The data has a decreasing trend.
The average number of yearly fire incidents per 10k residents in Yorba Linda, CA compared to nearest cities:
(Note: Based on data for the last 3 years, including only cities with population 5,000 and above)
| Yorba Linda: | 6.8 |
| Placentia: | 8.7 |
| Villa Park: | 6.7 |
| Orange: | 5.0 |
| Brea: | 14.2 |
| Anaheim: | 11.0 |
| Chino Hills: | 5.7 |
| Fullerton: | 9.2 |
| Diamond Bar: | 9.5 |
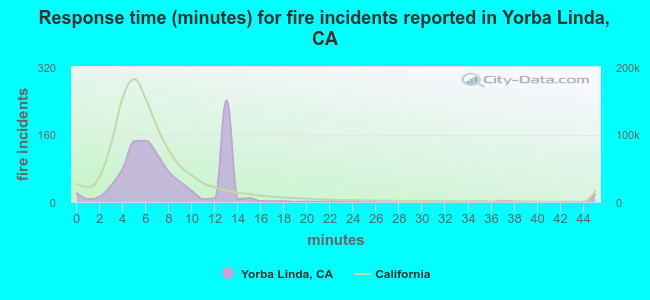 The median response time based on all reported fire incidents is 7 minutes. This is close to the California median value.
The median response time in Yorba Linda, CA compared to nearest cities:
(Note: Based on data for all years, including only cities with at least 500 fire incidents)
| Yorba Linda: | 7 minutes |
| Placentia: | 5 minutes |
| Orange: | 5 minutes |
| Anaheim: | 6 minutes |
| Fullerton: | 6 minutes |
| Diamond Bar: | 6 minutes |
| La Habra: | 5 minutes |
| Tustin: | 6 minutes |
| Chino: | 6 minutes |
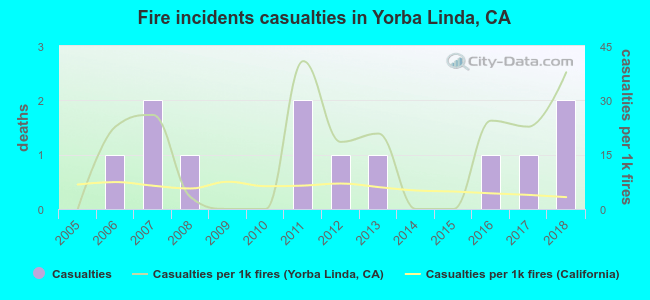 According to the reports from the years 2005 - 2018 the average number of fire-related casualties per year is 1. The highest number of reported injuries - 2 took place in 2007, and the lowest - 0 in 2005. The data has an increasing trend.
The average number of injuries per 1,000 fires is 16. This indicator was the highest - 41 in 2011, and the lowest 0 in 2005. The trend for casualties per 1,000 incidents is increasing. Compared to the California value the number of injuries per 1,000 fires is much higher.
According to the reports from the years 2005 - 2018 the average number of fire-related casualties per year is 1. The highest number of reported injuries - 2 took place in 2007, and the lowest - 0 in 2005. The data has an increasing trend.
The average number of injuries per 1,000 fires is 16. This indicator was the highest - 41 in 2011, and the lowest 0 in 2005. The trend for casualties per 1,000 incidents is increasing. Compared to the California value the number of injuries per 1,000 fires is much higher.
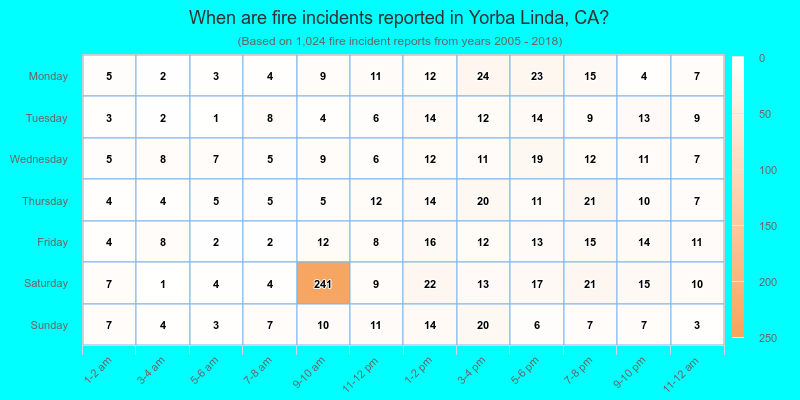
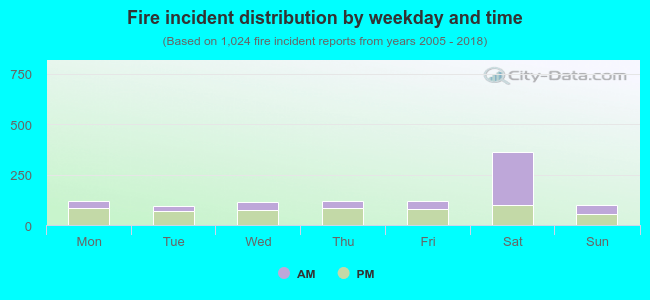 46.6% incidents where reported in the morning and 53.4% in the evening. The most fires (35.5%) took place on Saturday, and the least (9.3%) on Tuesday.
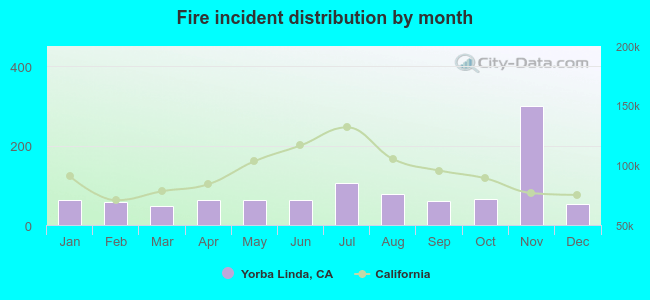 Based on the 1,024 fire incident reports from years 2005 - 2018 most fires (29.4%) took place during November, and the least (4.8%) in March.
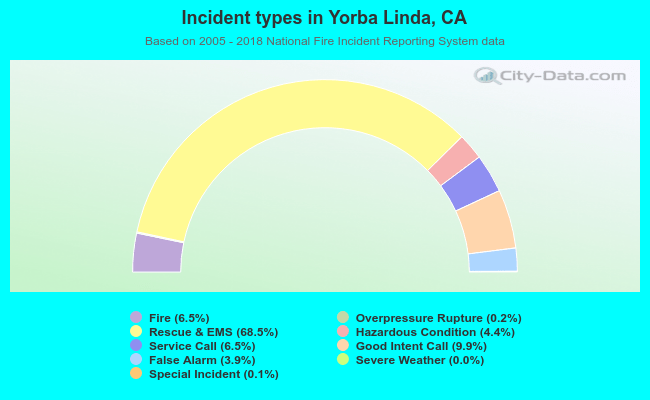 Out of all 15,709 cases reported during the years 2005 - 2018, the most belonged to the categories: Rescue & EMS (68.5%), Good Intent Call (9.9%), and Fire (6.5%).
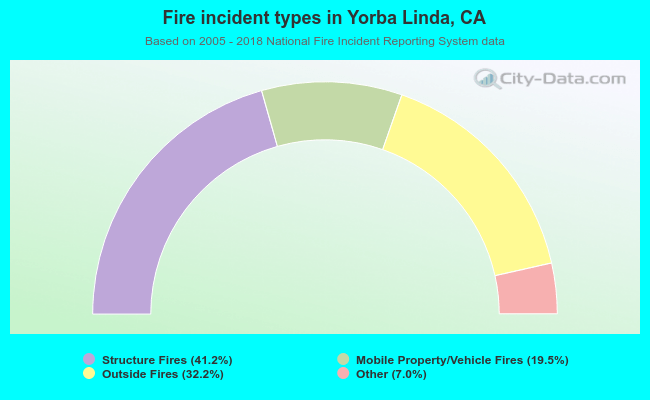 When looking into fire subcategories, the most reports belonged to: Structure Fires (41.2%), and Outside Fires (32.2%).