| Fire incidents reported |
|---|
| Sreet name | Count |
|---|
| TINKER ST | 40 | | GLASCO TPKE | 34 | | MILL HILL RD | 24 | | OHAYO MOUNTAIN RD | 14 | | ELWYN LANE | 12 | | MEADS MOUNTAIN RD | 12 | | MEADS MTN RD | 12 | | BROADVIEW RD | 10 | | DIXON AVE | 10 | | ROCK CITY RD | 10 | | UPPER BYRDCLIFFE RD | 10 | | ORIOLE DR | 8 | | PLOCHMANN LANE | 8 | | ROUTE 375 | 8 | | WEST SAUGERTIES RD | 8 | | YERRY HILL RD | 8 | | CALIFORNIA QUARRY RD | 6 | | COOPER LAKE RD | 6 | | JOHN JOY RD | 6 | | LEWIS HOLLOW RD | 6 | | MILLSTREAM RD | 6 | | OVERLOOK DR | 6 | | ROUTE 212 | 6 | | VAN DALE RD | 6 | | WEST HURLEY RD | 6 |
| | | Fire incidents reported |
|---|
| Sreet name | Count |
|---|
| WILEY LANE | 6 | | ZENA RD | 6 | | BELLOWS LANE | 4 | | CALAMAR LN | 4 | | CHESTNUT HILL RD | 4 | | DEMING ST | 4 | | ELWYN QUARRY | 4 | | HASBROUCK LANE | 4 | | LIVINGSTON CT | 4 | | LOWER BYRDCLIFFE RD | 4 | | MONTOMA LANE | 4 | | OHAYO MTN RD | 4 | | OLD FORGE RD | 4 | | PINE GROVE ST | 4 | | RATTERMAN RD | 4 | | RICKS RD | 4 | | SAWKILL RD | 4 | | SCHOONMAKER LANE | 4 | | TANNERY BROOK RD | 4 | | VAN DE BOGART RD | 4 | | 212 | 2 | | AVALON HILL RD | 2 | | BAUMGARTEN RD | 2 | | BIRCH LANE | 2 | | BROADVIEW RD | 2 |
|
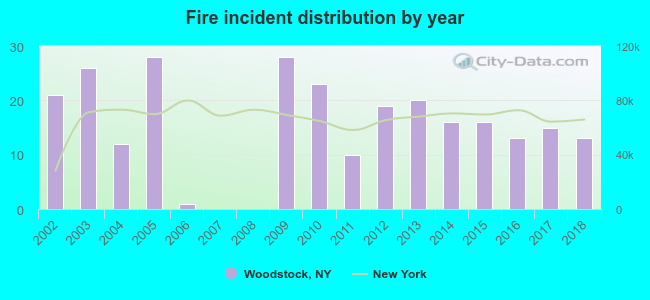 According to the data from the years 2002 - 2018 the average number of fires per year is 15. The highest number of fires - 28 took place in 2005, and the least - 0 in 2007. The data has a dropping trend.
 28.7% incidents where reported in the morning and 71.3% in the evening. The most fires (19.5%) took place on Sunday, and the least (10.3%) on Thursday.
 Based on the 261 reports from years 2002 - 2018 most fires (18.0%) took place during April, and the least (3.8%) in July.
 Out of all 5,988 cases reported during the years 2002 - 2018, the most belonged to the categories: Rescue & EMS (51.1%), Hazardous Condition (14.8%), and False Alarm (11.7%).
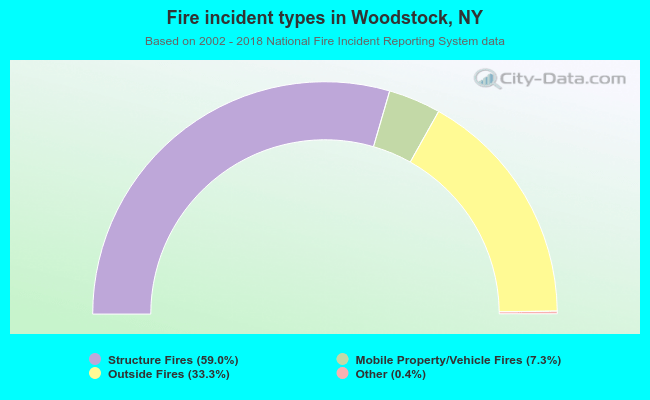 When looking into fire subcategories, the most reports belonged to: Structure Fires (59.0%), and Outside Fires (33.3%).