Wilmington: Fire Incidents, Massachusetts (MA)
Where are fire incidents reported in Wilmington, MA
Something went wrong! Please refresh the page.
| Fire incidents reported | |
|---|---|
| Sreet name | Count |
| MAIN ST | 254 |
| SALEM ST | 100 |
| LOWELL ST | 88 |
| MIDDLESEX AVE | 74 |
| BALLARDVALE ST | 68 |
| WOBURN ST | 68 |
| ANDOVER ST | 50 |
| GLEN RD | 44 |
| SHAWSHEEN AVE | 36 |
| I93SB HWY | 30 |
| CHURCH ST | 28 |
| I93NB HWY | 26 |
| INDUSTRIAL WAY | 26 |
| HORSESHOE LN | 24 |
| BURLINGTON AVE | 22 |
| CHESTNUT ST | 22 |
| WEST ST | 22 |
| CARTER LN | 20 |
| I93 SB39 | 20 |
| EAMES ST | 18 |
| I93NBR41 RAMP | 18 |
| MARION ST | 18 |
| PARK ST | 18 |
| WILDWOOD ST | 18 |
| FOREST ST | 16 |
| I93 NB40 | 16 |
| I93 NB41 | 16 |
| I93 SB38 | 16 |
| AVALON DR | 14 |
| BOUTWELL ST | 14 |
2002 - 2018 National Fire Incident Reporting System (NFIRS) incidents
- Incident types reported to NFIRS in Wilmington, MA
- 10,44260.2%Rescue & EMS
- 1,93411.2%False Alarm
- 1,6039.2%Hazardous Condition
- 1,2407.1%Service Call
- 1,2006.9%Fire
- 7204.2%Good Intent Call
- 1811.0%Special Incident
- Fire incident types reported to NFIRS in Wilmington, MA
- 53744.8%Structure Fires
- 34929.1%Outside Fires
- 23019.2%Mobile Property/Vehicle Fires
- 847.0%Other
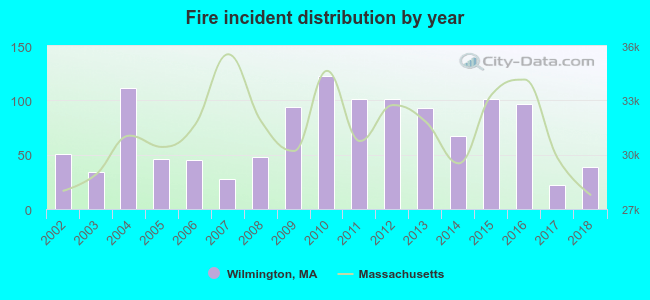 Based on the data from the years 2002 - 2018 the average number of fire incidents per year is 71. The highest number of reported fire incidents - 122 took place in 2010, and the least - 22 in 2017. The data has a declining trend.
The average number of yearly fire incidents per 10k residents in Wilmington, MA compared to nearest cities:
(Note: Based on data for the last 3 years, including only cities with population 5,000 and above)
| Wilmington: | 23.6 |
| Reading: | 29.9 |
| Burlington: | 36.5 |
| Tewksbury: | 29.8 |
| North Reading: | 24.2 |
| Billerica: | 27.3 |
| Woburn: | 52.0 |
| Wakefield: | 21.3 |
| Stoneham: | 58.2 |
 The median response time based on all reported fire incidents is 6 minutes. This is higher compared to the Massachusetts median value.
The median response time in Wilmington, MA compared to nearest cities:
(Note: Based on data for all years, including only cities with at least 500 fire incidents)
| Wilmington: | 6 minutes |
| Reading: | 4 minutes |
| Burlington: | 4 minutes |
| Tewksbury: | 4 minutes |
| North Reading: | 4 minutes |
| Billerica: | 4 minutes |
| Woburn: | 4 minutes |
| Wakefield: | 2 minutes |
| Stoneham: | 3 minutes |
 Based on the reports from the years 2002 - 2018 the average number of fire-related casualties per year is 1. The highest number of reported casualties - 3 took place in 2018, and the lowest - 0 in 2003. The data has an increasing trend.
The average number of injuries per 1,000 fire incidents is 16. This indicator was the highest - 91 in 2017, and the lowest 0 in 2003. The trend for casualties per 1,000 fire incidents is rising. Compared to the Massachusetts value the number of injuries per 1,000 incidents is about the same.
Based on the reports from the years 2002 - 2018 the average number of fire-related casualties per year is 1. The highest number of reported casualties - 3 took place in 2018, and the lowest - 0 in 2003. The data has an increasing trend.
The average number of injuries per 1,000 fire incidents is 16. This indicator was the highest - 91 in 2017, and the lowest 0 in 2003. The trend for casualties per 1,000 fire incidents is rising. Compared to the Massachusetts value the number of injuries per 1,000 incidents is about the same.Casualties per 1,000 incidents in Wilmington, MA compared to nearest cities:
(Note: Based on data for all years, including only cities with at least 500 fire incidents)
| Wilmington: | 10.0 |
| Reading: | 5.2 |
| Burlington: | 7.4 |
| Tewksbury: | 3.2 |
| North Reading: | 6.7 |
| Billerica: | 11.1 |
| Woburn: | 14.5 |
| Wakefield: | 5.8 |
| Stoneham: | 3.8 |
 32.6% incidents where reported in the morning and 67.4% in the evening. The most fires (16.2%) took place on Wednesday, and the least (13.4%) on Friday.
 Based on the 1,200 fire incidents from years 2002 - 2018 most fires (13.8%) took place during April, and the least (6.1%) in August.
 Out of all 17,343 cases reported during the years 2002 - 2018, the most belonged to the categories: Rescue & EMS (60.2%), False Alarm (11.2%), and Hazardous Condition (9.2%).
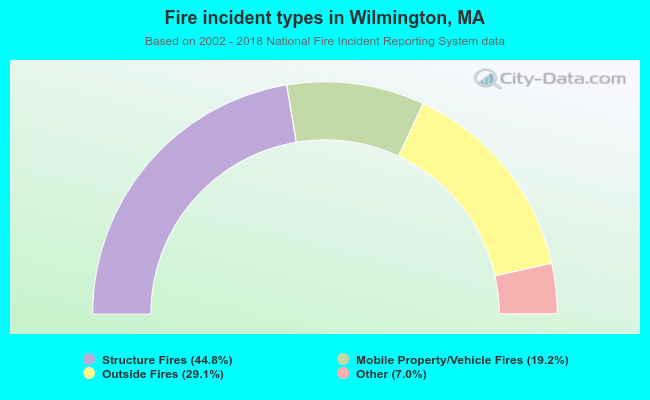 When looking into fire subcategories, the most incidents belonged to: Structure Fires (44.8%), and Outside Fires (29.1%).