| Fire incidents reported |
|---|
| Sreet name | Count |
|---|
| MAIN ST | 12 | | I-15 MM 357 | 10 | | HWY 89 | 8 | | I-15 | 8 | | I-15 MM 355 | 8 | | I15 | 8 | | I-15 MM355 | 6 | | INTERSTATE 15 | 6 | | WILLARD BAY | 6 | | 1387 N MAIN | 4 | | 200 | 4 | | 275 S 300 E | 4 | | 4000 N. | 4 | | 845 W 8700 S | 4 | | BOX ELDER COUNTY | 4 | | COUNTY FIRE | 4 | | HARGIS HILL RD | 4 | | I-15 MM 351 | 4 | | I-15 MM 353 | 4 | | I-15 MM 354 | 4 | | I-15 MM 356 | 4 | | I-15 MM 358 | 4 | | I-15 MM357 | 4 | | I15 LGTS | 4 | | 100 LGTS | 2 |
| | | Fire incidents reported |
|---|
| Sreet name | Count |
|---|
| 1005 S. HYW 89 HWY | 2 | | 1050 S HWY 89 | 2 | | 1100 S MAIN | 2 | | 1100 S MAIN AT THE CANNAL ROAD | 2 | | 114 E 200 S | 2 | | 126 OVERPASS | 2 | | 140 NORTH 100 EAST | 2 | | 140 S 200 E | 2 | | 1800 N AT THE RAILROAD TRACKS | 2 | | 200 LGTS | 2 | | 200 W 315 S | 2 | | 2005 W | 2 | | 235 S MAIN | 2 | | 25 E 300 N | 2 | | 255 E 100 N | 2 | | 30 NORTH MAIN STREET. | 2 | | 300 LGTS | 2 | | 300 S 400 W | 2 | | 40 W 50 S | 2 | | 485 W 8700 S | 2 | | 500 LGTS | 2 | | 52 S MAIN | 2 | | 6235 W 5800 S | 2 | | 7000 SOUTH HWY 89 | 2 | | |
|
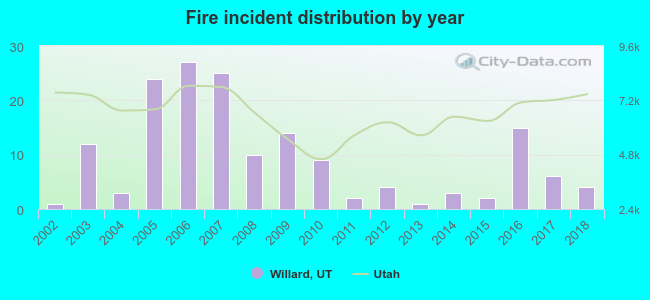 Based on the data from the years 2002 - 2018 the average number of fires per year is 10. The highest number of fires - 27 took place in 2006, and the least - 1 in 2002. The data has a rising trend.
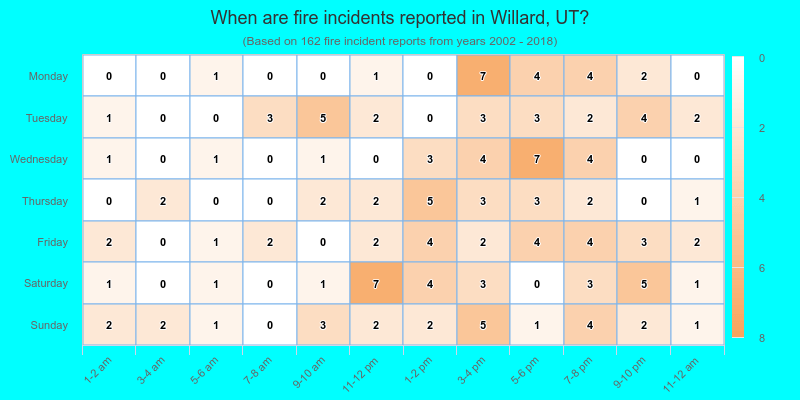
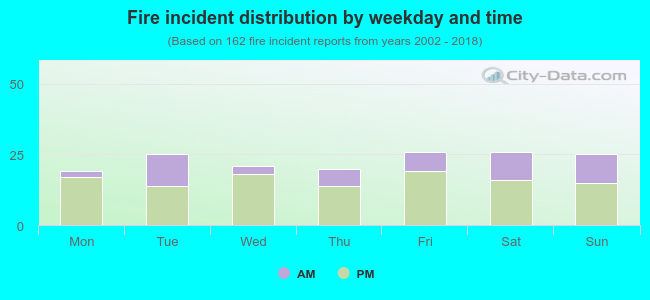 30.2% incidents where reported in the morning and 69.8% in the evening. The most fires (16.0%) took place on Friday, and the least (11.7%) on Monday.
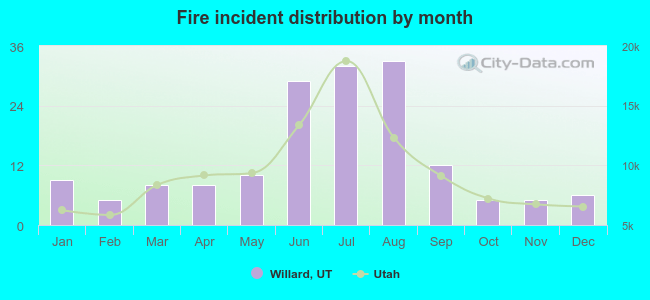 Based on the 162 incident reports from years 2002 - 2018 most fires (20.4%) took place during August, and the least (3.1%) in February.
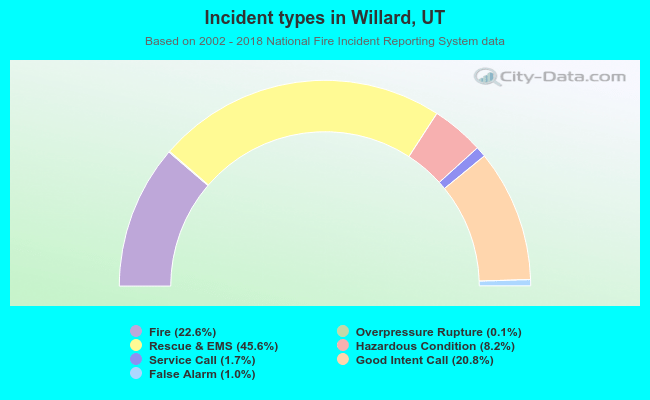 Out of all 717 cases reported during the years 2002 - 2018, the most belonged to the categories: Rescue & EMS (45.6%), Fire (22.6%), and Good Intent Call (20.8%).
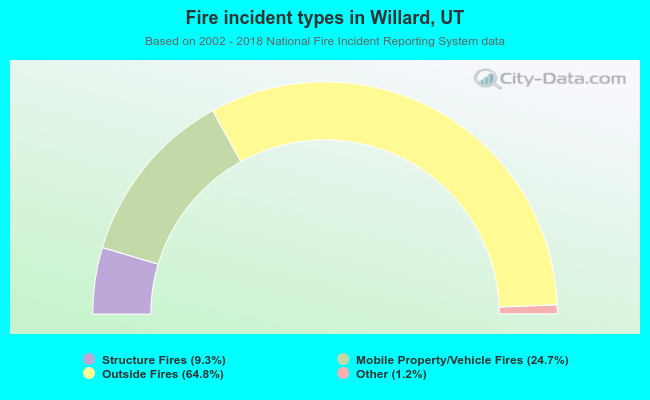 When looking into fire subcategories, the most incidents belonged to: Outside Fires (64.8%), and Mobile Property/Vehicle Fires (24.7%).