Wellsburg: Fire Incidents, West Virginia (WV)
Where are fire incidents reported in Wellsburg, WV
Something went wrong! Please refresh the page.
|
| |||||||||||||||||||||||||||||||||||||||||||||||||||||||||||||||||||||||||||||||||||||||||||||||||||||||||||||
| Other | 753 | |||||||||||||||||||||||||||||||||||||||||||||||||||||||||||||||||||||||||||||||||||||||||||||||||||||||||||||
2002 - 2018 National Fire Incident Reporting System (NFIRS) incidents
- Incident types reported to NFIRS in Wellsburg, WV
- 3,02647.2%Rescue & EMS
- 1,22719.1%Fire
- 75611.8%Hazardous Condition
- 6019.4%Good Intent Call
- 5769.0%Service Call
- 1502.3%False Alarm
- 540.8%Severe Weather
- 160.2%Overpressure Rupture
- Fire incident types reported to NFIRS in Wellsburg, WV
- 70457.4%Structure Fires
- 32826.7%Outside Fires
- 14011.4%Mobile Property/Vehicle Fires
- 554.5%Other
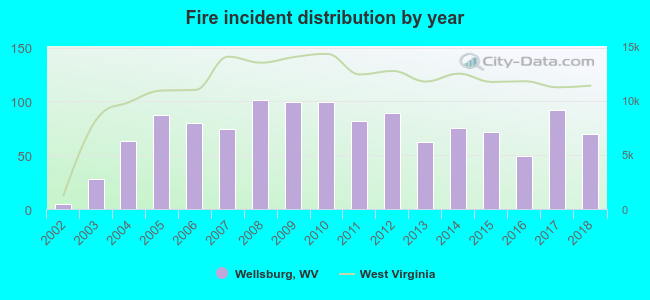 Based on the data from the years 2002 - 2018 the average number of fire incidents per year is 72. The highest number of fires - 101 took place in 2008, and the least - 5 in 2002. The data has an increasing trend.
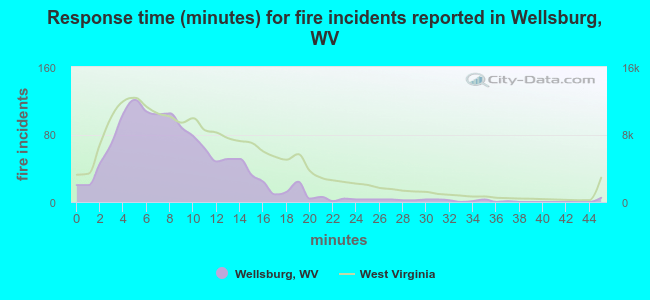 The median response time based on all reported fire incidents is 8 minutes. This is lower compared to the West Virginia median value.
The median response time in Wellsburg, WV compared to nearest cities:
(Note: Based on data for all years, including only cities with at least 500 fire incidents)
| Wellsburg: | 8 minutes |
| Mingo Junction: | 6 minutes |
| Follansbee: | 6 minutes |
| Steubenville: | 3 minutes |
| Weirton: | 5 minutes |
| Toronto: | 8 minutes |
| Martins Ferry: | 7 minutes |
| Wheeling: | 4 minutes |
| New Cumberland: | 12 minutes |
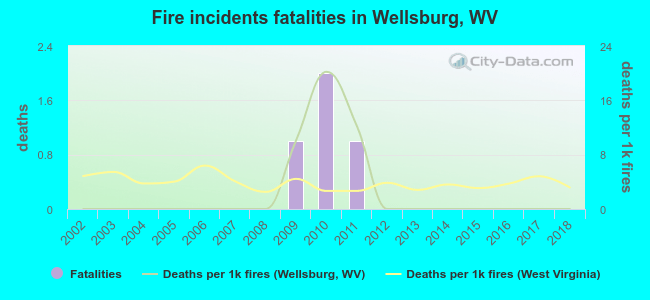 Based on the reports from the years 2002 - 2018 the average number of fire-related fatalities per year is 0. The highest number of deaths - 2 took place in 2010, and the lowest - 0 in 2002. The data has a constant trend.
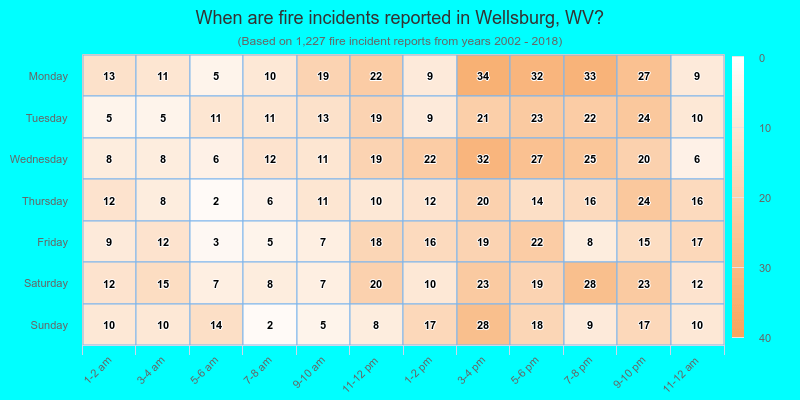
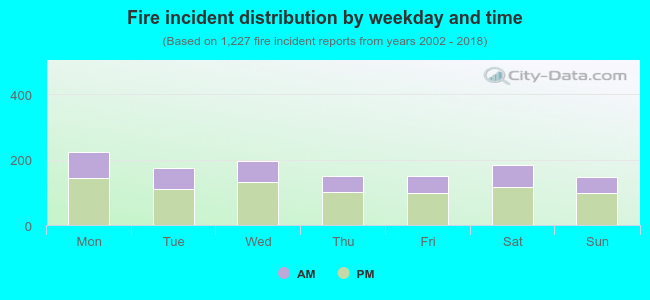 35.0% incidents where reported in the morning and 65.0% in the evening. The most fires (18.3%) took place on Monday, and the least (12.1%) on Sunday.
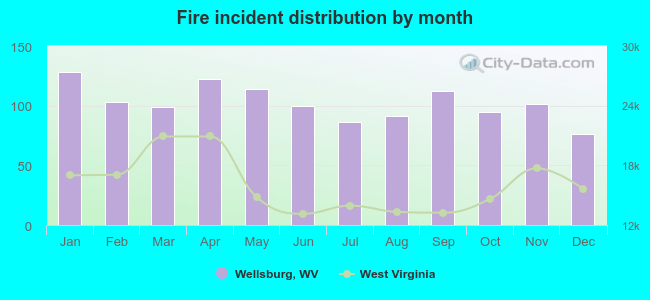 Based on the 1,227 fire incident reports from years 2002 - 2018 most fires (10.4%) took place during January, and the least (6.2%) in December.
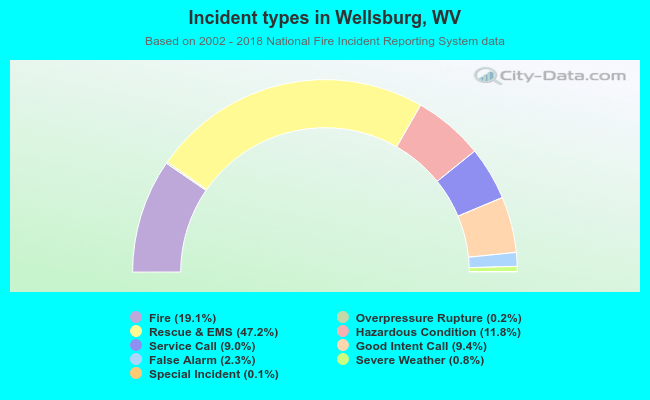 Out of all 6,411 cases reported during the years 2002 - 2018, the most belonged to the categories: Rescue & EMS (47.2%), Fire (19.1%), and Hazardous Condition (11.8%).
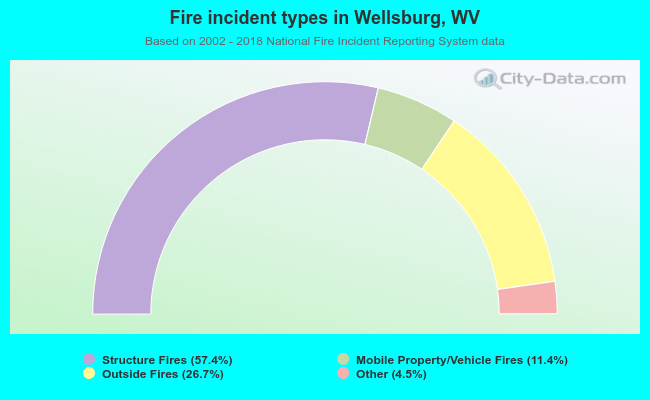 When looking into fire subcategories, the most incidents belonged to: Structure Fires (57.4%), and Outside Fires (26.7%).