Wausau: Fire Incidents, Wisconsin (WI)
Where are fire incidents reported in Wausau, WI
Something went wrong! Please refresh the page.
| Fire incidents reported | |
|---|---|
| Sreet name | Count |
| 3RD AVE | 80 |
| GRAND AVE | 76 |
| STEWART AVE | 72 |
| 1ST AVE | 52 |
| HIWAY 51 | 48 |
| 4TH AVE | 46 |
| 6TH ST | 44 |
| 2ND AVE | 42 |
| 9TH AVE | 40 |
| TOWNLINE RD | 40 |
| RIB MOUNTAIN DR | 38 |
| THOMAS ST | 38 |
| 3RD ST | 34 |
| 1ST ST | 32 |
| 5TH AVE | 32 |
| 7TH AVE | 30 |
| 7TH ST | 30 |
| SHERMAN ST | 30 |
| 11TH AVE | 28 |
| 10TH ST | 24 |
| 17TH AVE | 24 |
| JEFFERSON ST | 24 |
| WASHINGTON ST | 24 |
| WEST ST | 24 |
| 6TH AVE | 22 |
| FULTON ST | 22 |
| KICKBUSCH ST | 22 |
| MCINDOE ST | 22 |
| MOUNTAIN RD | 22 |
| WAUSAU AVE | 22 |
| Other | 589 |
2002 - 2018 National Fire Incident Reporting System (NFIRS) incidents
- Incident types reported to NFIRS in Wausau, WI
- 12,01266.0%Rescue & EMS
- 1,6739.2%Fire
- 1,4528.0%False Alarm
- 1,2847.1%Hazardous Condition
- 8594.7%Good Intent Call
- 8344.6%Service Call
- 460.3%Special Incident
- 310.2%Overpressure Rupture
- Fire incident types reported to NFIRS in Wausau, WI
- 84850.7%Structure Fires
- 42925.6%Outside Fires
- 28517.0%Mobile Property/Vehicle Fires
- 1116.6%Other
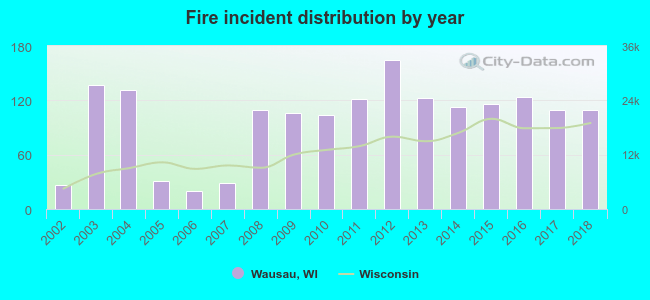 Based on the data from the years 2002 - 2018 the average number of fires per year is 98. The highest number of reported fire incidents - 164 took place in 2012, and the least - 20 in 2006. The data has an increasing trend.
The average number of yearly fire incidents per 10k residents in Wausau, WI compared to nearest cities:
(Note: Based on data for the last 3 years, including only cities with population 5,000 and above)
| Wausau: | 29.0 |
| Rib Mountain: | 16.5 |
| Weston: | 7.0 |
| Rothschild: | 30.8 |
| Kronenwetter: | 12.6 |
| Merrill: | 46.6 |
| Antigo: | 47.1 |
| Stevens Point: | 34.8 |
 The median response time based on all reported fire incidents is 5 minutes. This is lower compared to the state median value.
The median response time in Wausau, WI compared to nearest cities:
(Note: Based on data for all years, including only cities with at least 500 fire incidents)
| Wausau: | 5 minutes |
| Merrill: | 9 minutes |
| Stevens Point: | 5 minutes |
 Based on the data from the years 2002 - 2018 the average number of fire-related fatalities per year is 1. The highest number of reported deaths - 3 took place in 2008, and the lowest - 0 in 2002. The data has a constant trend.
 According to the reports from the years 2002 - 2018 the average number of fire-related casualties per year is 1. The highest number of reported injuries - 4 took place in 2016, and the lowest - 0 in 2002. The data has a growing trend.
The average number of casualties per 1,000 fires is 7. This indicator was the highest - 32 in 2016, and the lowest 0 in 2002. The trend for injuries per 1,000 fires is rising. Compared to the state value the number of injuries per 1,000 fires is lower.
According to the reports from the years 2002 - 2018 the average number of fire-related casualties per year is 1. The highest number of reported injuries - 4 took place in 2016, and the lowest - 0 in 2002. The data has a growing trend.
The average number of casualties per 1,000 fires is 7. This indicator was the highest - 32 in 2016, and the lowest 0 in 2002. The trend for injuries per 1,000 fires is rising. Compared to the state value the number of injuries per 1,000 fires is lower.Casualties per 1,000 incidents in Wausau, WI compared to nearest cities:
(Note: Based on data for all years, including only cities with at least 500 fire incidents)
| Wausau: | 7.8 |
| Merrill: | 11.4 |
| Stevens Point: | 17.3 |
 32.9% incidents where reported in the morning and 67.1% in the evening. The most fires (16.4%) took place on Sunday, and the least (11.8%) on Thursday.
 According to the 1,673 reports from years 2002 - 2018 most fires (11.2%) took place during April, and the least (5.6%) in February.
 Out of all 18,205 cases reported during the years 2002 - 2018, the most belonged to the categories: Rescue & EMS (66.0%), Fire (9.2%), and False Alarm (8.0%).
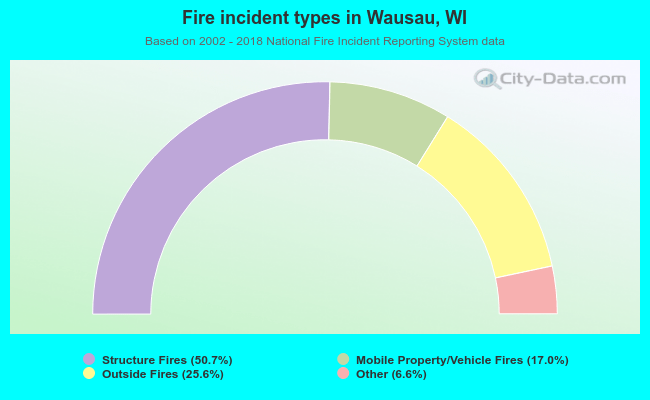 When looking into fire subcategories, the most reports belonged to: Structure Fires (50.7%), and Outside Fires (25.6%).