| Fire incidents reported |
|---|
| Sreet name | Count |
|---|
| CHESTNUT ST | 40 | | WALNUT ST | 38 | | GREEN HOLLOW RD | 32 | | PUTNAM RD | 18 | | WAUREGAN RD | 16 | | ALL HALLOWS RD | 14 | | GROVE ST | 12 | | MOOSUP POND RD | 12 | | JUNIPER LN | 8 | | CHESTNUT ST | 6 | | NORTH CHESTNUT | 6 | | BEATRICE AVE | 4 | | BRIDGE @ 205 | 4 | | CADY ST | 4 | | GREEN HOLLOW ROAD | 4 | | 102 SOUTH CHESTNUT ST. | 2 | | 143 SOUTH WALNUT | 2 | | 146 SOUTH WALNUT | 2 | | 387 PUTNAM ROAD | 2 | | 419 GREEN HOLLOW ROAD | 2 | | ANDERSON RD | 2 | | BASLEY RD | 2 | | BOYS AVE | 2 | | CHARLOTTE DR | 2 | | CHESTNUT STRE | 2 |
| | | Fire incidents reported |
|---|
| Sreet name | Count |
|---|
| CONRADS PARK | 2 | | DYER ST | 2 | | GLORIA AVE | 2 | | GREEN HALLOW RD | 2 | | GREENHOLLOW RD | 2 | | HARTFORD PIKE | 2 | | KNOX AVE | 2 | | LATHROP RD | 2 | | LITCHFIELD AVE | 2 | | MAPLE ST | 2 | | MARIE ST | 2 | | MOOSUP POND RD. | 2 | | MOOSUP RD | 2 | | NORTH CHESTNUT ST | 2 | | NORTH WALNUT LANE | 2 | | NORTH WALNUT ST | 2 | | NORWICH RD | 2 | | OLD PUTNAM RD | 2 | | PINE CREST DR | 2 | | PLAINVIEW DR | 2 | | PUTMAN RD | 2 | | PUTNAM ROAD AND OLD PUTNAM ROA | 2 | | ROPER RD | 2 | | RT.205& BRIDGE | 2 | | |
|
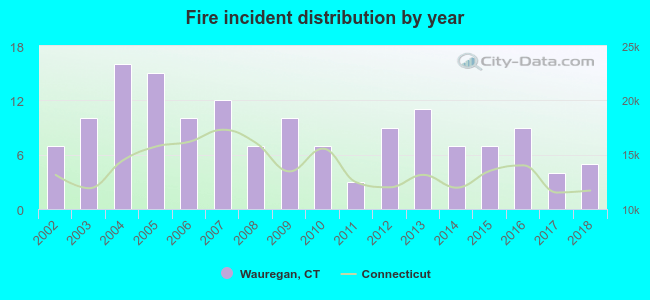 According to the data from the years 2002 - 2018 the average number of fires per year is 9. The highest number of reported fires - 16 took place in 2004, and the least - 3 in 2011. The data has a decreasing trend.
 39.6% incidents where reported in the morning and 60.4% in the evening. The most fires (27.5%) took place on Saturday, and the least (8.1%) on Sunday.
 Based on the 149 reports from years 2002 - 2018 most fires (12.1%) took place during April, and the least (4.7%) in February.
 Out of all 1,015 cases reported during the years 2002 - 2018, the most belonged to the categories: Overpressure Rupture (57.2%), Fire (14.7%), and Rescue & EMS (8.9%).
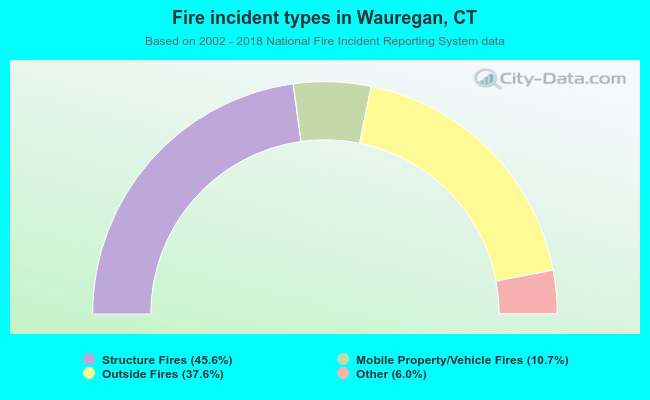 When looking into fire subcategories, the most reports belonged to: Structure Fires (45.6%), and Outside Fires (37.6%).