Union: Fire Incidents, Ohio (OH)
Where are fire incidents reported in Union, OH
Something went wrong! Please refresh the page.
|
| |||||||||||||||||||||||||||||||||||||||||||||||||||||||||||||||||||||||||||||||||||||||||||||||||||||||||||||
2002 - 2018 National Fire Incident Reporting System (NFIRS) incidents
- Incident types reported to NFIRS in Union, OH
- 40636.1%Hazardous Condition
- 21719.3%Fire
- 16814.9%Good Intent Call
- 1119.9%Rescue & EMS
- 1109.8%False Alarm
- 1059.3%Service Call
- 50.4%Overpressure Rupture
- 20.2%Severe Weather
- Fire incident types reported to NFIRS in Union, OH
- 11954.8%Structure Fires
- 8137.3%Outside Fires
- 177.8%Mobile Property/Vehicle Fires
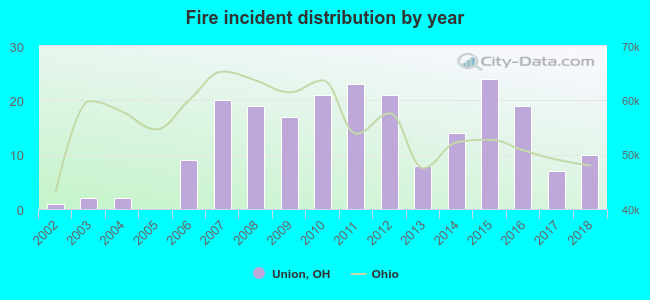 According to the data from the years 2002 - 2018 the average number of fire incidents per year is 13. The highest number of reported fire incidents - 24 took place in 2015, and the least - 0 in 2005. The data has an increasing trend.
The average number of yearly fire incidents per 10k residents in Union, OH compared to nearest cities:
(Note: Based on data for the last 3 years, including only cities with population 5,000 and above)
| Union: | 18.8 |
| Englewood: | 42.9 |
| Clayton: | 22.0 |
| Vandalia: | 55.9 |
| Brookville: | 101.8 |
| Trotwood: | 55.3 |
| Shiloh: | 12.6 |
| Tipp City: | 55.5 |
| Huber Heights: | 30.3 |

 Based on the reports from the years 2002 - 2018 the average number of fire-related yearly casualties is 0. The highest number of injuries - 1 took place in 2006, and the lowest - 0 in 2002. The data has a constant trend.
 22.6% incidents where reported in the morning and 77.4% in the evening. The most fires (17.1%) took place on Wednesday, and the least (10.6%) on Saturday.
 According to the 217 fire incident reports from years 2002 - 2018 most fires (11.5%) took place during August, and the least (4.1%) in November.
 Out of all 1,125 cases reported during the years 2002 - 2018, the most belonged to the categories: Hazardous Condition (36.1%), Fire (19.3%), and Good Intent Call (14.9%).
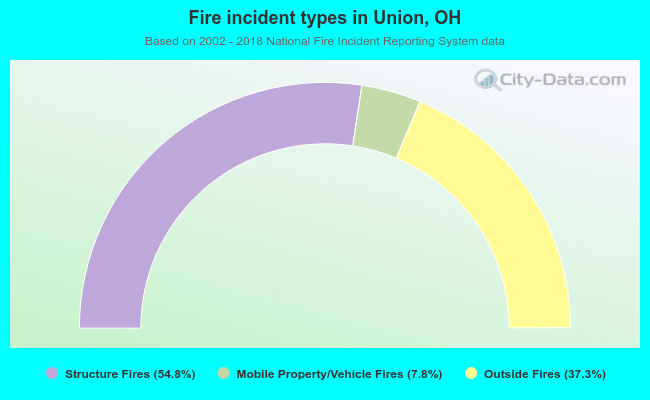 When looking into fire subcategories, the most reports belonged to: Structure Fires (54.8%), and Outside Fires (37.3%).