Torrington: Fire Incidents, Connecticut (CT)
Where are fire incidents reported in Torrington, CT
Something went wrong! Please refresh the page.
| Fire incidents reported | |
|---|---|
| Sreet name | Count |
| MAIN ST | 188 |
| MAIN ST | 118 |
| SOUTH MAIN ST | 118 |
| SUMMER ST | 116 |
| EAST MAIN ST | 86 |
| WINSTED RD | 84 |
| HIGHLAND AVE | 64 |
| LITCHFIELD ST | 58 |
| E MAIN STRT 202 | 52 |
| HIGHLAND AVE | 46 |
| LITCHFIELD ST | 46 |
| TORRINGFORD WEST ST | 46 |
| MIGEON AVE | 44 |
| WINSTED RD | 44 |
| PROSPECT ST | 42 |
| PROSPECT ST | 40 |
| TORRINGFORD ST | 40 |
| SUMMER ST | 38 |
| HIGH ST | 36 |
| EAST MAIN ST | 34 |
| WATER ST | 34 |
| NORTH ELM ST | 32 |
| WATER ST | 30 |
| NORFOLK RD | 28 |
| RIVERSIDE AVE | 28 |
| MIGEON AVE | 26 |
| HIGHLAND AV | 24 |
| NEWFIELD RD | 24 |
| OAK AVE | 24 |
| TORRINGFORD WEST ST | 24 |
| Other | 766 |
2002 - 2018 National Fire Incident Reporting System (NFIRS) incidents
- Incident types reported to NFIRS in Torrington, CT
- 5,50430.5%Hazardous Condition
- 3,36518.6%Rescue & EMS
- 2,70114.9%Service Call
- 2,38013.2%Fire
- 2,36713.1%False Alarm
- 1,6018.9%Good Intent Call
- 640.4%Severe Weather
- 590.3%Special Incident
- 280.2%Overpressure Rupture
- Fire incident types reported to NFIRS in Torrington, CT
- 1,36357.3%Structure Fires
- 58224.5%Outside Fires
- 35615.0%Mobile Property/Vehicle Fires
- 793.3%Other
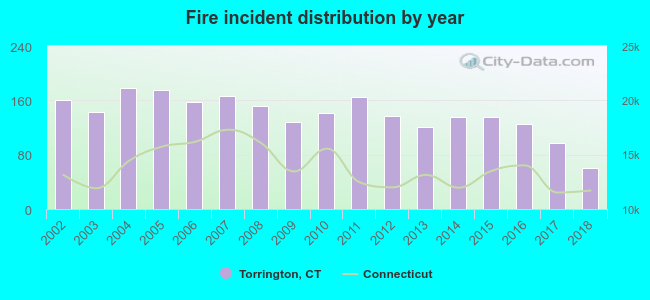 According to the data from the years 2002 - 2018 the average number of fire incidents per year is 140. The highest number of reported fires - 178 took place in 2004, and the least - 61 in 2018. The data has a declining trend.
The average number of yearly fire incidents per 10k residents in Torrington, CT compared to nearest cities:
(Note: Based on data for the last 3 years, including only cities with population 5,000 and above)
| Torrington: | 26.8 |
| Harwinton: | 42.5 |
| New Hartford: | 41.6 |
| Winchester: | 10.7 |
| Winsted: | 22.5 |
| Burlington: | 28.7 |
| Thomaston: | 23.2 |
| Canton: | 38.2 |
| Plymouth: | 3.7 |
 The median response time based on all reported fire incidents is 5 minutes. This is comparable to the state median value.
The median response time in Torrington, CT compared to nearest cities:
(Note: Based on data for all years, including only cities with at least 500 fire incidents)
| Torrington: | 5 minutes |
| Harwinton: | 7 minutes |
| Winsted: | 6 minutes |
| Avon: | 7 minutes |
| Bristol: | 4 minutes |
| Watertown: | 3 minutes |
| Farmington: | 7 minutes |
| Simsbury: | 5 minutes |
| Plainville: | 5 minutes |
 Based on the data from the years 2002 - 2018 the average number of fire-related fatalities per year is 0. The highest number of deaths - 1 took place in 2005, and the lowest - 0 in 2002. The data has a constant trend.
 Based on the data from the years 2002 - 2018 the average number of fire-related yearly casualties is 3. The highest number of reported injuries - 8 took place in 2002, and the lowest - 0 in 2013. The data has a decreasing trend.
The average number of casualties per 1,000 fire incidents is 19. This indicator was the highest - 50 in 2002, and the lowest 0 in 2013. The trend for injuries per 1,000 fire incidents is dropping. Compared to the Connecticut value the number of casualties per 1,000 fire incidents is higher.
Based on the data from the years 2002 - 2018 the average number of fire-related yearly casualties is 3. The highest number of reported injuries - 8 took place in 2002, and the lowest - 0 in 2013. The data has a decreasing trend.
The average number of casualties per 1,000 fire incidents is 19. This indicator was the highest - 50 in 2002, and the lowest 0 in 2013. The trend for injuries per 1,000 fire incidents is dropping. Compared to the Connecticut value the number of casualties per 1,000 fire incidents is higher.Casualties per 1,000 incidents in Torrington, CT compared to nearest cities:
(Note: Based on data for all years, including only cities with at least 500 fire incidents)
| Torrington: | 19.7 |
| Harwinton: | 0.0 |
| Winsted: | 0.0 |
| Avon: | 7.6 |
| Bristol: | 25.9 |
| Watertown: | 10.0 |
| Farmington: | 17.2 |
| Simsbury: | 6.9 |
| Plainville: | 31.2 |
 29.5% incidents where reported in the morning and 70.5% in the evening. The most fires (15.8%) took place on Saturday, and the least (12.8%) on Thursday.
 Based on the 2,380 reports from years 2002 - 2018 most fires (11.6%) took place during May, and the least (6.0%) in September.
 Out of all 18,069 cases reported during the years 2002 - 2018, the most belonged to the categories: Hazardous Condition (30.5%), Rescue & EMS (18.6%), and Service Call (14.9%).
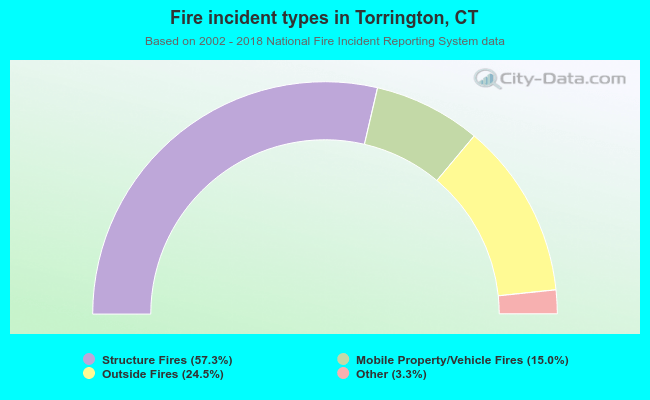 When looking into fire subcategories, the most reports belonged to: Structure Fires (57.3%), and Outside Fires (24.5%).